Mastering OPNsense Monitoring: A Comprehensive Guide to Network Security
OPNsense is a network security appliance that has become increasingly popular in recent years for use by large companies, small businesses, and individual users. The topic of OPNsense monitoring is a broad one, and we will briefly discuss what it entails before delving into the security monitoring section, which is the focus of this article.
When users think of monitoring in OPNsense, the following monitoring processes generally come to mind:
- Network traffic monitoring: OPNsense offers traffic monitoring capabilities that allow you to identify anomalies in your network traffic based on the source and destination IP addresses, ports used, and packet sizes. Monitoring network traffic is essential for identifying anomalies and suspicious traffic.
- System performance monitoring: Another monitoring process is system performance monitoring, which is often performed by administrators or users on a daily or regular basis. OPNsense provides users with a user-friendly interface to monitor system components that are frequently monitored, such as CPU usage, memory usage, disk usage, and bandwidth, through its dashboards and widgets. Performance bottlenecks can be identified, and actions can be taken to improve system stability with such monitoring.
- Application performance: OPNsense also has a monitoring capability that can be used to measure the performance of applications running on the system. For example, information can be easily obtained about the system and performance status of web servers, email servers, or VPN servers by monitoring them. This type of monitoring is again essential for identifying application bottlenecks or tracking anomalies in usage.
- Security event monitoring: Security event monitoring, which will form the next part of our article, is just as important as using OPNsense. No security product will perform its true function if it is not monitored and strengthened with the feedback it receives. For example, which packets are dropped, what warnings are received from the IDS, are there any anomalies in VPN connections, what are the security statuses of the sites visited by users, and taking actions by observing all the threats to the firewall from inside or outside are the foundations of our corporate or personal security.
In this article, we will focus on security monitoring, one of the monitoring processes mentioned above, and discuss different methods on why it is important and how it can be done. We will also discuss third-party monitoring tools in addition to the monitoring capabilities that are natively available on OPNSense. By the end of this article, you will have a comprehensive understanding of the importance of and how to do security monitoring on OPNsense.
Why is Monitoring Security Events Important?
When you talk about network security, you are talking about identifying and stopping security threats. It is essential to prevent data leaks, which are parts of our corporate cybersecurity strategy as well as our individual cybersecurity, to prevent malware from entering the network, and to perform network security monitoring to continue our compliance with legal compliance. It is a procedure that involves every single network and system administrator. Let's briefly explain why network security monitoring is so important.
- First of all, with security monitoring, threats can be easily detected and necessary actions can be taken. By performing instant monitoring, the dangers that users may be exposed to can be stopped before they even begin. In this way, data leaks that will seriously put companies in a difficult situation are prevented, and they will be protected from costly threats such as ransomware that demand ransom.
- Another issue is the performance of our network, and security monitoring has an important place in order for it to work with reliable stability. Security violations may be behind problems such as sudden traffic congestion, port scans, and heavy bandwidth usage. Repairing these is a critical process in terms of both performance and security management.
- Monitoring the network is one of the issues required for compliance with the legislation. For example, because a financial institution must be PCI DSS compliant, it must detect and prevent unauthorized access to its systems. This protection is among the obligations that must be observed to protect customer data.
- Threats to the organization can be more devastating than threats that may come from outside. The damage that a dissatisfied and over-authorized IT employee can do will be great. Network monitoring is one of the indispensable processes to prevent small-scale or large internal threats.
- Monitoring user behavior and generating violation reports will be valuable inputs for awareness training of systems with a large number of users. Providing training to high-risk users or reviewing bypassed rules will be possible through network monitoring.
What is the Difference Between Network Monitoring and Network Security Monitoring?
A network monitoring system keeps an eye on network activity to identify issues resulting from hardware malfunctions or overloaded resources like servers, routers, and network connections. Network monitoring measures three main metrics:
- Network availability (uptime): This metric indicates how well the network handles connectivity and throughput demands.
- Network performance: The bandwidth, throughput, latency, error rates, and jitter of the network are all measured.
- Network configuration: This process assigns network settings, policies, controls, and flows to facilitate communication.
If a network monitoring tool finds a problem with availability, performance, or configuration, it can send you an SMS or email to let you know. To figure out what is wrong and fix it, as a network administrator, you need to know about the network topology, configurations, performance, and even security.
On the other hand, a network security monitoring system keeps the company safe from possible weaknesses and attacks. Network security monitoring looks at more than one thing, while network monitoring only looks at one thing, like:
- Traffic flow
- Traffic patterns
- Network payload
- Network protocols
- Client-server communications
- Encrypted traffic sessions Network security monitoring's main goal is to keep an eye on the business environment all the time for threats and strange activities. Then, IT teams can look into the reported activities and take the right steps to fix them.
Monitoring network security is all about keeping your company's security infrastructure safe. It involves recording network traffic, checking it against what should be happening, and looking for any strange or malicious activity. Network security monitoring provides timely alerts and notifications in the event of a possible breach.
How is OPNsense Network Security Monitored?
There are a number of ways to keep an eye on the security of your network with OPNsense. Some of these are built-in features, and others are third-party solutions. Before applying these methods, you should complete the following tasks on OPNsense.
-
Enable security logging. OPNsense logs a variety of security events, such as firewall drops, intrusion detection alerts, and authentication failures. To enable security logging on OPNsense, go to System → Settings → Logging and select the security events that you want to log.
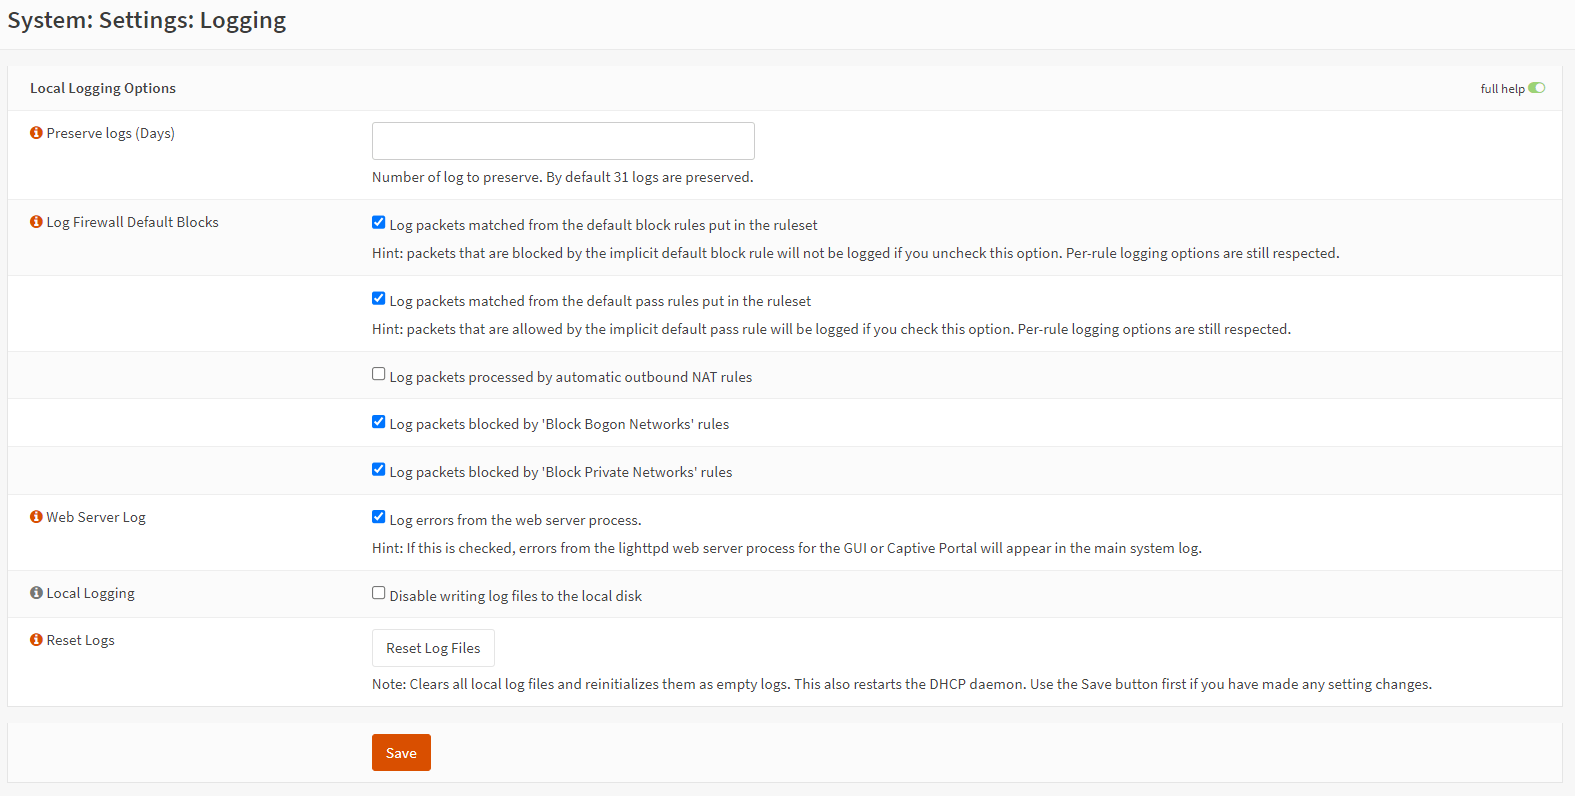
Figure 1. Enable logging on OPNsense
-
Install security monitoring plugins. OPNsense has a number of plugins that can be used to monitor security features, such as:
- Zenarmor: Zenarmor is a next-generation firewall (NGFW) plugin that provides a variety of security features, including deep packet inspection (DPI), application control, web filtering, intrusion detection and prevention (IDS/IPS), and threat intelligence.
- Prometheus: Prometheus is a monitoring and alerting system that can be used to collect and store metrics from a variety of sources, including OPNsense.
- Grafana: Grafana is a data visualization and dashboarding tool that can be used to display data from Prometheus in an easy-to-read format.
- Nagios and Zabbix: Nagios and Zabbix are both open-source enterprise monitoring tools that can be used to monitor OPNsense and other systems.
- Clam AV: Clam AV is an open-source antivirus scanner that can be used to scan for viruses and malware on OPNsense and other systems.
- Crowdsec: Crowdsec is an open-source intrusion detection system (IDS) that can be used to detect and block malicious traffic.
- Suricata: Suricata is a free and open-source network security monitoring system (NSM) and intrusion detection system (IDS).
- Ntop: Ntop is a network traffic analyzer that can be used to monitor network traffic and identify potential security threats.
To install a plugin, go to System → Plugins and click the Install button next to the plugin that you want to install.
What Security Monitoring Tools are Available in OPNsense?
OPNsense offers a comprehensive set of security monitoring tools to keep a vigilant eye on network activity and potential threats. These tools include Dashboard Widgets, System Logs, Traffic Graphs, Live View, Packet Capture, and Insight - Netflow Analyzer. Dashboard Widgets provide insights into network traffic and system component usage, which can indicate security threats. System Logs are invaluable for detecting anomalies and failed login attempts. Traffic Graphs help visualize network traffic patterns and detect anomalies. Live View offers real-time monitoring, allowing quick responses to security incidents. Packet Capture provides a detailed examination of network traffic for security breaches. Insight - Netflow Analyzer offers adaptable and quick analysis tools, including top user lists and graphical overviews. These tools collectively empower users to maintain the security and integrity of their network.
Let us begin by discussing the tools and methods for security monitoring on OPNsense, as well as the integrated tools provided by OPNsense.
Dashboard Widgets
You can use Dashboard to monitor the traffic load on your network and monitor the usage of system components such as CPU, RAM, and disk. Monitoring these components may provide indications of a security threat occurring on your network. To assess whether elements affecting system and network performance are a security threat, Dashboard will be a monitoring tool you use most to provide proactive solutions.
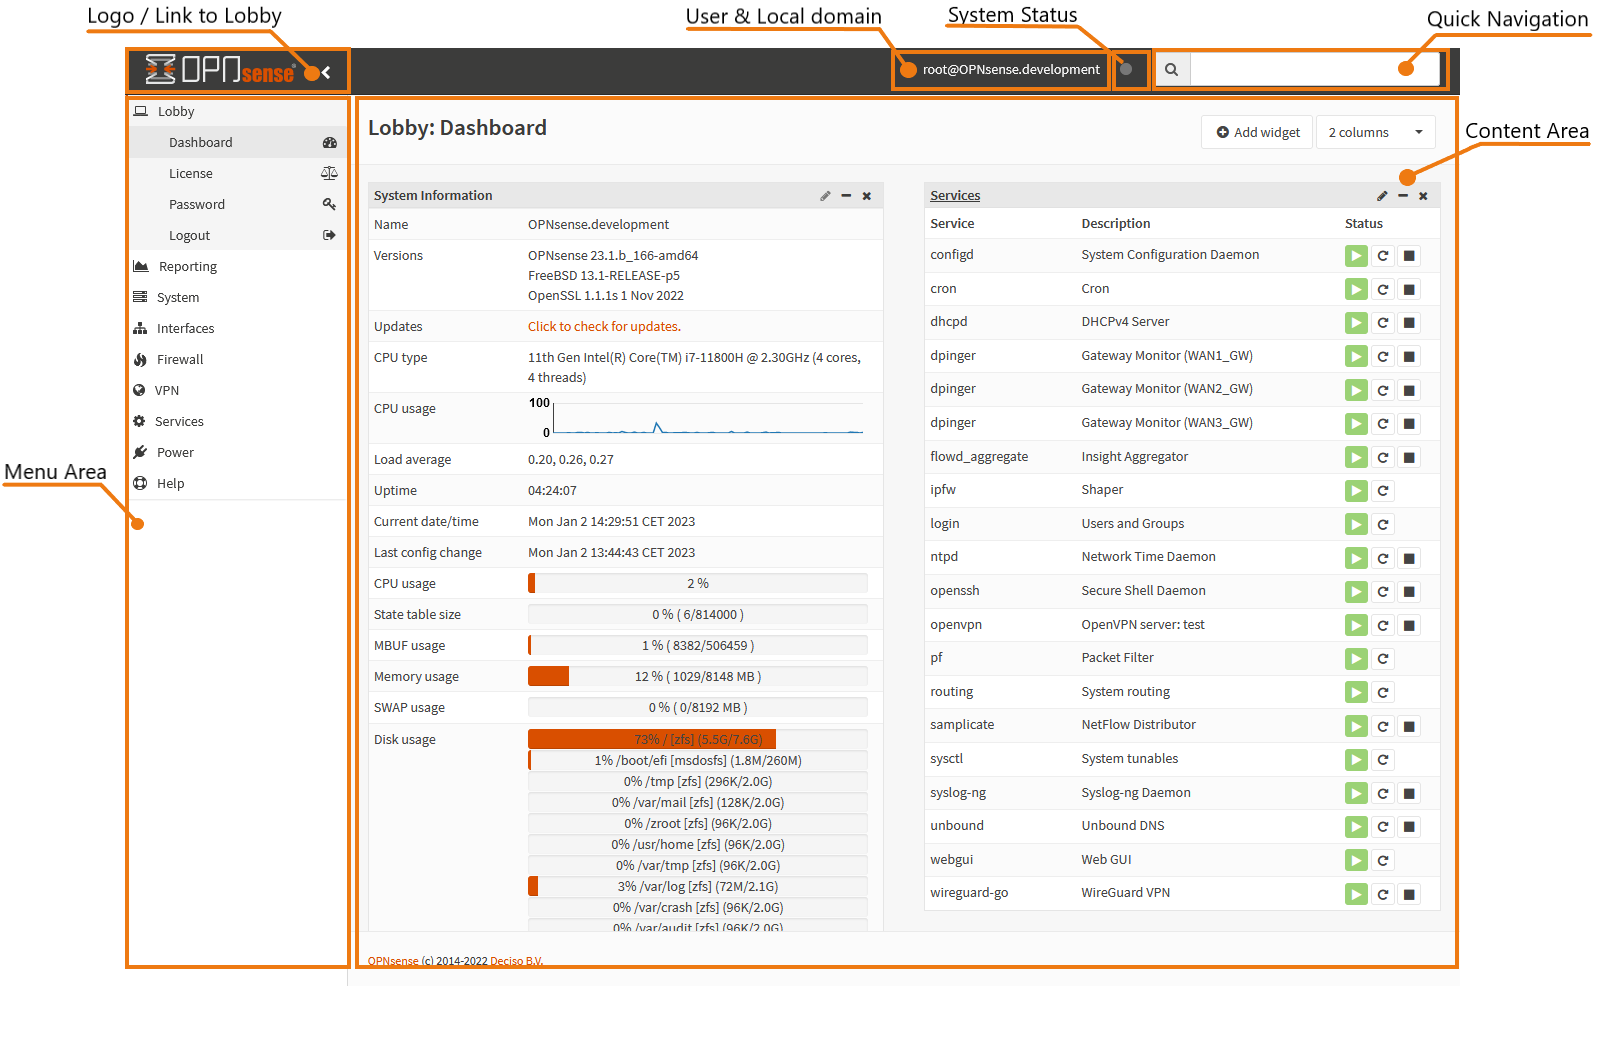
Figure 2. OPNsense Dashboard
System Logs
Secondly, one of the most frequently used monitoring tools is system logs. System logs contain information that is extremely important for security monitoring, such as failed login attempts. These logs are invaluable for detecting anomalies occurring on your network. It is important to monitor logs regularly to prevent or detect possible infiltration attempts and take appropriate action.
There are a number of different types of OPNsense system logs, including:
- System log: This log contains general system events, such as startup and shutdown messages, hardware and software events, and error messages.
- Backend / config daemon log: This log contains logs for the OPNsense config daemon, which is responsible for generating the configuration for the firewall and other services.
- Web GUI log: This log contains logs for the Lighttpd web server, which is used to serve the OPNsense web interface.
- Firmware log: This log contains logs from the OPNsense packaging system, which is responsible for installing and updating packages.
- Gateways log: This log contains logs from the Dpinger gateway tracking daemon, which is used to track the availability of default gateways.
- Routing log: This log contains logs for the OPNsense routing engine.
| Log Type | How to Enable | Description |
|---|---|---|
| System Log | System ? Log Files ? General | Most of all system related events go here |
| Backend / config daemon | System ? Log Files ? Backend | Here you can find logs for config generation of API usage |
| Web GUI | System ? Log Files ? Web GUI | Lighttpd, the webserver of OPNsense itself, logs here |
| Firmware | System ? Firmware ? Log File | Updates from the packaging system go here |
| Gateways | System ? Gateways ? Log File | Lists Dpinger gateway tracking related log messages |
| Routing | System ? Routes ? Log File | Routing changes or interface events |
Table 1. OPNsense Logs
In addition to the logs listed above, OPNsense also provides logs for specific services and features. For example, there are logs for the firewall, intrusion detection system, and intrusion prevention system. These logs can be helpful for troubleshooting problems with those specific services and features.
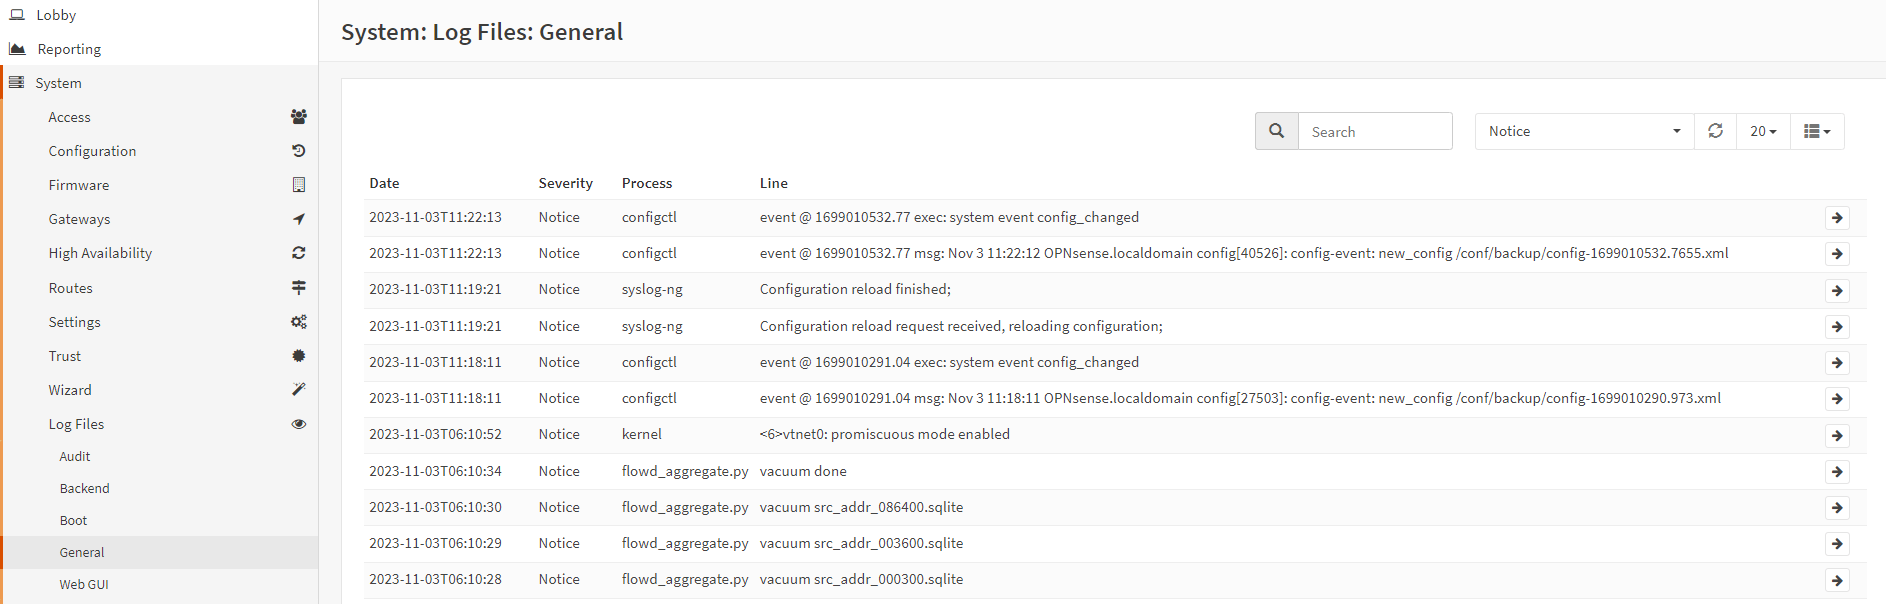
Figure 3. Viewing logs on OPNsense
Traffic Graphs
Network charts allow you to visualize traffic on your network with OPNsense and provide summary information about patterns in your network. It helps you understand what changes occur on the network at what hours or days. These changes will be very useful to detect possible anomalies in the network.
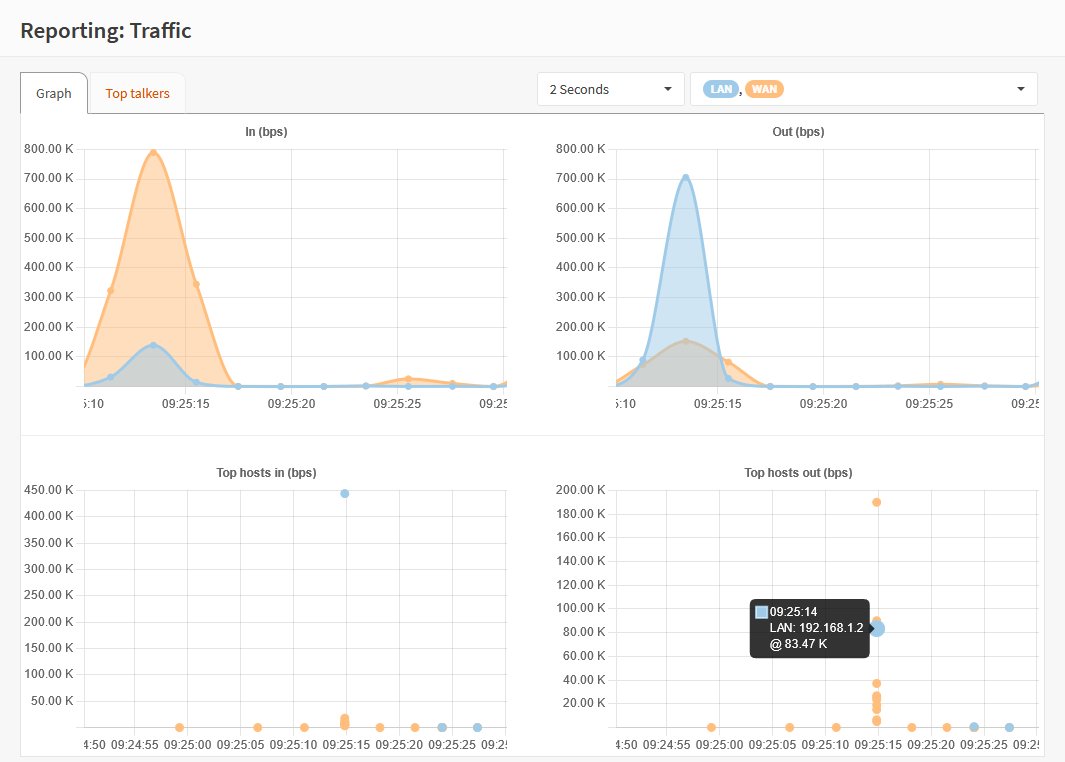
Figure 4. Traffic graphs on OPNsense
Live View
In some cases, instant monitoring may be required instead of historical analysis, and this is where live traffic monitoring comes into play. Real-time monitoring allows you to instantly observe all activities occurring on the network. This allows you to quickly detect potential security threats and take action accordingly. In particular, responding quickly to security incidents is extremely critical to protecting your network. The live view provides real-time information about network traffic, including the network protocols used.
Live View updates itself in real-time if a rule is matched that has logging enabled or one of the global logging options is enabled under System ? Settings ? Logging.
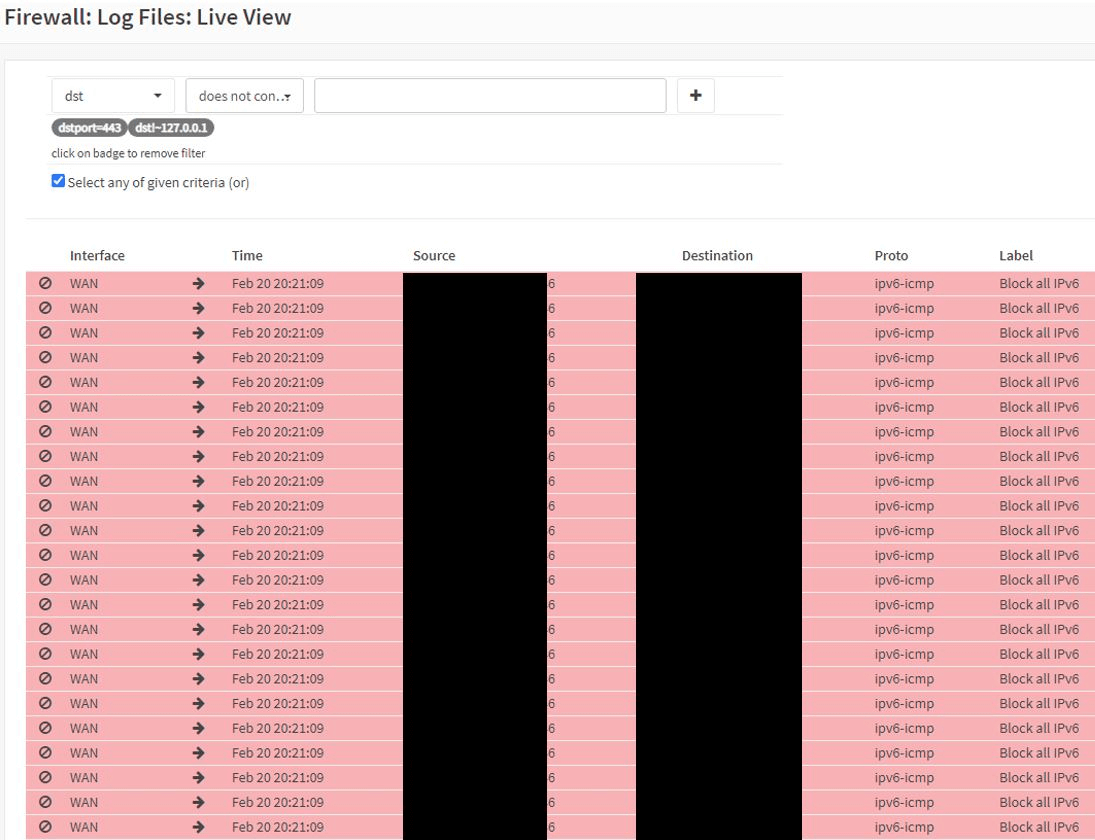
Figure 5. Live View Firewall Logs on OPNsense
Users can select different fields (e.g., label, source address, destination address) and specify matching criteria (contains, is, is not, does not contain) along with values. Filters can be added to the view with a [+] button.
The default behavior is to match all criteria with an AND condition, but users can change it to match any criteria with an OR condition, which is useful for tracking a specific list of hosts.
Detailed information for a rule can be accessed by clicking the info button associated with each line.
There are tips for understanding the host and port fields, which apply to both source and destination, to ensure traffic to and from a specific address or port is matched.
Typically, a rule contains a "rid" field that corresponds to the rule or set in the system, allowing users to navigate to the relevant configuration.
The live log only displays rules matched by the firewall. If a state is created, the flow is reported for the first packet, and no new lines are reported for the same traffic flow while the state exists. To inspect raw traffic, users can combine the live log with the packet capture feature found in the interface diagnostics menu.
It's important to note that log lines are stored on the system without an exact match to the rule, which may result in less accurate historical data if the firewall is reconfigured. Labels may be incorrect when looking at older data.
Packet Capture
Another monitoring tool you have will be packet capture and analysis. In the case of security incidents, packet capture helps you examine the incidents in detail and identify possible security breaches. Packets are analyzed to determine how attackers accessed the network, what data they stole, or what attacks they carried out. Tools such as Wireshark are often used for packet capture and analysis. Additionally, it may be necessary to document and prove events occurring on the network in accordance with legal or security requirements resulting from breaches. Packet capture is used to gather evidence in such cases. Captured data packets can be used to document potential breaches. The packet capture tool allows you to capture network traffic and analyze it for specific information, such as the network payload.
Using the packet capture module, one may perform an in-depth investigation of the traffic that is traveling across one or more network interfaces.
Tcpdump is used for packet capture, and it runs in the background. You can either use the View capture button in the jobs tab to look at the capture or download the pcap file(s) to look at them in a different program, like Wireshark.
Using Insight - Netflow Analyzer
Insight, the built-in Netflow Analyzer in OPNsense, is both adaptable and quick. One must set up the Netflow exporter for local Netflow data capture in order to use Insight.
Insight provides a comprehensive suite of analytical tools, from a graphical overview to a CSV exporter for use in your preferred spreadsheet program.
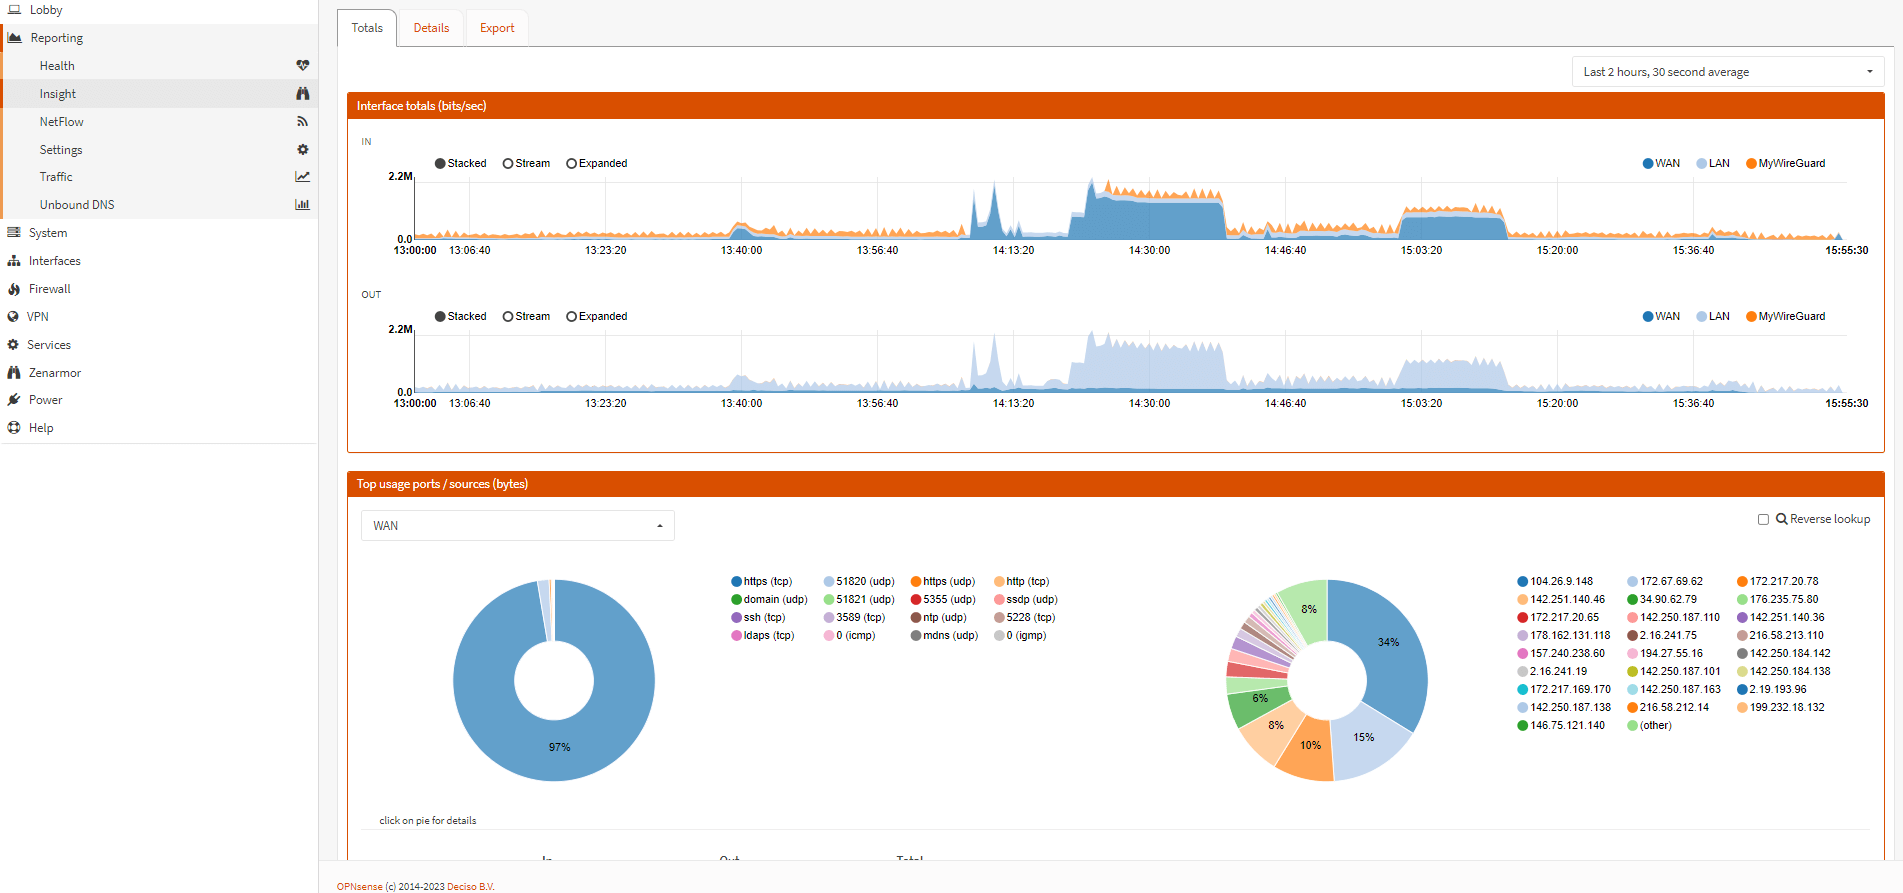
Figure 6. Insight Netflow Analyzer on OPNsense
Insight's default view is the "Top users and Graphical Overview," allowing users to quickly examine current and past flows with inbound and outgoing traffic graphs for each configured interface. Users can select the date range and resolution for traffic flows in the top right corner.
The "View Type" can be stacked, in a stream, or expanded for comparing usage across different interfaces. Clicking on an interface enables or disables the graph view, while double-clicking selects only that interface.
Insight provides a list of the top 25 users, including both ports and IPs, within the chosen date range for a selected interface. Additionally, there are pie charts for both ports/applications and IP addresses, showing percentages. Users can change the view by interacting with the displayed port or IP numbers.
Clicking on a segment of the pie chart opens a detailed view for further analysis. Insight also includes interface totals, displaying data for packets (In, Out, Total) and bytes (In, Out, Total) for the selected interface.
How to Set Up OPNsense Alerts and Notifications
There are two common ways to receive notifications and alarms on OPNsense: using Monit and configuring alarms via the Zenarmor plugin. Both methods are useful to increase your network security and keep you safe with OPNsense. Monit provides alerts at a transaction level for general network and service monitoring, while Zenarmor focuses on monitoring and notifications for more specific security threats. You can choose which method is more suitable for your needs.
-
Setting Up Email Notifications by using Monit: Monit is used by OPNsense to provide monitoring services. Because of Monit's powerful monitoring capabilities, a wide range of configuration options are available. Monit can be used to monitor VPN tunnels, ping remote systems, and restart services if they fail.
To set up alerts and notifications in OPNsense you may easily setup and configure Monit
-
Getting Alert or notification emails via Zenarmor: Zenarmor on your firewall provides 5 event log priorities for monitoring Zenarmor services:
- Emergency: These are extremely severe errors that can cause the Zenarmor application to terminate.
- Critical: Critical errors that might lead to the termination of the Zenarmor application.
- Error: Significant errors that may hinder normal Zenarmor execution but could allow the application to continue running
- Warning: Situations that might be of interest to end-users or system administrators, indicating potential problems on Zenarmor.
- Informational: User and admin-friendly messages highlighting the application's progress.
Zenarmor offers customizable notifications to keep you informed about important Zenarmor events. Different log priorities are represented by specific colors:
- Purple: Emergency
- Red: Critical
- Orange: Error
- Yellow: Warning
- Blue: Informational
To view these notifications, you can navigate to Zenarmor → Notifications on your OPNsense web UI. The highest-priority notifications are displayed by default. You can filter notifications based on event log priority or view all notifications.
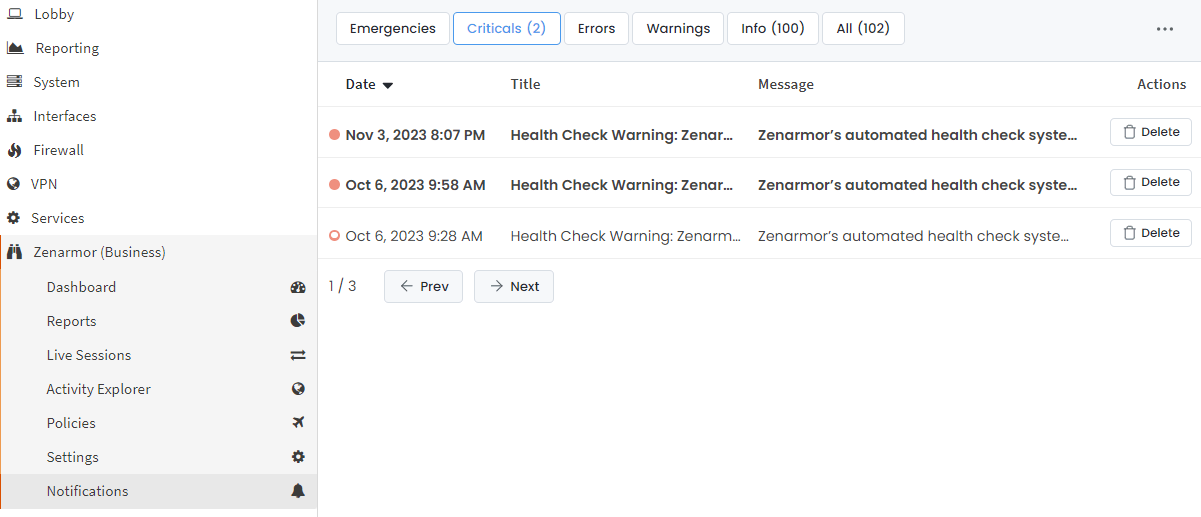
Figure 7. Zenarmor Notifications
The Notifications page provides details about each event log, including the date, title, message, and an action to remove a notification. You can navigate between pages if there are more than ten notifications.
How to Set Up OPNsense for Remote Logging?
Remote logging on OPNsense allows you to send log entries to a remote server. OPNsense's remote logging capabilities are appealing for a number of reasons.
-
Centralized logging: OPNsense can be used to centralize logs from multiple devices on your network. This can make it easier to monitor and troubleshoot problems.
-
Security: Remote logging can help improve the security of your network by storing logs on a separate server. This makes it more difficult for attackers to access and tamper with your logs.
-
Compliance: Some industries have regulations that require organizations to keep logs for a certain period of time. Remote logging can help you comply with these regulations.
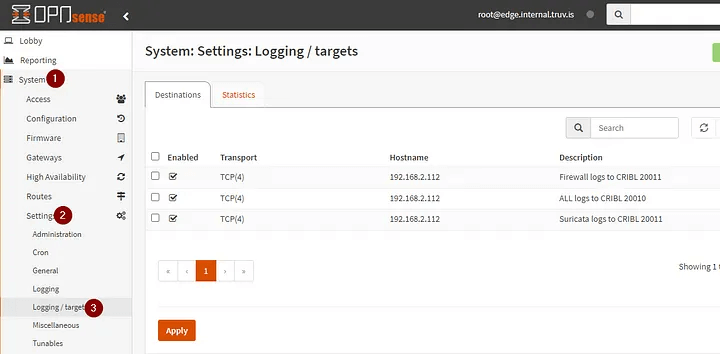
Figure 8. Logging targets on OPNsense
To set up OPNsense for remote logging, you will need to configure a syslog server to receive the logs from OPNsense. You can use any Syslog server, but some popular options include:
- Papertrail
- Loggly
- Splunk
- Elasticsearch
- Graylog
Once you have configured your Syslog server, you will need to configure OPNsense to send logs to the server. To do this, go to System → Settings → Logging/targets.
-
Click the Add button to add a new remote target.
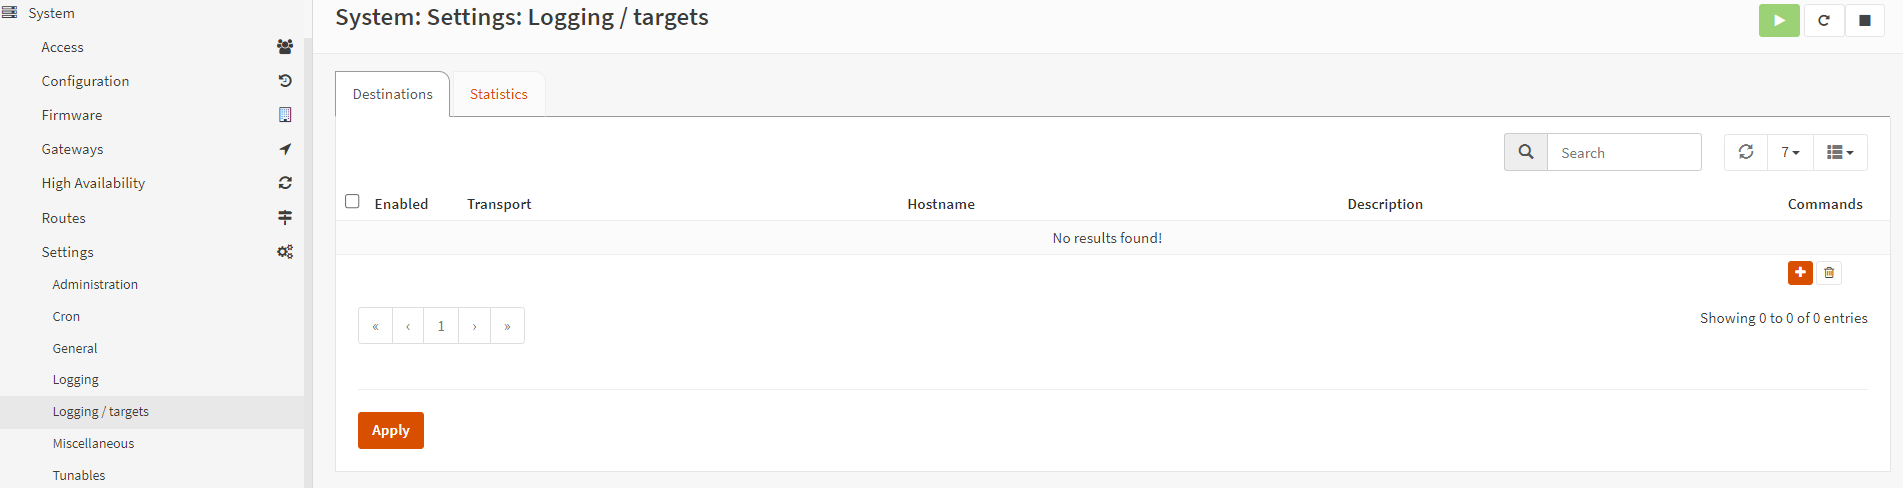
Figure 9. Adding Logging targets on OPNsense
-
In the Transport field, select the protocol you want to use to send logs to the server. OPNsense supports TCP, UDP, and TLS.
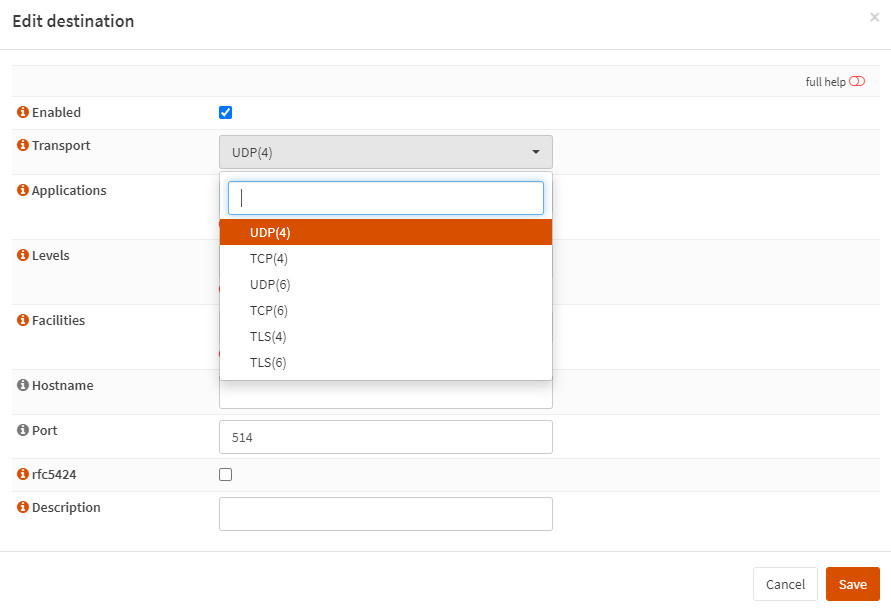
Figure 10. Selecting Trasport for Logging targets on OPNsense
-
Choose which applications should be forwarded to the specified target, omit to select all from Applications drop-down menu.
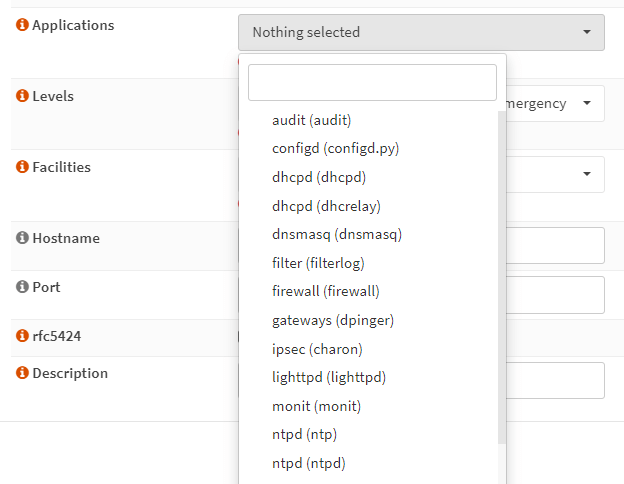
Figure 11. Selecting Applications for Logging targets on OPNsense
-
In the Level field, select the level of logs you want to send. The level specifies the severity of the logs.
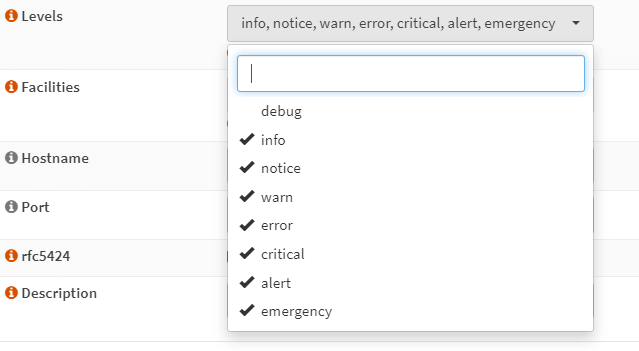
Figure 12. Selecting Levels for Logging targets on OPNsense
-
In the Facilities field, select the facility that you want to use for the logs. The facility specifies the type of logs that are being sent.
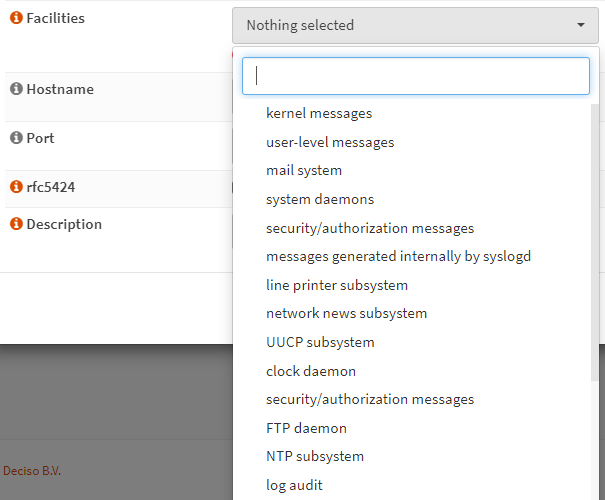
Figure 13. Selecting Facilities for Logging targets on OPNsense
-
In the Hostname field, enter the hostname or IP address of the syslog server.
-
In the Port field, enter the port number that the syslog server is listening on.
-
In the Description field, enter a descriptive name for the remote target.
-
Enable remote logging target by checking the Enable checkbox at the top..
-
Click the Save button to create the remote target.
-
Click the Apply button to activate your changes.
OPNsense will now start sending logs to the remote server. You can view the logs on the remote server using the web interface or the command line.
How to implement SNMP Monitoring for OPNsense?
Enabling SNMP (Simple Network Management Protocol) on OPNsense is essential for network administrators and security teams. SNMP offers benefits such as real-time network monitoring, fault detection, performance optimization, security monitoring, and capacity planning. It helps in troubleshooting network issues, provides compatibility with Network Management Systems (NMS), and captures historical data for analysis. SNMP is a standard protocol that allows customization to meet specific monitoring needs, making it a valuable tool for maintaining network performance, early issue detection, and enhancing network security and efficiency.
To enable SNMP monitoring for your OPNsense firewall you may follow the next steps:
-
Log in OPNsense web interface using root credentials.
-
Install the SNMP plugin named "OS-NET-SNMP" from the Firmware sub-menu under the System menu.
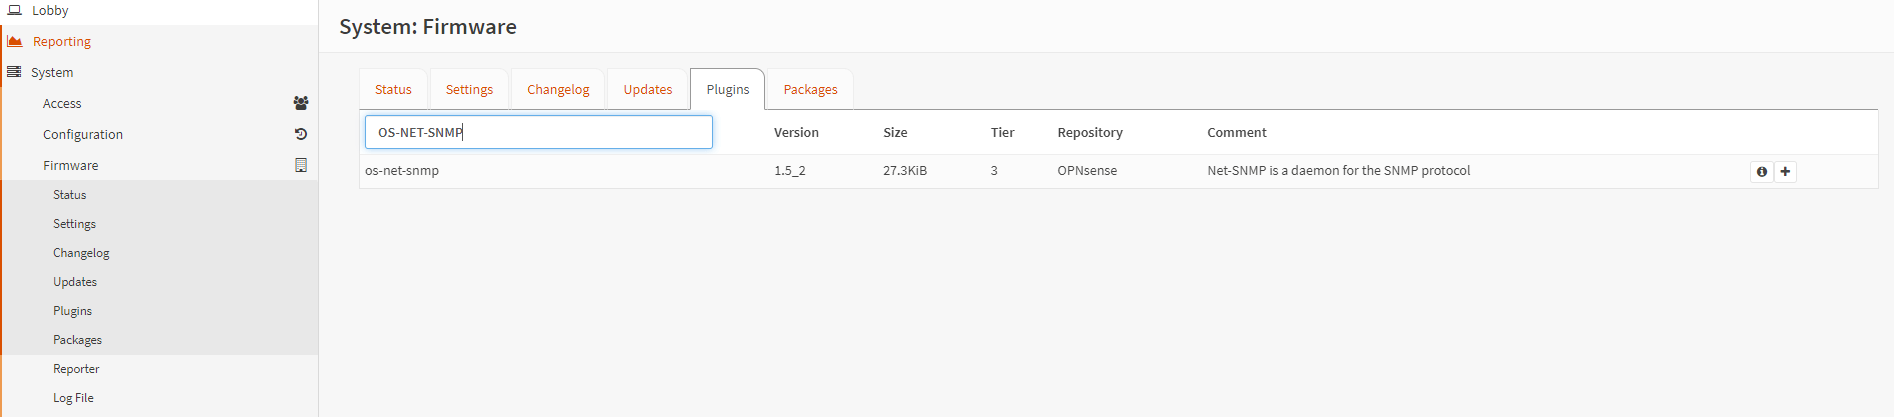
Figure 14. Installing the SNMP plugin on OPNsense
-
Click on the OPNsense logo at the upper left corner of the page to reload the web UI.
-
Navigate to the Services → NET-SNMP → General tab to configure SNMP settings.
-
Click the checkbox to enable SNMP service.
-
Specify an SNMP community name., and enabling Layer 3 visibility.
-
Optionally, set SNMP location and SNMP contact.
-
Enable Layer 3 visibility.
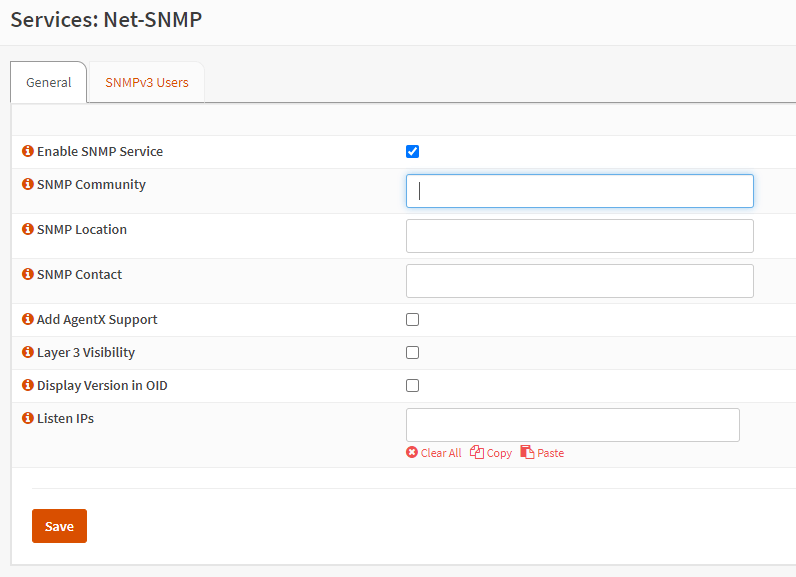
Figure 15. Configuring SNMP service on OPNsense
-
Click Save button to save the SNMP configuration.
-
Navigate to the SNMPv3 Users tab for secure SNMP settings.
-
Click the
+Add button to create a new SNMPv3 user.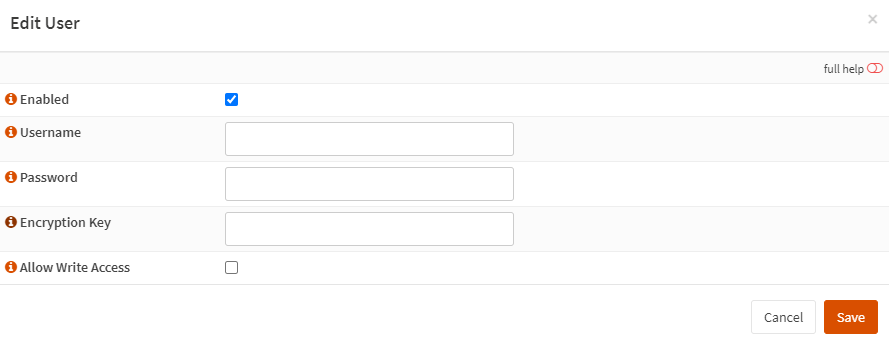
Figure 16. Add SNMPv3 user on OPNsense
-
Set the unique Username for the SNMPv3 user.
-
Set the password for the SNMPv3 user.
-
Set the Encryption key to secure the connection between client and OPNsense host. It must be a minimum of 8 characters.
-
To enable write access in addition to read-only you may check Allow Write Access option.
-
Click Save button to save the SNMPv3 user.
-
Test the SNMP configuration from a computer running Linux using the "snmpwalk" command, or from a Windows computer using an SNMP tester application with the SNMP community name and the OPNsense server's IP address.
How can Third-Party Monitoring Solutions Be Integrated with OPNsense?
OPNsense plugins offer a powerful array of tools for monitoring your network, enabling you to stay vigilant against threats, identify suspicious activity, and efficiently investigate potential security incidents. These plugins, when strategically employed, enhance your network security posture.
For instance, consider the Zenarmor, a cutting-edge Next-Generation Firewall (NGFW), that can seamlessly integrate with OPNsense as a plugin, bringing a host of compelling advantages to your network security strategy.
Zenarmor's outstanding features include Deep Packet Inspection (DPI), which scrutinizes all network traffic, even encrypted data, fortifying your network's defenses. It excels in Application Control, regulating and blocking harmful apps, and enhancing security. Zenarmor's Web Filtering thwarts malicious websites and phishing attacks, safeguarding against web-borne threats. Intrusion Detection and Prevention (IDS/IPS) swiftly counters known and emerging threats. Harnessing threat intelligence, Zenarmor neutralizes the latest threats in real time, preserving network security.
To further fortify your security strategy, the os-crowdsec plugin acts as a collaborative security engine, facilitating the detection and blocking of malicious traffic.
Real-time performance monitoring is indispensable in the realm of security, and os-netdata excels in this regard. It offers instant insights, enabling swift identification and response to security incidents as they unfold. In tandem, os-sensei, equipped with next-generation firewall extensions, becomes an indispensable asset, fortifying your network against a spectrum of threats, from malware to intrusions and denial-of-service attacks.
Completing this formidable security arsenal is os-suricata, a high-performance network IDS (Intrusion Detection System), IPS (Intrusion Prevention System), and security monitoring engine. It excels in the detection and blocking of a wide spectrum of attacks, ensuring your network's resilience.
By harmoniously integrating and utilizing these plugins, you have the potential to create a comprehensive and dynamic security monitoring solution tailored to your OPNsense firewall. This multifaceted approach bolsters your network's defenses, keeping it safeguarded against evolving threats and security challenges.
Zenarmor
The Zenamor plugin for OPNsense is one of the best and simplest ways to keep an eye on your network's safety. Zenarmor is an all-software instant firewall that can be deployed virtually anywhere. Zenarmor can be easily implemented on any platform with network connectivity because of its appliance-free, all-in-one, all-software, lightweight, and simple design. Whether virtual or bare metal. On-premises or in the cloud? Any Cloud...
Zenarmor is a powerful solution that can be integrated with your OPNsense to enhance network security and provide modern next-generation firewall features.
Zenarmor's many features make it possible to keep a bird's eye on the safety of your network. The following are a few of the features of Zenarmor's network security monitoring system.
Dashboard
The Dashboard is the first page of Zenarmor and allows you to view the most critical network activity at a glance. The Zenarmor Dashboard is a user-friendly interface that offers real-time insights into your network's security and performance. It includes:
- Notifications: Receive updates about database and engine changes.
- Threat Summary: Get an overview of detected security threats.
- Traffic Throughput Graph: Monitor network traffic in real-time.
- Top Charts: View top threats, hosts, and applications.
- Services Status: Check the status of Zenarmor-related services.
- System Utilization: Monitor CPU, disk space, and memory usage.
This dashboard empowers you to manage network security and stay informed about network activities efficiently.
Reports
Zenarmor's Reports module enhances network security monitoring capabilities with:
- Drill-Down Functionality: Allows security professionals to investigate network activity in detail, aiding in the identification of security threats and policy violations.
- Reporting Criteria Customization: Enables users to choose specific metrics and time intervals for reports, assisting in tracking security-related events over time.
- Real-Time Refresh: Automatic data updates ensure that network security analysts are continuously informed about the latest events and potential threats.
- Filtering for Security Focus: Offers filtering options to emphasize or exclude blocked connections and local traffic, helping security teams concentrate on pertinent data.
- Detailed Security Charts: Provides a range of charts to visualize and analyze network security aspects, including detected threats, blocked hosts, and more.
Zenarmor offers scheduled reports with automation, making it easy for security teams to generate and distribute reports regularly. These reports can be tailored to different audiences, such as business decision-makers or cybersecurity teams, and can be delivered on time in PDF format. Zenarmor includes an email delivery service, eliminating the need for configuring your own email service. This feature is particularly valuable for maintaining network security as it allows for timely reporting, ensuring that the right information reaches the right people. Zenarmor's advanced reporting capabilities equip security teams with the tools necessary for comprehensive network security monitoring and incident detection.
Notifications and alerts
Zenarmor provides a notification system that offers insights into network events and activities, classified by log priorities including Emergency, Critical, Error, Warning, and Informational. These notifications help network administrators and security teams monitor and respond to Zenarmor events effectively. Users can view and manage notifications based on priority levels, allowing them to focus on the most critical application issues.
Real time traffic view
The Zenarmor Live Session Explorer enhances network security monitoring capabilities in the following ways:
- Real-Time Connection Details: Provides a sortable format for detailed connection logs, allowing network security professionals to gain insights into current network activity.
- Multiple Report Views: Offers six distinct report views (Connections, Threats, Blocks, Web, DNS, TLS) to easily access specific log details relevant to different aspects of network security.
- Customization: Enables users to customize the layout, select specific time intervals, and refresh intervals for live session data, ensuring flexibility in monitoring.
- Filtering and Exclusion: Allows for the application of filters and exclusions to pinpoint specific network traffic, making it easier to identify and analyze relevant data.
- Session Blocking: Permits network administrators to block or allow specific connections directly from the Live Session Explorer, facilitating quick response to suspicious activity.
- Session Details: Provides the ability to view detailed session information, including block status, source and destination details, application data, and more, for comprehensive monitoring.
- Whois Query: Allows querying Whois records for destination domain names or IP addresses, aiding in the investigation of potentially malicious connections.
- Pinning: Users can pin session records to the top of the Live Session Explorer for in-depth traffic analysis and threat hunting.
The Zenarmor Live Session Explorer is a valuable tool for real-time network security monitoring and analysis, enabling quick responses to threats and efficient troubleshooting.
Activity Explorer
Zenarmor's Activity Explorer is a valuable network security monitoring tool offering real-time connection details, including application and web-based connections within the last 24 hours. Key features include customizable time intervals, refresh settings, and the ability to view and export connection data. This tool empowers network administrators to analyze network activity, detect potential threats, and maintain robust security.
Prometheus and Grafana
Prometheus is an open-source technology that provides monitoring and alerting functionality for a variety of environments, including OPNsense. It is capable of collecting and storing metrics as time-series data, with information recorded with a timestamp. Labels, which are optional key-value pairs, can be collected and recorded. Prometheus stores metrics in a time-series format, which means that it stores the value of the metric over time. This allows Prometheus to track changes in metrics over time and identify trends and anomalies.
Grafana is a data visualization tool that creates dashboards and reports from Prometheus data. Grafana can be used to create dashboards that display real-time data, as well as dashboards that display historical data. Grafana is used to create reports that can be exported to a variety of formats, such as PDF, CSV, and PNG.
Prometheus and Grafana are often used together to create a comprehensive monitoring solution. Prometheus collects and stores metrics, while Grafana visualizes the metrics and creates reports. This combination provides users with a powerful tool for monitoring the performance and security of their systems.
Here is an example of how Prometheus and Grafana can be used to monitor OPNsense:
- Prometheus is installed on a server and configured to collect metrics from OPNsense.
- Grafana is installed on a server and configured to connect to Prometheus.
- In Grafana, dashboards are created to display the OPNsense metrics collected by Prometheus.
- Grafana is configured to generate alerts when the OPNsense metrics exceed or fall below certain thresholds.
When an alert is generated, Grafana can send a notification to the user via email, Slack, or another messaging system. This allows the user to quickly identify and respond to potential problems with their OPNsense firewall.
Nagios or Zabbix
Nagios and Zabbix are two popular open-source network monitoring tools that can be used to monitor the performance and health of OPNsense devices. They are used to monitor the security of OPNsense networks. They can be applied to network payload monitoring as well. Nagios and Zabbix can be configured to monitor a variety of OPNsense metrics, including:
- CPU usage
- Memory usage
- Disk usage
- Network traffic
- System logs
- Security events
By monitoring these metrics, Nagios and Zabbix help to identify potential security problems, such as high CPU usage, low memory, or unusual network traffic. This information can then be used to investigate and resolve the problems before they cause a security breach.
In addition to monitoring metrics, Nagios and Zabbix are used to monitor the status of security services on OPNsense devices. For example, Nagios and Zabbix can be used to monitor the status of the firewall, intrusion detection system (IDS), and intrusion prevention system (IPS). If any of these services fail, Nagios and Zabbix can alert the administrator so that the problem can be resolved quickly.
Overall, Nagios and Zabbix are valuable tools that can be used to monitor the performance, health, and security of OPNsense devices and networks.
Here are some specific examples of how Nagios and Zabbix can be used to monitor the security of OPNsense networks:
- Alerting on unusual network traffic. Nagios and Zabbix can be configured to alert the administrator when they detect unusual network traffic, such as a sudden increase in traffic from a specific IP address or country. This can help to identify potential denial-of-service attacks or other malicious activity.
- Monitoring the status of security services. Nagios and Zabbix can be used to monitor the status of security services on OPNsense devices, such as the firewall, IDS, and IPS. If any of these services fail, Nagios and Zabbix can alert the administrator so that the problem can be resolved quickly.
- Auditing security logs. Nagios and Zabbix can be used to audit security logs for suspicious activity. For example, Nagios and Zabbix can be configured to alert the administrator when they detect failed login attempts or other security events.
By using Nagios or Zabbix to monitor the security of OPNsense networks, administrators can identify and resolve potential security problems before they cause a breach.
ClamAV
ClamAV is a powerful open-source antivirus engine designed to provide comprehensive protection by scanning and eliminating viruses, trojans, and various malware from files. It is a versatile solution that can be seamlessly integrated into OPNsense, a highly regarded open-source firewall and router software distribution.
When incorporated within OPNsense, ClamAV can enhance security measures through its flexible proxy and the widely recognized ICAP (Internet Content Adaptation Protocol) support. For optimal defense against a range of threats, including ransomware, trojans, and viruses, OPNsense can leverage external engines from reputable vendors. This collaborative approach augments security, further fortified by the built-in Intrusion Prevention System and Category-Based Web filtering. You can enable antivirus protection on your OPNsense router with C-ICAP and ClamAV Plugins by following the next main steps:
- Set up Basic Caching Proxy Server in OPNsense
- Enable Transparent HTTP and SSL Mode in OPNsense Proxy
- Install and Set up the ClamAV and C-ICAP plugins
- Configure ICAP in OPNsense
- Run EICAR Testing
One of the primary advantages of implementing virus scanning directly at the router level is the ability to intercept malicious network packets before they infiltrate your network. This security method proves especially valuable for safeguarding guest networks and other scenarios where you cannot guarantee that all clients have up-to-date antivirus software installed. Following the defense-in-depth principle means adding an extra layer of protection through a central antivirus system, even if the client already has antivirus software.
Crowdsec
CrowdSec is an open source Intrusion Prevention System (IPS) that uses crowd-sourced threat intelligence to protect your network from known threats. You can easily install and configure CrowdSec on your OPNsense firewall. It has two main parts: the agent and the bouncer. The agent monitors log files for malicious activity and reports to the CrowdSec community. The bouncer blocks IP addresses from accessing protected resources. CrowdSec can be configured with a local API (LAPI) to share and update threat intelligence information with the central API (CAPI). The main components of Crowdsec are outlined below:
- CrowdSec agent: The CrowdSec agent is a lightweight process that monitors log files for malicious activity. It can be installed on any system in your network, such as a firewall, web server, or database server. The agent collects information about incoming and outgoing traffic, such as the IP address of the source and destination, the port number, and the protocol used. The agent then uses this information to calculate a reputation score for each IP address.
- CrowdSec bouncer: The CrowdSec bouncer is a process that blocks IP addresses from accessing protected resources. It can be installed on a firewall or on the same system as the agent. The bouncer uses the reputation scores calculated by the agent to decide whether or not to block an IP address.
- CrowdSec LAPI: The CrowdSec LAPI is a local API that allows the agent and bouncer to communicate with each other and with the CAPI. The LAPI allows you to manage CrowdSec, such as viewing alerts and configuring scenarios and policies.
- CrowdSec CAPI: The CrowdSec CAPI is a central API that allows the CrowdSec community to share and update threat intelligence information. The CAPI provides access to additional features, such as the CrowdSec Console.
Zenarmor and CrowdSec are distinct solutions. Zenarmor is valuable when you require egress network traffic filtering, deep packet inspection, and application/web content filtering. In contrast, CrowdSec serves as a community-driven repository of malicious IP addresses. It can be employed to thwart malicious entities attempting actions such as brute force attacks on your systems or launching SQL injection attacks on inadequately sanitized input fields.
Suricata
An Intrusion Detection System (IDS) watches network traffic for suspicious patterns and can alert operators when a pattern matches a database of known behaviors. An Intrusion Prevention System (IPS) goes a step further by inspecting each packet as it traverses a network interface to determine if the packet is suspicious in some way. If it matches a known pattern the system can drop the packet in an attempt to mitigate a threat. The Suricata software can operate as both an IDS and IPS system.
Setting up Suricata IDS/IPS on OPNsense involves enabling and configuring Suricata, selecting and downloading rule sets, and scheduling updates. Properly maintaining and adjusting the system is crucial to ensure it functions effectively in protecting your network from intrusions.
Ntop
ntopng is a network traffic monitoring and analysis tool that can be installed on OPNsense. ntopng provides a variety of features, including:
- Real-time traffic monitoring
- Historical traffic analysis
- Application identification
- Network topology mapping
- Intrusion detection
- Performance monitoring ntopng is used to monitor network traffic on a variety of interfaces, including wired interfaces, wireless interfaces, and VPN interfaces. ntopng can also be used to monitor traffic to and from specific IP addresses, domains, and ports.