What is NetFlow?
NetFlow is a network monitoring protocol created by Cisco to gather information about the IP traffic that moves through network devices including routers, switches, and hosts. NetFlow is a unidirectional technology, meaning that when the server replies to the first client request, a new flow record is generated in the opposite direction. By examining NetFlow data, you may get a deep understanding of your network's performance and identify key information such as the origin and destination of traffic, quality of service, and the factors contributing to congestion. Traffic flow data tells a company's IT workers about the amount of traffic, where it comes from and goes, and which pathways are being used. These network traffic data are collected and utilized to track usage over time, identify issues, and plan upgrades. NetFlow is a one-way technique, so when the server answers the first client request, the process reverses and generates a new flow record. Using a NetFlow monitoring tool, you can easily and effectively monitor and analyze flow records for network traffic. This article has a lot more information on NetFlow. This material falls under the following headings:
- How Does Netflow Work?
- What Data Does NetFlow Collect and Analyze from Network Traffic?
- How Can Organizations Benefit from Implementing NetFlow Technology?
- What Are the Key Differences Between NetFlow and sFlow?
- Data Collection Method
- Granularity
- Vendor Support
- Overhead
- Protocol Variants
- Sampling vs. Flow-Based
- Protocol Use Cases
- Flow Export Interval
- Management and Analysis Tools
- How Does NetFlow Contribute to Network Monitoring and Management?
- What is the Role of NetFlow in Network Security and Anomaly Detection?
- What Are the Different Versions of NetFlow, and How Do They Compare?
- NetFlow v1
- NetFlow v5
- NetFlow v7 and v8
- NetFlow v9 (Flexible NetFlow)
- IPFIX (IP Flow Information Export)
- sFlow
- J-Flow (Juniper Networks)
- How Can NetFlow Data Be Used for Bandwidth Optimization and Traffic Analysis?
- What Tools and Software Are Commonly Used to Collect and Visualize NetFlow Data?
- Is There Any Best Practices for Implementing NetFlow in a Network Environment?
- What Are the Challenges or Limitations of Using NetFlow for Network Analysis?
- Can NetFlow Data Be Used for Compliance and Reporting Purposes?
- How Does NetFlow Relate to Other Network Monitoring and Analysis Technologies?
How Does Netflow Work?
When a packet arrives at the network device, the NetFlow data generation process begins. The device first checks to verify if the packet's 5-tuple is in the flow cache, which is a table of recently encountered flows.
The cache item is modified if the 5-tuple is present in the table: the packet count is increased by one, the byte count by the packet length, and so on. A new entry is added to the table if the flow is not in the cache, which suggests that the packet is part of a previously unidentified flow.
Of course, the primary purpose of NetFlow is to send information to a collector for storage or analysis. As a result, flow data is regularly exported to the flow collector through a process called flow expiration.
A particular flow entry expires in two scenarios:
- Inactive timeout: If a flow is dormant (no packets have been detected for it in a while), it is believed to have completed and the entry expires. Typically, the timescale for inactivity is set to 15 seconds.
- Active timeout: If a flow is operational for an extended period of time, it expires. Many platforms have a default active timeout of up to 30 minutes. An active timeout may appear paradoxical, but it exists to ensure that the flow analyzer receives information about long-running flows as soon as possible. Long flows are often "elephant" flows that convey vast volumes of data, and learning about them after they've finished is unproductive. A never-ending flow would never cease, hence avoiding discovery.
Furthermore, many devices are preprogrammed with suboptimal active timeout values. Thirty minutes, or even five, is too long. We recommend setting an active timeout of one minute so that the flow analyzer may receive information about the network more often and offer a more accurate picture of what's going on.
When the flow collector gets a flow entry, it sends it to the flow analyzer, which extracts and displays pertinent information.
To summarize, NetFlow employs a straightforward method of data collection, sorting, and analysis.
What are the NetFlow Components?
The key components of NetFlow are outlined below:
- NetFlow Exporter: A NetFlow-enabled device, often a router or firewall, serves as a flow exporter, collecting flow data. It organizes data packets into flows and sends NetFlow records to one or more NetFlow collectors using the User Datagram Protocol (UDP). The input interface port, the source and destination IP addresses, the source and destination port numbers, the Layer-3 protocol field, and the kind of service are the elements that the exporter identifies as being present in a flow. A flow is available for NetFlow export after being dormant for a certain amount of time. It's also ready when a TCP flag, such as FIN or RST, indicates that the flow is complete.
- Command-Line Interface: The Command Line Interface (CLI) is one of two NetFlow connection mechanisms for obtaining NetFlow data. It gives a quick view of your network traffic, which is important for troubleshooting.
- NetFlow Collector: A Netflow collector can be hardware or software-based, however, software-based instruments are more widely employed. NetFlow collectors acquire aggregated flow record data from flow exporter tools, which they subsequently preprocess and store.
- IP Flow: An IP flow is a collection of packets that have the same IP packet properties. A packet's source port, destination port, Layer-3 protocol type, class of service, router or switch interface, and IP source and destination addresses are among the several parameters that are examined when it is forwarded via a router or switch.
- NetFlow Analyzer: A NetFlow analyzer is a tool that processes and analyzes NetFlow data collected and stored by a flow collector. It converts data into reports and alerts that offer information about bandwidth utilization, bandwidth hogs, traffic patterns, application usage, and other performance indicators that can help uncover security risks and problems. This traffic flow analysis allows you to visualize your network's traffic and volume.
- Netflow Cache: The NetFlow cache is a database of condensed information that stores NetFlow data after packets have been inspected.
What Data Does NetFlow Collect and Analyze from Network Traffic?
NetFlow is commonly used to capture metadata about IP traffic passing through network devices such as routers, switches, and hosts. It monitors and delivers information on the performance of your apps and network. NetFlow data analysis can provide insight into network traffic flow and volume.
In order to store the flow records for network traffic analysis and management, a flow collector receives flow data information from a NetFlow-enabled device that generates metadata at the interface level. Network performance, packet loss, and traffic congestion are all determined at the interface level by a network operator using NetFlow data. Other network-level monitoring applications, such as DDoS detection and BGP peering, can also benefit from the utilization of NetFlow data.
NetFlow data can reveal useful information about network traffic and utilization. To effectively monitor NetFlow, a flow exporter collects data packets and provides flow records to one or more NetFlow collection servers. The collectors then store and prepare the data records for analysis, which can identify the source and destination of a flow record, as well as congestion sources.
Each analyzer takes different information from the input flow data.
- All flows are monitored by flow-monitored devices.
- Traffic by application, protocol, domain, source, and destination. IP addresses and ports
- Top addresses, discussions, and automated systems
- Geolocation-based sources and destinations, etc.
How Can Organizations Benefit from Implementing NetFlow Technology?
As network traffic continues to grow, enterprises must monitor their networks in real-time to guarantee optimal performance, detect abnormalities and threats, and comply with regulatory obligations. NetFlow is one technology that has proven beneficial in meeting these aims.
NetFlow is a network protocol that gathers information about IP network traffic and gives useful insights into its behavior and composition. Some advantages of utilizing NetFlow for network traffic analysis and monitoring in enterprises are as follows.
- Real-time visibility of network traffic: One of the key advantages of adopting NetFlow is that it gives you real-time visibility into network traffic. Monitoring NetFlow data allows network managers to immediately discover network congestion, bottlenecks, and abnormalities that may influence network performance. They identify network assaults, such as distributed denial of service (DDoS), and respond appropriately to neutralize them.
- Network Capacity Planning: NetFlow data are utilized to plan and optimize network capacity. By examining NetFlow data, network managers may discover which apps and services are using the most bandwidth and modify network resources accordingly. This allows enterprises to maximize network capacity, enhance network performance, and cut expenses.
- Improved security: NetFlow data may be utilized to improve network security. Monitoring NetFlow data allows network managers to discover anomalous network activities such as network scans, brute-force assaults, and malware infestations. They can then take necessary precautions to avoid or minimize these security hazards, such as banning suspicious IP addresses or quarantining infected hosts.
- Compliance with regulatory regulations: Many regulations, such as the Payment Card Industry Data Security Standard (PCI DSS) and the Health Insurance Portability and Accountability Act (HIPAA), require enterprises to monitor and audit their networks to verify compliance. NetFlow data can assist enterprises in meeting these criteria by giving visibility into network activity and identifying possible infractions.
- Cost-effective solution: NetFlow is an inexpensive solution for network traffic analysis and monitoring. Unlike traditional network monitoring systems, which require costly hardware and software, NetFlow may be implemented using existing network equipment and software. This makes it a cheap choice for businesses of any size.
- Network Troubleshooting and Performance Optimization: NetFlow data is useful for network troubleshooting and performance enhancement. By examining NetFlow data, network administrators may discover and rectify network issues such as poor response times or broken connections. They improve network performance by detecting traffic patterns and allocating resources accordingly.
- Integration with different network management tools: NetFlow data is compatible with various network management tools, such as intrusion detection systems (IDS) and security information and event management (SIEM) platforms. This integration gives network managers a complete picture of network behavior, allowing them to detect and respond to security risks more efficiently.
What Are the Key Differences Between NetFlow and sFlow?
Effective network monitoring and traffic control are critical to maintaining peak network performance. SFlow, NetFlow, and other tools provide diverse ways to monitor network traffic. A question emerges from time to time: SFlow vs. NetFlow, which is superior? We'll shed some light on the issue by comparing SFlow with NetFlow.
NetFlow and sFlow differ in various ways, including data collection method, granularity, vendor support, overhead, protocol variants, sampling vs. flow-based, protocol use cases, flow export interval, and management and analysis tools.
1. Data Collection Method
NetFlow captures data on every packet that enters or departs the interface, resulting in a significant volume of data. In contrast, sFlow takes data from a subset of packets, resulting in less data.
Furthermore, network managers may struggle to handle the large amounts of data gathered by NetFlow, whereas sFlow's decreased data gathering might make it easier to administer.
NetFlow, which gathers data on every packet, may have a substantial influence on network performance. NetFlow, in particular, can create a bottleneck in network traffic, resulting in packet loss. In contrast, sFlow reduces network performance by sampling only a portion of packets.
2. Granularity
To utilize NetFlow, we must set up each interface we wish to monitor, which might be time-consuming. On the other hand, sFlow requires just configuration on the switch, which expedites the setup process.
3. Vendor Support
NetFlow, which was developed by Cisco Systems, is most typically used with Cisco's flow analysis tools. In contrast, sFlow is supported by a greater range of network devices, including Cisco, Juniper Networks, and Hewlett-Packard.
SFlow was designed to be interoperable with a wide range of network switch and router platforms, and it employs a dedicated chip embedded into the hardware to alleviate the strain on the router or switch's CPU and memory. NetFlow is a proprietary technology that is included in Cisco's Internet Operating System (IOS). It's a software-driven technology.
4. Overhead
How much additional traffic will network monitoring generate? The purpose of network-wide visibility is to increase network performance; therefore, any additional traffic created by monitoring should be minimal and not impact performance.
The graphic depicts the overhead in terms of measurement records reported per packet throughout the network. The overhead associated with monitoring should be modest and consistent (less than 0.1% of traffic). Because flow-oriented monitoring (e.g., NetFlow) entails the production and export of flow records, the overhead is dictated by the average number of packets per flow. If there are a lot of packets in a flow, the overhead will be minimal. However, if the number of packets per flow is minimal, the overhead will be substantial, with the worst-case scenario being that a flow record is produced and exported for every packet on the network.
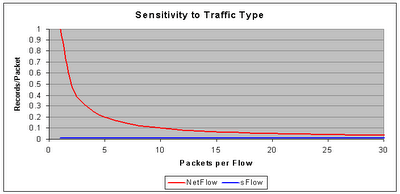
Figure 1. Overhead on NetFlow and sFlow*
In actuality, the number of packets per flow varies dramatically depending on the type of traffic being analyzed. DNS traffic has one packet per flow, but web traffic normally has 5-10 packets per flow, and multimedia streaming might have hundreds of packets per flow.
Flow monitoring's overhead can become extreme during a worm epidemic or when the network is subjected to a denial of service attack. In both circumstances, a high number of single packet flows are generated, and the extra cost caused by flow monitoring is likely to worsen the problem. The traffic bursts caused by flow monitoring exacerbate the impact of increasing measurement traffic on the network. During these moments, network visibility is critical for detecting and controlling threats.
The number of packets per flow has no effect on the overhead of sFlow because it is not a flow-based protocol. The use of packet sampling in sFlow reduces the overhead of traffic monitoring and guarantees accurate, timely, network-wide visibility without affecting network performance - even under intense traffic scenarios like a denial of service assault.
5. Protocol Variants
NetFlow does not provide packet samples directly to collectors; instead, it sends "flow records" to collectors that are generated by tracking a collection of packets connected with a session. The network device's RAM or TCAM has a single record containing this session-specific summary flow data. The device then exports a NetFlow datagram with numerous flow records. This stateful session tracking needs a portion of the network device's CPU and memory resources. When greater packet sampling rates are enabled, a large amount of resources may be used.
sFlow packet sampling is the process of randomly sampling individual packets. An average of one out of every N packet is chosen at random using a predetermined sampling rate. sFlow converts packet headers and partial packet payload data to sFlow datagrams, which are subsequently exported to collectors.
Because sFlow records the complete packet header, it may automatically offer full layer 2-7 visibility into all sorts of network traffic, including MAC addresses, VLANs, and MPLS labels, in addition to the Layer 3 and 4 information generally supplied by NetFlow. sFlow has a lower resource burden on devices since it merely does packet sampling, whereas NetFlow must identify and track sessions.
sFlow allows you to export interfaces and other system counters to collectors. Counter sampling is the process of periodically sampling or polling counters connected to a sFlow-enabled interface. sFlow collects interface data from counter records and sends it to collectors. sFlow analysis programs can then generate a report with the traffic data to help pinpoint network device faults. Three types of counters can be generated:
- On an interface, generic interface counters log traffic statistics and basic data.
- Ethernet interface counters record traffic data on an Ethernet interface.
- Processor information: tracks the CPU and memory consumption of a device.
6. Sampling vs. Flow-Based
The most important distinction between NetFlow and sFlow is their sampling approach. NetFlow analyzes network traffic at the interface level, collecting information on every packet that enters or departs the interface. In contrast, sFlow monitors network traffic at the switch level and gathers data on a portion of packets.
Flow packet sampling is the process of randomly sampling individual packets. An average of one out of every N packet is chosen at random using a predetermined sampling rate. sFlow converts packet headers and partial packet payload data to sFlow datagrams, which are subsequently exported to collectors.
sFlow is a pure packet sampling method. It is nearly impossible to obtain 100% precise figures for each host's traffic without using advanced algorithms to estimate the actual number of session bytes. While NetFlow may be virtually 100% accurate in determining who is communicating through the device while having a minimal impact on the CPU. It can monitor all incoming sessions on any NetFlow-enabled interface.
NetFlow help you manage IP-based traffic statistics, whereas sFlow can collect non-IP traffic by operating on Layer 2 and Layer 3 interfaces and sampling the majority of your network activity.
For example, if there is a rapid rise in network traffic, NetFlow can handle the strain with few flows despite the large packet volume. In contrast, sFlow has a 1:N sample rate, which increases the added workload. However, due to the sampling approach used by sFlow, some traffic may be missed, whereas NetFlow has the benefit of catching all network activity. NetFlow is used for network forensic investigation and threat identification. sFlow promises to be superior since it operates at the core hardware level.
7. Protocol Use Cases
Both NetFlow and sFlow are used to increase network visibility inside an organization. The purpose of NetFlow and sFlow is to reduce guessing while managing network services and making choices. Normally, NetFlow and sFlow are employed for the following purposes:
- Analyzing network and bandwidth use by users and apps
- Measuring WAN traffic and producing statistics to develop network rules
- Detecting inappropriate network usage.
- Confirming optimal bandwidth allocation using QoS factors
- Diagnosing and debugging network problems
- Packet forwarding information may be used in sFlow to assess the most active routes and the specific flows that these routes carry in your network. Understanding these routes and flows enables administrators to optimize routing and increase network performance.
It makes no difference what sort of flow technology you choose. As long as you select a network monitoring solution that supports both, you can concentrate your efforts on resource management and network optimization. Using the finest tools available is the key to managing large amounts of traffic data.
8. Flow Export Interval
NetFlow does not provide packet samples directly to collectors; instead, it sends "flow records" to collectors that are generated by tracking a collection of packets connected with a session. This session-specific summary flow data is saved as a single record in the network device's RAM or TCAM. The device then exports a NetFlow datagram containing many Sflow entries. This stateful session tracking needs a portion of the network device's CPU and memory resources. When larger packet sampling rates are enabled, a considerable number of resources may become accessible.
9. Management and Analysis Tools
An sFlow system is made up of various devices that sample packets at random and counters at regular intervals. The sampled packet and counter information, known as flow samples and counter samples, are transmitted as sFlow datagrams to the sFlow collector, a central server running software that analyzes and reports on network traffic. A sFlow monitoring system architecture includes the following main components:
- sFlow Agent: A function given to network equipment such as switches and routers that collects data from outgoing packets and forwards it.
- sFlow Collector: A function is allocated to examine the information for each sFlow agent produced.
- sFlow exporter: The sFlow exporter extracts prefixes from random samples of all packets that travel via the monitored interface. Based on a predetermined sampling rate, an average of one out of every n packet is randomly sampled. The exporter then assembles each sampled packet using device counts and transmits it to the sFlow collector. This method of sampling may not be very accurate, but it does provide vital information for making educated judgments. The device does not cache any of the data or sampled packets, resulting in reduced resource utilization. This guarantees that performance is not hampered and makes it simple to upgrade to high-speed networks. NetFlow operates by aggregating, storing, sorting, and analyzing flow data in a straightforward manner. A NetFlow monitoring system architecture is made up of the following major elements:
- Flow Exporter: The Flow Exporter organizes packets into flows and sends flow records to NetFlow collectors.
- Flow collectors: Flow collectors are software or hardware-based devices that receive, store, and pre-process flow data sent by the flow exporter. It contains a cache, or database, that stores NetFlow data after the packets have been inspected.
- Flow Analyzer: These are methods for analyzing received flow data, which offers greater insight into the nature of the data.
- When NetFlow-enabled devices, such as routers, receive packet flow, they are checked for a number of properties. These properties, or network traffic data, are then retrieved from all interfaces with NetFlow enabled. Once extracted, the router sends them as NetFlow records to NetFlow collectors for storage and preprocessing. This might be a standalone NetFlow analyzer program or a comprehensive network management suite that includes NetFlow as a supplementary feature.
- When the router deems that a flow is complete, it will export the flow records. NetFlow uses a method called sampling to decrease the amount of flow data exported by network devices. Flow records do not include the actual data that makes up the flow. They are just metadata, which is used to describe the data included in the flow.
How Does NetFlow Contribute to Network Monitoring and Management?
NetFlow data can reveal useful information about network traffic and utilization. To effectively monitor NetFlow, a flow exporter collects data packets and provides flow records to one or more NetFlow collection servers. These analyses, which collectors then record and prepare data logs for, can identify the source and destination of a flow log, as well as the causes of congestion.
NetFlow data helps you determine which users, applications, and protocols are using the most network capacity by tracking processes, protocols, times of day, and traffic routing. To summarize, NetFlow helps with network monitoring and management by giving precise information on network activity, performance, and trends, as well as identifying bottlenecks, abnormalities, security risks, and bandwidth use.
What is the Role of NetFlow in Network Security and Anomaly Detection?
You may use NetFlow to detect anomalies. Anomaly-based analysis monitors network traffic that deviates from "normal" behavioral patterns. You must define typical conduct. You may employ anomaly-based detection to protect against DDoS assaults and zero-day epidemics. DDoS assaults are frequently used maliciously to drain resources from your servers and network that could otherwise be utilized to serve legitimate users. The purpose of these assaults is to overload the victim's network or system resources, such as CPU and memory. In most situations, this is accomplished by sending several IP packets or fraudulent requests.
Particularly risky is when an attacker develops a more powerful assault using a more complex and successful way of compromising several computers and installing tiny attack daemons. These are commonly referred to as zombies, bot hosts, or networks. As a result, an attacker may launch a coordinated attack with thousands of zombies on a single victim. This daemon usually includes both the code for sourcing various assaults and some rudimentary networking infrastructure to enable remote control.
Typically, an anomaly detection system analyzes network traffic and alarms and then responds to any rapid spike in traffic or other anomalies.
NetFlow, along with other techniques like Syslog and SNMP, may be enabled in your infrastructure to provide the data required for recognizing and categorizing risks and abnormalities. Before deploying these anomaly detection capabilities, do traffic analysis to acquire a better knowledge of overall traffic rates and trends. Learning about anomaly detection is often done over a long period of time, taking into account both the highs and lows of network activity.
What Are the Different Versions of NetFlow, and How Do They Compare?
In high-speed networks, flow monitoring has emerged as the most used technique for traffic monitoring. The protocol was initially created by Cisco for its devices. Similar proprietary flow data formats have been established by other manufacturers that have adopted a similar strategy. Selecting the best flow format standard for your requirements might be challenging because there are several of them. Here, we'll go over the most popular flow forms and give a brief synopsis of their development and distinctions. The most common NetFlow versions are outlined below:
- NetFlow v1
- NetFlow v5
- NetFlow v7 and v8
- NetFlow v9
- IPFIX
- sFlow
- J-Flow
1. NetFlow v1
Cisco's initial version, limited to IPv4 only, is now outdated. The basic format supported by the first NetFlow releases was called V1.
2. NetFlow v5
When it was released in 2006, NetFlow v5 was the first version that was extensively used. Many switches and routers support NetFlow v5, which is still the most widely used version. However, because it is unable to support MAC addresses, VLANs, IPv6 traffic, or other extension fields, it can no longer accurately monitor flow.
The addition of flow sequence numbers and Border Gateway Protocol (BGP) autonomous system metadata to the V5 format is an improvement.
3. NetFlow v7 and v8
The NetFlow feature card (NFFC) on Cisco Catalyst 5000 series switches is only compatible with the Version 7 (V7) format, which is an improvement. Cisco routers are incompatible with V7. An improvement that incorporates router-based aggregation algorithms is the Version 8 (V8) format.
The datagram in Versions 1, 5, and 7 is made up of one or more flow records plus a header. The version number of the export datagram is contained in the header's first field. When a receiving program is compatible with any format version, it usually allocates a buffer big enough to hold the biggest datagram that can be created from any format version. The datagram's interpretation is then determined by the header. To search through the records, utilize the second field in the header, which has the number of records in the datagram.
The header data in V8 data is formatted in the same way as the previous versions. On the other hand, the aggregation algorithms supporting router-based aggregation divide the V8 flow record formats. You see five tables that explain the V8 flow record format for each unique aggregation strategy, rather than just one flow record table.
In order to verify that datagrams are coming from a legitimate NetFlow source, we advise receiving apps to do a sanity check on the datagrams. To ensure that the datagram is at least long enough to accommodate the version and count fields, you should first check its size. Next, you should confirm that the version (1, 5, 7, or 8) is correct and that there are enough bytes received to create the header and count flow records (using the relevant version).
Datagram loss is a possibility with NetFlow export, as export datagrams are sent via UDP.
The headers of version 8 have a flow sequence number. The number of flows in the preceding datagram plus the sequence number of that datagram equals the sequence number. The receiving application can determine the number of missed flows by deducting the expected sequence number from the sequence number in the header after receiving a new datagram.
Before the data is transmitted to the FlowCollector, you can condense FlowCollector export data on the router using one of the five router-based aggregation algorithms available in Datagram format Version 8. As a result, NetFlow data gathering devices require less bandwidth and a smaller platform.
By keeping one or more additional NetFlow caches with various field combinations that decide which conventional flows are grouped together, router-based aggregation makes on-router aggregation possible. Aggregation caches are these additional caches. Flows are added to each configured aggregation cache when they expire from the main flow cache. The typical flow aggregation procedure operates in the same manner as it does on the main cache in each active aggregation cache. Aging on-demand is also supported.
4. NetFlow v9 (Flexible NetFlow)
NetFlow v9 included a number of new enhancements. The most crucial is template support, which guarantees that NetFlow may be modified to support new protocols and permits a flexible flow export specification. Additional enhancements include multiprotocol label switching (MPLS), support for IPv6, virtual local area networks (VLANs), and other capabilities. The majority of the most modern Cisco switches and routers support NetFlow v9.
To put it briefly, v9 transmits blank flow records that act as the template. In order to let the NetFlow collector know what to anticipate, they explain the fields, values, and offsets inside the flow record. Since they are delivered often, the format of the flow records really varies.
The list can be expanded to include the new field types when extensibility is necessary. The NetFlow export format stays the same, but the exporter and collector need to be modified with the additional field types.
Although the information from the Netflow V9 export is more flexible and can yield more information, the information from the V5 export is fixed and limited.
5. IPFIX (IP Flow Information Export)
IPFIX complies with IETF standards and may be implemented by many manufacturers. It is based on the NetFlow Version 9 implementation. The Internet Engineering Task Force (IETF) released the protocol proposal for IPFIX (Internet Protocol Flow Information eXport) in 2008. To export flow data from network devices to a collector or network management system, IPFIX needs to act as a standard protocol. Compared to NetFlow, IPFIX is more adaptable and enables the addition of other network traffic data to flow data. As an illustration, our Flowmon IPFIX extensions add application layer protocol metadata, network performance metrics, and other information to the IPFIX flow data to enhance it. Within the Cisco community, IPFIX is commonly known as NetFlow v10 and offers a range of extensions akin to Flowmon.
As you can see, there is a brief mention of IPFix. IPFix is essentially the NetFlow v9 IETF standard (NetFlow was originally a proprietary technology developed by Cisco). When compared to NetFlow v9, there are a few differences.
6. sFlow
In contrast to NetFlow, sFlow relies on sampling. Using sFlow sampling, a sFlow agent gathers traffic data and wraps it into sFlow packets, which are subsequently transmitted to the collector. The two sample modes offered by sFlow are flow and counter sampling.
Flow sampling is the process by which the sFlow agent parses packets to learn about the content of the packets after sampling them in one or both directions on an interface, depending on the sampling ratio.
The process of the sFlow agent regularly obtaining traffic data on an interface is known as counter sampling.
While counter sampling concentrates on broad traffic statistics, flow sampling monitors and analyzes traffic behaviors on the network by focusing on specific traffic specifics. However, it is impossible to have an accurate picture of the traffic due to packet sampling, and some traffic will be missed. For this reason, sampling may restrict the use of flow data in situations such as network anomaly identification. However, it may be applied to DDoS attack detection and top statistics. Cisco has released NetFlow Lite, a technique that is quite close to sFlow.
7. J-Flow (Juniper Networks)
IP traffic flow data may be gathered using Juniper Networks' proprietary accounting technology, J-Flow. You may export data from a J-Flow collector to a UDP port using J-Flow. In order to get network data for certain network locations, you may activate J-Flow on a router or network interface.
The protocol used by J-Flow is connectionless (UDP). A switch or router's data send causes the J-Flow record to be cleared. Data delivery is not guaranteed via UDP. Therefore, employing a J-Flow flow source may lead to erroneous displays of both traffic quantities and bidirectional flows, as well as decreased alerting capabilities. Since J-Flow traffic is derived from sampled data, it may not accurately reflect all network activity.
How Can NetFlow Data Be Used for Bandwidth Optimization and Traffic Analysis?
NetFlow data is utilized to plan and optimize network capacity. By examining NetFlow data, network managers discover which apps and services are using the most bandwidth and modify network resources accordingly. This allows enterprises to maximize network capacity, enhance network performance, and cut expenses. Here are the best techniques to evaluate network data using NetFlow:
-
Select an appropriate NetFlow collector and analyzer: A NetFlow collector is a software or hardware device that accepts and saves NetFlow data from network devices that implement the protocol, such as routers, switches, firewalls, and servers. A NetFlow analyzer is a software or hardware device that processes, visualizes, and reports on NetFlow data, giving information on network traffic patterns, trends, and behaviors. There are several NetFlow collectors and analyzers available on the market, each with unique features, capabilities, and prices. You should select a NetFlow collector and analyzer that fits your unique requirements, including scalability, compatibility, security, customization, and integration.
To evaluate network data using NetFlow, first choose an appropriate NetFlow collector and analyzer. This tool will collect, store, and understand network data flows. When deciding, emphasize ease of use, scalability, and capabilities customized to your individual requirements. Once configured, the program will record data packets, providing insights into traffic patterns, bandwidth use, and possible bottlenecks. Regularly examining this data helps to optimize network performance. For deeper dives, filter data based on particular factors, such as IP addresses or protocols. Always keep a lookout for unexpected trends, since they may signify security issues. Combining a dependable tool with proactive monitoring results in an efficient and safe network.
-
Filter and aggregate NetFlow data: NetFlow data may be overwhelming and loud, particularly in big and complicated networks. Filtering and aggregating NetFlow data based on IP addresses, ports, protocols, interfaces, applications, or time periods help minimize its amount and complexity. Filtering and aggregating NetFlow data allows you to focus on the most relevant and critical information, such as the top talkers, listeners, protocols, or apps in your network. You may use filtering and aggregation to isolate certain traffic flows or segments for additional investigation.
Begin by gathering data and then focusing on certain parameters. Perhaps you are interested in traffic from a specific IP range or protocol. Filtering narrows down the data, making patterns more visible. Next, aggregate or group the data. Instead of focusing on individual data points, consider them as aggregate summaries, such as hourly traffic numbers. This provides a bird's-eye view, allowing you to see patterns or abnormalities over time. For example, an extraordinary increase in traffic at odd hours might signal a security risk. By filtering and aggregating NetFlow data, you can convert raw data into actionable insights, guaranteeing a seamless and safe network.
-
Visualize NetFlow data using graphs and charts: One of the most effective methods to study NetFlow data is to display it using graphs and charts that depict the distribution, variation, and correlation of network traffic parameters. Visualizing NetFlow data allows you to easily spot patterns, trends, and outliers in network traffic, such as spikes, dropouts, or abnormalities. Graphs and charts are used to compare and contrast various traffic patterns or segments, such as incoming versus outbound, LAN vs. WAN, and business vs. non-business. Pie charts, bar charts, line charts, scatter plots, and heat maps are some of the most typical graphs and visualizations used with NetFlow data.
Instead of sorting through raw data, visual tools provide a more complete perspective. Begin by gathering data, and then utilize a NetFlow analyzer to develop graphics. Convert the data into line graphs to follow traffic patterns over time, or pie charts to quickly see how bandwidth is distributed across users. These visual representations make it simpler to identify discrepancies, such as unexpected traffic surges or strange IP addresses wasting bandwidth. By transforming complicated data into visual insights, you can better understand network activity, identify problems, and assure peak performance.
-
Create and configure NetFlow reports: Another method for analyzing NetFlow data is to create and personalize reports that summarize and emphasize the major discoveries and insights from your data. NetFlow reports may assist you in discussing and sharing your network traffic research with other stakeholders, including senior management, network engineers, security experts, and auditors. NetFlow reports are used to track and measure network performance, efficiency, and security over time, including bandwidth use, service level agreements, and incident response. Some popular types of NetFlow reports are traffic summary, traffic breakdown, traffic matrix, traffic prediction, and traffic anomalies.
After gathering data, utilize your NetFlow analyzer to generate precise reports according to your requirements. Rather than taking a one-size-fits-all approach, personalizing allows you to focus on what is most important to your network. You may desire a report that highlights peak traffic hours or identifies the top bandwidth-consuming devices. These personalized reports make it easier to comprehend the facts and make sound decisions. For example, if a single department is routinely utilizing a lot of bandwidth, a bespoke report can help explain why and how. Creating and tailoring NetFlow reports simplifies complicated data, making it usable and relevant to your network's specific needs.
-
Use sophisticated analytics and machine learning on NetFlow data: A more sophisticated method of analyzing NetFlow data is to use advanced analytics and machine learning techniques such as clustering, classification, regression, and anomaly detection. Advanced analytics and machine learning assist you in obtaining deeper and more sophisticated insights from your NetFlow data, such as network traffic patterns, profiles, or behaviors that are not clear or observable through standard analysis. You may employ sophisticated analytics and machine learning to automate and improve network traffic analysis, such as alerting, predicting, and optimizing.
Once you've gathered the data, apply tools that make use of these sophisticated strategies. Machine learning algorithms are trained to detect common patterns in your network. They gradually improve their ability to detect abnormalities or possible hazards without the need for manual involvement. Advanced analytics delves deeper into data, forecasting future traffic patterns and identifying possible bottlenecks. For example, if there is a trend of increasing traffic every Friday, the system may assign additional bandwidth in preparation. Using machine learning and sophisticated analytics automates many monitoring activities while also providing proactive solutions to ensure your network functions smoothly and safely.
-
Integrate NetFlow data with other data sources: A third option to examine NetFlow data is to combine it with other data sources that might offer context, perspective, or value to your network traffic study, such as log data, SNMP data, packet data, and user data. Integrating NetFlow data with other data sources can help you correlate, validate, and improve your network traffic analysis. Integration can be used to capitalize on the strengths and overcome the constraints of various data sources, such as integrating packet data granularity with NetFlow data scalability.
Begin by collecting NetFlow data, which provides a detailed view of traffic flow and bandwidth utilization. Then integrate it with data from other sources, such as security logs, app performance statistics, or user activity logs. These combinations provide a comprehensive overview of your network environment. Integrating NetFlow with security logs assists you in determining if a spike in traffic is due to authorized user activity or a potential security threat. In a similar vein, you may identify if network slowness is due to app problems or traffic congestion by integrating with application analytics. You may improve decision-making and obtain a deeper knowledge of your network by combining NetFlow data with information from other sources.
What Tools and Software Are Commonly Used to Collect and Visualize NetFlow Data?
To view NetFlow data, you must utilize a NetFlow collector program that can analyze and show it as graphs, charts, tables, dashboards, or reports. Examples of NetFlow collector apps are SolarWinds NetFlow Traffic Analyzer, NetFlow Traffic Analyzer 1, SolarWinds Engineer's Toolset, Engineer's ToolsetTM (ETS), and ManageEngine NetFlow Analyzer. These programs can assist you in identifying the most active users, applications, protocols, and destinations on your network.
-
SolarWinds NetFlow Traffic Analyzer: SolarWinds NetFlow Traffic Analyzer (NTA) offers unparalleled network analysis to help you understand what's consuming bandwidth.
NTA functions as a module within the SolarWinds Network Performance Monitor (NPM). It is worth testing both products, known as the Network Bandwidth Analyzer Pack, because they function quite well together.
-
NetFlow Traffic Analyzer 1: NTA operates by integrating traffic data, Cisco Class-Based Quality of Service (CBQoS) data, and performance data from NPM. After that, NTA deconstructs and examines the information, presenting it in interactive graphs that give you a comprehensive picture of your traffic history.
NTA can manage both the original NetFlow software and its modifications and replacements, such as sFlow. My favorite feature of this program is its ability to provide you with the information you need straight out of the box. NTA categorizes traffic consumption into helpful categories such as the top five discussions, top five apps, and top ten sources of utilization. You may sort by source or destination and compare traffic trends across various time periods, both historical and current.
-
SolarWinds Engineer's Toolkit: The SolarWinds Engineer's ToolsetTM (ETS) is a great resource for creating your own unified monitoring environment. ETS provides the greatest solutions available to handle all of your network requirements in one simple package. It provides access to over 60 tools in the most significant categories for IT managers, including NetFlow monitoring, network monitoring, auto discovery, diagnostics, configuration management, log management, IP address monitoring, SNMP, and security.
-
Engineer's ToolsetTM (ETS): Sorting through all of the technology available might be difficult, but as an IT administrator or data manager, you must keep current. The Engineer's Toolset combines everything into a single, unified desktop terminal. From there, you may access five common monitoring tools: Traceroute, CPU Monitor, Response Time Monitor, Memory Monitor, and Interface Monitor.
-
ManageEngine NetFlow Analyzer: ManageEngine The NetFlow Analyzer gives valuable insight into traffic patterns and network bandwidth hogs. It supports alternative technologies such as IPFIX, NetStream, and J-Flow. It analyzes and filters traffic using many of the same indicators as SolarWinds NTA, adding volume and speed, and includes tools for controlling NetFlow in complicated networks. The default dashboard incorporated in the web-based user interface provides interactive graphs, including typical pie charts and heat maps, that indicate the condition of practically anything on your network.
When it comes to reporting, NetFlow Analyzer features a function that allows you to compare network performance statistics across time for many or individual devices. This allows you to get a comprehensive picture of a quarter's worth of traffic statistics, broken down by the minute. Although this may seem overwhelming, the more detailed the information, the better. These analytics allow you to determine peak traffic hours and which devices are causing the most difficulties on your network, making troubleshooting much easier. If you have a big meeting coming up and need to share data with a group of people, you can export NetFlow Analyzer�s findings as a PDF file.
Additionally, the program features dedicated displays for identifying security flaws. The Continuous Stream Mining Engine Technology will follow any abnormalities that evade the firewall on your network and identify internal and external security concerns.
Is There Any Best Practices for Implementing NetFlow in a Network Environment?
In the course of assisting over a dozen different suppliers in implementing a flow export, a pattern of persistent issues surfaced. Best practices for implementing NetFlow are outlined below:
- SNMP Indexes: Ensure that the ingress and egress interfaces exported in flows always match the instances accessible by SNMP. Also, in most circumstances, the egress interface should not be zero. If you read the IANA description (or perhaps RFC 5102), you'll notice. "The value matches the value of the managed object 'ifIndex' as defined in [RFC2863]."
- Active Timeout: The active timeout mentioned before should be set to 60 seconds. This is because most reporting solutions offer granularity at one-minute intervals. In a few situations, providers failed to implement an active timeout, resulting in long-lived flows and unusual spikes in graphs when the data is used to generate trends. An active timeout procedure should be included in the flow export.
- Inactive Timeout: Flows that have not been active for a certain amount of time (e.g., 15 seconds) should be exported from the flow cache.
- OctetDeltaCount: Long-lived flows have to be summed and exported every 60 seconds, or exactly as specified by the active timeout. The bytes for the flow should offer delta values every 60 seconds rather than octetTotalCount from the flow's commencement. Because SNMP and flow technologies are so similar, this is a common error. SNMP requires a reporting tool to compute the delta. With flows, the exporter is anticipated to supply the delta.
- Flow Direction: Flow direction should be implemented since it informs the collector about how the connection For SNMP to compute the delta, a reporting tool is needed. was metered for entry and egress flows. In the case of bidirectional flows, it is advisable to avoid sending the element in the template because it serves no use.
- Numerous Templates: Exporting numerous templates is an excellent technique to increase efficiency while reducing database expansion. The bytes for the flow should provide delta values every 60 seconds rather than octetTotalCount from the flow's start. This is a typical mistake due to the similarities between SNMP and flow technologies. With flows, the exporter is expected to supply the delta.
What Are the Challenges or Limitations of Using NetFlow for Network Analysis?
NetFlow technology allows us to discover network difficulties and bottlenecks, validate traffic class settings (CoS and ToS), identify traffic transmitted, and identify applications, that are associated with a certain user at a given moment. Furthermore, NetFlow, as a technology built into Cisco IOS, requires no extra devices or licenses. NetFlow is accessible on the majority of Cisco systems, beginning with the Cisco ISR routers. However, NetFlow has nothing to provide without the necessary tools to process the data presented. The way in which IT staff collect data influences its relevance and impact on network performance management. When considering the magnitude of accessible information, it is pointless to analyze data in terms of how it flows from each network node separately. To effectively use the NetFlow protocol, we must gather the data in an external database and provide an easy interface that allows us to locate relevant information, network abnormalities, or plan an extension to the network infrastructure. While NetFlow provides useful insights into network traffic patterns and performance, there are several limitations and barriers to its usage.
- Resource Consumption: NetFlow can use a lot of processing power and memory on network devices, especially when monitoring high-speed, high-volume networks. This can have an influence on router and switch performance, thereby degrading the network. Some devices allow you to change the sample rate to save resources, however this may result in inaccurate traffic data.
- Incomplete Traffic Information: Because NetFlow focuses on IP-based traffic, it may not give complete insight into all forms of network traffic, such as Layer 2 (Data Link Layer) traffic or non-IP protocols. This constraint can be overcome by leveraging complementing technologies such as sFlow or SNMP.
- Limited Payload Information: Because NetFlow records do not include packet payload data, it might be difficult to determine the actual content of network traffic or evaluate application-specific characteristics. This might be a hindrance when attempting to detect specific security risks or fix application-level problems.
- Vendor-Specific Implementation: While NetFlow is widely supported by network manufacturers, its implementation may differ between devices, resulting in discrepancies in data collecting and processing. This may be reduced by using a standardized protocol such as IPFIX, which is built on NetFlow v9 and offers a more vendor-neutral approach.
- Scalability: In large-scale networks with a significant volume of traffic, maintaining and storing massive volumes of NetFlow data can be difficult. Effective data aggregation, filtering, and storage solutions are required to keep the data manageable and usable for analysis.
- Analysis and Visualization: Without specific tools and knowledge, interpreting raw NetFlow data can be challenging. Organizations must invest in NetFlow collector and analyzer software to make sense of their data, identify patterns, and provide actionable insights.
Despite these restrictions, NetFlow remains a useful tool for network managers who want to understand their network's traffic patterns and performance. Organizations may use NetFlow to improve and safeguard their network infrastructure by keeping these restrictions in mind and utilizing complementary technologies as needed.
Can NetFlow Data Be Used for Compliance and Reporting Purposes?
Yes, NetFlow data may be utilized to create reports for compliance and auditing. It gives insights into network usage, which aids enterprises in meeting compliance requirements. Cisco created NetFlow, a network protocol that allows for the gathering and analysis of network traffic data. It offers several details about switched traffic, including source and destination IP addresses, ports utilized, data transmitted, connection length, and more. NfDump is a toolbox for collecting and processing Netflow/IPFIX and sflow data received by netflow/sflow compliant devices.
- The toolbox includes flow data collectors such as nfcapd, which supports netflow v1, v5/v7, v9, and IPFIX, and sfcapd, which supports sflow.
- nfpcapd translates pcap data obtained from a host interface or pcap files.
- NfSen is a graphical web-based interface for the nfdump netflow tools.
Real-time network traffic monitoring is commonly used by enterprises to remain on top of network performance and congestion concerns. However, some network challenges require a solution that extends beyond real-time traffic monitoring. A persistent latency in your network might go unnoticed, affecting the overall network's performance. Using NetFlow reporting tools can help you control hazards in your network environment. NetFlow reports can help you keep your network performance reliable. They offer detailed information on your bandwidth usage and traffic. NetFlow reporting tools provide a wide selection of troubleshooting reports that show cumulative traffic patterns for your whole network or a specific device. You may produce NetFlow reports on the who, what, and how of bandwidth consumption for a certain criterion and time period to see how patterns have evolved for that host. The NetFlow tools provide a variety of NetFlow bandwidth reports that provide insight into the past, present, and future of your organization's bandwidth utilization. You may produce reports based on NetFlow, sFlow, JFlow, NetStream, and other metrics to determine which source is consuming the most bandwidth and make smart resource allocation choices.
- Search reports
- Compare reports
- Consolidated reports
- Inventory reports
- Forensic reports
- Capacity planning reports
- Geolocation reports
- Billing reports
- Protocol distribution reports
- LAN-WAN reports
How Does NetFlow Relate to Other Network Monitoring and Analysis Technologies?
The ability to establish a reasonably inexpensive and simple-to-manage network traffic monitoring system with NetFlow is what makes it special; the only expense is the acquisition of an application that allows data visualization.
Furthermore, any network link may be monitored thanks to NetFlow. We may choose to activate NetFlow's monitoring on critical devices, such as the hub, the router supporting the internet link, or locations where network issues arise since the router is programmatically set up for NetFlow.
Additionally, NetFlow is an open protocol, meaning that a variety of third-party applications are accessible to facilitate real-time network monitoring, report generation, and user settlement. Applications are frequently created with specific clients in mind and customized to meet their needs.
It should be clear by now that businesses may use NetFlow to visualize traffic patterns for total network visibility by utilizing flow-based analytic methodologies. In many respects, this greatly simplifies the duties of network administrators. The main advantages of NetFlow in terms of network traffic analysis and monitoring are listed below:
- optimized capacity planning and bandwidth utilization
- increased network visibility
- root cause analytics enabled for application performance lags
- identification and analysis of network security threats