Exploring Nagios Alternatives: Finding the Right Monitoring Tool
Network and IT infrastructure monitoring continue to be crucial for enterprises. A business cannot afford to disregard the network's and IT resources' performance and security.
Nagios is still among the most widely used tools for IT infrastructure monitoring.
Businesses can immediately take control of and gain visibility into their IT infrastructure thanks to a full software stack.
Businesses may defend themselves from internal and external threats and prevent any potential downtimes by keeping an eye on network traffic, server uptime, performance, receiving system logs, etc.
Companies can alter how their networks function and what is tracked. To keep organizations safe, fortunately, the software offers both passive and active monitoring solutions.
Although Nagios is a great solution, professionals wishing to explore more market possibilities can also take into account the following Nagios alternatives:
- Paessler PRTG
- Site24x7
- SolarWinds Network Performance Monitor
- Zabbix
- Icinga
- Prometheus
- Check_MK
- Observium
- LibreNMS
- OpenNMS
- Cacti
- OP5 Monitor
In this article, we will discuss the following topics related to Nagios and its alternatives.
- What is the Nagios Network Monitoring Tool?
- How Does Nagois Work?
- What are the Benefits of Nagios?
- Why Consider Alternatives to Nagios?
- What factors should be considered when evaluating monitoring alternatives?
- What are some notable Open Source and Paid alternatives to Nagios?
- What steps are involved in migrating from Nagios to an alternative?
What is the Nagios Network Monitoring Tool?
Nagios is an open-source tool created by Ethan Galstad for monitoring IT systems. Nagios can monitor devices using Linux, Windows, and Unix OSes and was created to run on the Linux operating system.
The Nagios software performs routine checks on important application, network, and server resource metrics. Nagios, for instance, tracks log files, memory usage, disk usage, and CPU load. It keeps track of how many processes are active at any given time. The Simple Mail Transfer Protocol (SMTP), Post Office Protocol 3, the Hypertext Transfer Protocol (HTTP), and other widely used network protocols are among the services that Nagios can monitor. Active checks are started by Nagios, while passive checks come from connected external programs.
Ethan Galstad created Nagios, an open-source project that was first made available in 1999 under the name NetSaint. Many people later improved it. Using the Nagios Core technology as its foundation, Nagios Enterprises provides a variety of products, including Nagios XI, Log Server, Network Analyzer, and Fusion.
How Does Nagios Work?
Nagios basically gathers your server's statistics (either using an agent like NRPE, check mk, or SNMP) and notifies you when one of the metrics rises above a certain threshold. Nagios executes a plugin that is installed on the remote client to verify the status of a remote service after every interval. In the description that follows, we'll go through a few of the monitoring methods Nagios employs:
- Nagios Remote Plugin Executor (NRPE): This package is installed by Nagios on each remote computer that has to be watched, and it communicates using TCP port 5666. The necessary commands must be defined in a configuration file that is stored in the NRPE. As a result, whenever the NRPE daemon receives a query from the Nagios server, it searches the configuration file for the required command and executes it.
- Monitoring using SNMP: The key benefit of adopting SNMP is the vast range of devices that accept it, including routers, switches, and UPS units. By simply running an SNMP daemon on the remote host, you can use SNMP to monitor the network, OS, and hardware. This is possible because SNMP can retrieve values for many attributes from network devices and other SNMP-aware devices.
- NSCA - Nagios Service Check Acceptor: The client will periodically run a necessary plugin on his end and report the results to the Nagios server. Because the client executes plugins on a regular basis and reports its findings to NSCA on the Nagios server, this sort of monitoring is known as passive monitoring. The Nagios server is not in charge of initiating checks for this type of monitoring.
What are the Benefits of Nagios?
The primary advantages of Nagios are as follows:
- Monitor: DevOps can configure Nagios to monitor network protocols, system measurements, and IT infrastructure components.
- Alert: Whenever a crucial infrastructure component fails, Nagios will send out an alarm.
- Response: DevOps responds by acknowledging alerts and implementing fixes.
- Report: Nagios can periodically publish and deliver reports on outages, events, SLAs, and other topics.
- Maintenance: We can turn off alerts during maintenance windows.
- Planning: Nagios aids in infrastructure planning and upgrades by using historical data.
Why Consider Alternatives to Nagios?
When it was introduced in 1999 under the name NetSaint, Nagios was the first open-source utility to consolidate a large number of essential monitoring mechanisms for complex IT infrastructures. It relied on hosts and services, plug-ins for monitoring, and close collaboration with the open-source community. This approach set new standards at the time, but much has changed since then. It is becoming obvious that Nagios is no longer suitable for monitoring such advanced IT innovations.
Modern enterprise networks and systems are too complex for Nagios to monitor with an acceptable level of effort. Working with Nagios configuration files has always been cumbersome, but it is now too far from the norm. Other tools rely on automation and configuration concepts that can manage even a large number of hosts with relative ease. They also feature user-friendly graphical interfaces, whereas in the case of Nagios, operating on the Linux console is frequently required. The management of plug-ins and add-ons in Nagios is also not up to date: Nagios updates, documentation, and customization necessitate excessive manual fine-tuning.
As networks have grown larger and more complex, and as IT teams have been tasked with monitoring an increasing number of systems, the use of Nagios places monitoring administrators under extreme time constraints. This poses a threat to businesses and IT professionals. There is a risk that IT issues will be neglected, that there will be insufficient data on which to base decisions, and that costly human resources will be allocated.
Some organizations anticipated that investing in commercial versions of Nagios would improve the performance of their IT teams and monitoring, but the drawbacks of the outmoded code base remain evident: The burden is relatively high, the graphical interface is obsolete, and the architecture heavily relies on active tests, limiting scalability. With Nagios, monitoring large environments with minimal effort is simply not feasible.
Prior to the introduction of Nagios, it was typical for IT administrators to specialize in a small number of applications. However, over the past two decades, the complexity of IT in businesses has consistently increased, while staffing levels in IT departments have not kept pace. The requirements for IT professionals have increased. No longer is the time required to learn and operate Nagios available. Other tools respond more effectively to the requirements of their users, for instance, by being simpler to employ and relieving users through targeted automation.
The basic Nagios framework has a lot of limitations, some of which can be fixed by add-ons from third parties and some of which cannot. There is a poorly designed GUI, a dearth of database and performance records, difficulty with configuration, and a lack of automatic device discovery, among other issues of Nagios.
While a third-party add-on may be able to resolve these problems in some circumstances, there are many advantages to a complete, unified monitoring solution that can give superior results without them. Keeping Nagios up to date and working in a dynamic environment can feel like a nightmare with all the Nagios plugins and add-ons available.
However, some drawbacks, such as Nagios' inability to differentiate between different device types like servers, switches, and routers, cannot be fixed by add-ons. Some administrators and developers choose to use Windows Server over the Linux/Unix commands related to Nagios.
Network administrators searching for an upgrade might wish to think about a Nagios replacement as software development progresses and solutions become easier to use.
What factors should be considered when evaluating monitoring alternatives?
A thorough analysis of your network monitoring requirements is necessary before selecting the finest open-source network monitoring software for your company. You should take into account elements like security, community involvement, vendor support, and ease of use. Determining whether or not to purchase a premium product with extra services and support is another important decision.
Be sure that the software complies with your company's specifications and can manage the volume, protocols, and unique requirements of your network. A thriving open-source community can offer helpful tools, plugins, and updates to keep the software up to date.
With capabilities like packet capture and analysis, network polling, data visualization, alarms, logging, and reporting of security events, the best network monitoring tools assist network administrators in managing their resources.
- Taking packets and studying data: In the absence of network data, network monitoring is not possible. While data analysis actually makes sense of the data, packet capture is the function that gathers data from various networking components. With the use of these technologies, IT specialists may examine data packets as they traverse a network, analyzing the information to look for potential problems. Users can diagnose problems, identify network congestion, and discover security concerns by examining packet data.
- Community polling: Consider network polling functions to be pulse checks. They frequently transmit polls, which may be signals or tests, to check the functionality of various networking devices. Network polling entails periodically asking network devices about their availability, performance, and status. Performance metrics and alarms are then generated using this data for network engineers and administrators.
- Alerting mechanism: One of the most important features of network monitoring software is real-time, automated warnings. Network administrators can be notified through alerts whenever a new issue, update, or other modification to the network has been found, either directly within the tool or through a third-party messaging service. Events like network outages, device malfunctions, or unusual traffic patterns may result in these notifications.
- Visualization of data and graphs: Not every network stakeholder is an expert in networking. All users can comprehend the most crucial networking metrics thanks to data visualization and graphs. It shows data in a simple and succinct manner, facilitating the identification of trends, patterns, and problems by network administrators and engineers. Heat maps, graphs, and charts can all be used in these visualizations.
- Data archiving and event logging: Network monitoring frequently uses past data to enhance troubleshooting efforts in addition to current problems or changes. Because network teams must examine both past and present performance at once, event logging and data storage are crucial.
- Reporting: Network administrators frequently have to communicate changes outside of the networking team after a problem or upgrade has been fixed on the network. The majority of network monitoring solutions allow you to share data from custom reports with other applications, and some products even include native reporting features. These reports can offer insightful information on network activities, including patterns of traffic, the functionality of devices, and security risks.
What are Open Source and Paid Alternatives to Nagios?
Although Nagios is a great solution, professionals wishing to explore more market possibilities can take into account the following Nagios alternatives. Since many of the software options listed here are open-source and free Nagios alternatives, you'll also save money using them:
- Paessler PRTG
- Site24x7
- SolarWinds Network Performance Monitor
- Zabbix
- Icinga
- Prometheus:
- Check_MK
- Observium
- LibreNMS
- OpenNMS
- Cacti
- OP5 Monitor
Paessler PRTG
PRTG Network Monitor is made to help companies succeed online. This monitoring program keeps track of all the data that is relevant to network performance overall.
Uptime, network consumption, information about specific machines, cloud computing services, database monitoring, network mapping, and many other metrics are now being monitored.
PRTG monitors both specific machines and the entire network. This gives a precise view of network performance and quickly spots any possible problems.
Anyone with an IT background will adore the product thanks to its user-friendly dashboard.
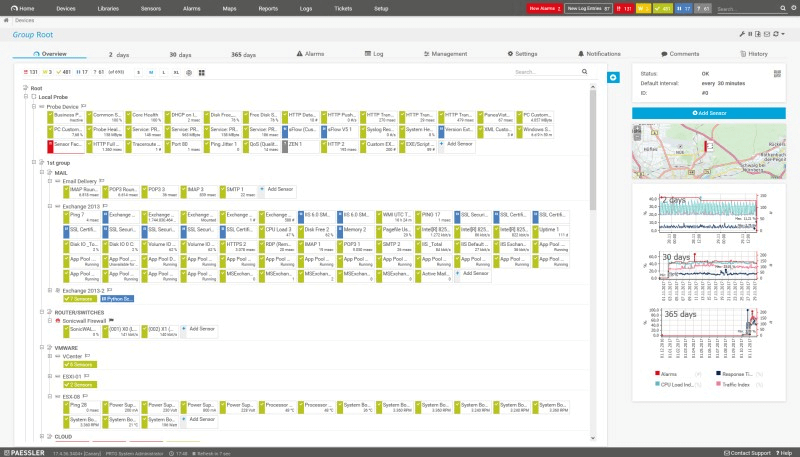
Figure 1. PRTG Dasboard
The onboarding procedure will be very easy for businesses of all sizes to complete. Because of this, PRTG is still a great choice for the majority of organizations, regardless of sector.
This tool's straightforward licensing model and the fact that everything is included after you install the software are both features I find appealing.
A free version with up to 100 sensors is available. If you download the 30-day free trial version with full functionality, it will revert to the free version when the trial has ended.
Pricing for larger networks ranges from $1600 (for 500 sensors) to thousands of dollars (for unrestricted sensors) (prices are for perpetual licenses)
Site24x7
Site24x7, a monitoring tool located in the cloud, can keep an eye on infrastructure elements like servers, networks, containers, and virtualization platforms. Whether the server is hosted on-premises or in the cloud, an agent must be installed on it. Site 24x7 is able to gather all pertinent metrics from Linux and Windows servers and provide the data in a single console. This contains crucial Linux server performance indicators like load average and thread and handle count of processes, as well as CPU, memory, and disk utilization, services, and process health for Windows.
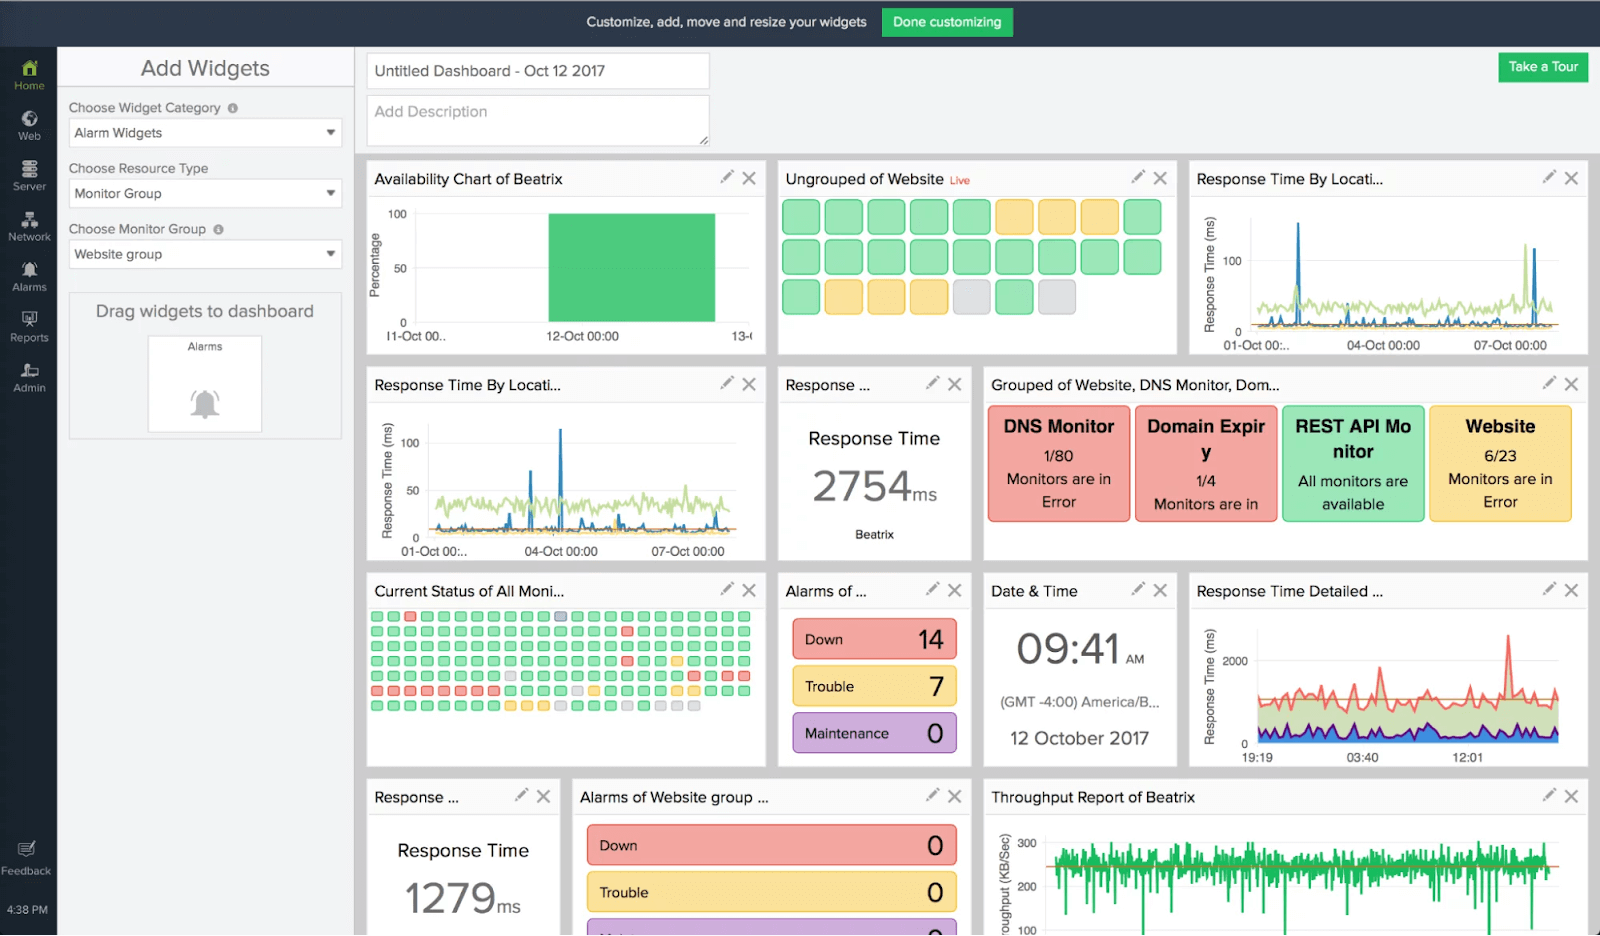
Figure 2. Site24x7 Dasboard
In order to provide you with real-time insights on infrastructure health, the data gathered by the agent is shown in dashboards with views covering network information, application activity, and server metrics. Site24x7 can be used to keep tabs on the performance of Kubernetes clusters and Docker hosts. In addition to the tool's built-in monitoring features, you may create your own using Shell, PowerShell, Batch, VB, Python, and other programming languages.
A free 30-day trial is available from Site 24/7. Prices for infrastructure monitoring start at $8 per month for up to 10 servers, with the opportunity to add on more monitoring.
SolarWinds Network Performance Monitor
Solarwinds is a company that offers dozens of software programs for a variety of IT services, including monitoring. The functionalities that customers need today are included in the SolarWinds Network Performance Monitor (NPM) product. Clients that purchase this software bundle get comprehensive network troubleshooting tools as well as support for multi-vendor network monitoring.
In contrast to other tools, this one focuses more on monitoring network infrastructure (such as routers, switches, firewalls, load balancers, connection links, etc.) than entire networks and IT systems (like the previous vendors).
A complete image of a specific network is provided via intelligent maps and comprehensive network insights. To prevent confusion, all of this information is presented in a clear and well-designed way.
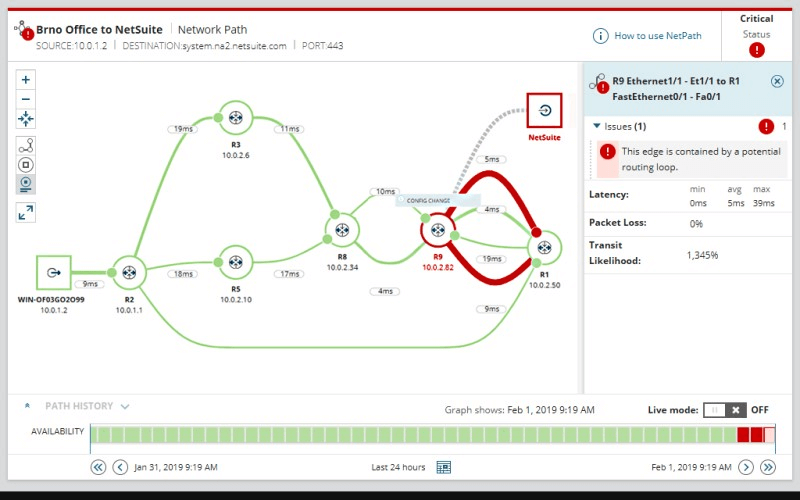
Figure 3. Solarwinds NPM Dasboard
Advanced alerts make an effort to only send out notifications when absolutely essential. Clients receive too many alerts from too many network performance monitors. In order to prevent this, SolarWinds developed a platform that, by default, only sends out vital alerts, greatly reducing the amount of noise.
More alerts are available for customers to activate and tailor to their needs. Nonetheless, the creators of this software strive to give users a seamless experience.
The term "NetPath" refers to one of this solution's outstanding characteristics. This function provides visual network path analysis (hop by hop), which is very helpful in locating issues, broken links, potential down servers, etc.
The NPM product currently has a starting price of $2,955, though you must contact Solarwinds for more information on pricing.
Zabbix
Zabbix has been in use for over two decades and has over 300,000 installations worldwide. Clients are given free access to Zabbix, an open-source project. Via Zabbix, network monitoring is advanced in a number of ways.
The program keeps track of everything, including virtual computers, databases, servers, and networks. Also included is complete cloud network monitoring, which is unusual for a free program.
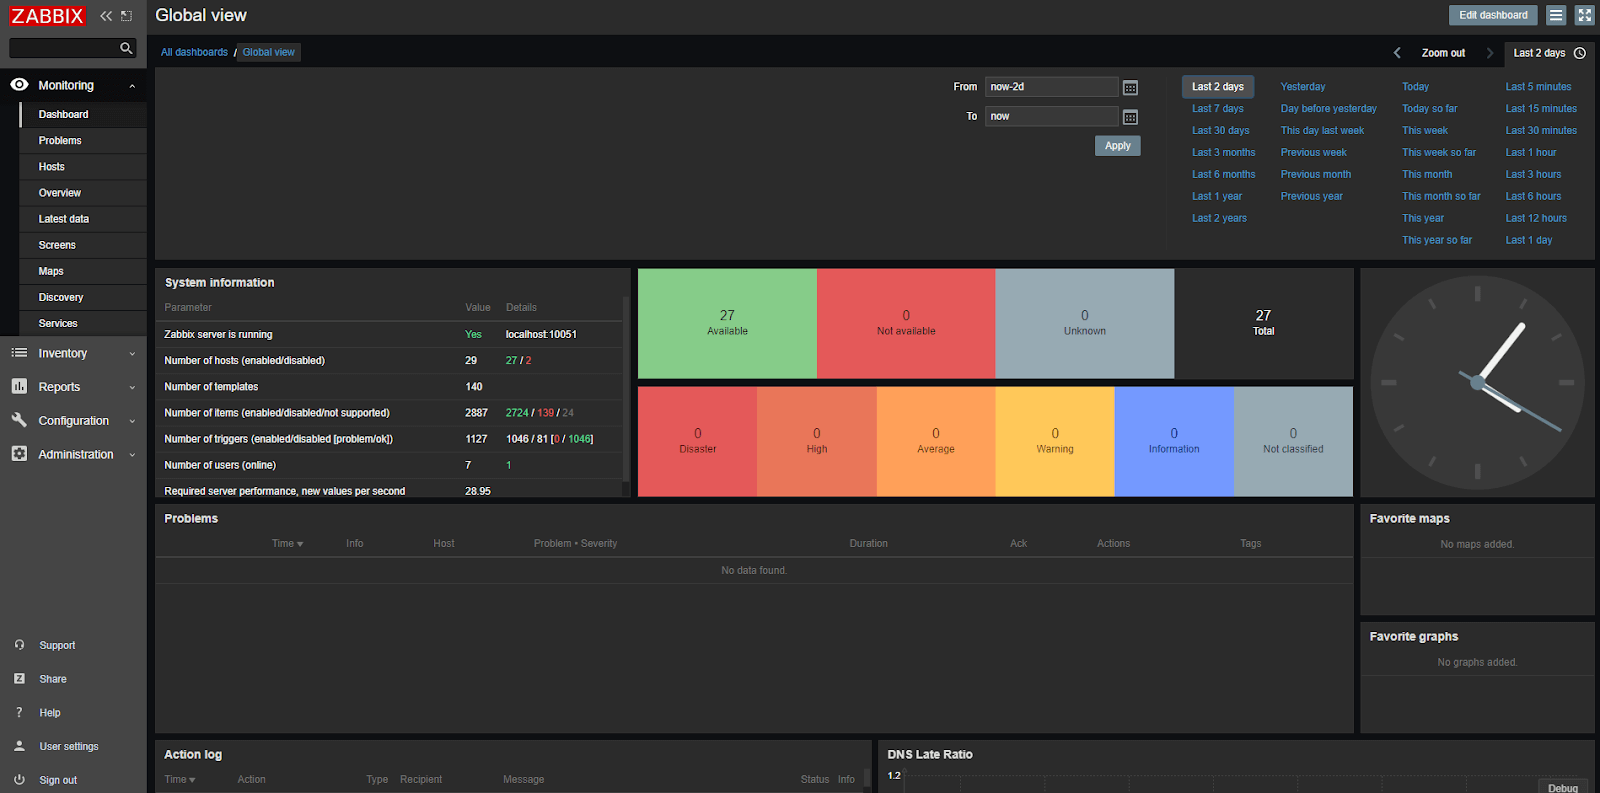
Figure 4. Zabbix Dasboard
Only Linux can run the program, and it also needs Apache, MySQL, and PHP. Several administrators found it to be relatively challenging to handle and configure, and it needed manual configuration to get up and running.
But, you can download an appliance that has already been set up and is ready to use (as a virtual machine to run on VMware, VirtualBox, etc.).
FREE. Yep, this amazing remedy is totally free (open source).
Icinga
Icinga2 is yet another well-known free and open-source monitoring program. Icinga2 began as a Nagios clone and developed into a comprehensive network monitoring system, even for enterprise-level requirements. It needs customization and fine-tuning, like the majority of open-source programs, but it's incredibly adaptable and strong.
Because it is plugin-based, you may use pre-made plugins to monitor any host, program, or network device you can think of.
You can create your own monitoring script using a variety of languages, such as Python, PowerShell, VBS, etc. if a plugin is not yet available for a certain end-point.
It needs to be installed on a Linux operating system, and you must first install the core monitoring program before installing the web module, which provides GUI management of the utility. From that point on, there are numerous granularities available for achieving end-point monitoring.
For fine-grained network monitoring, the program can operate in a distributed environment that identifies masters, satellites, and agents. Because of this, IT specialists are able to easily recognize particular network components. With a thorough alert system in place, a complete ledger of analytics is offered.
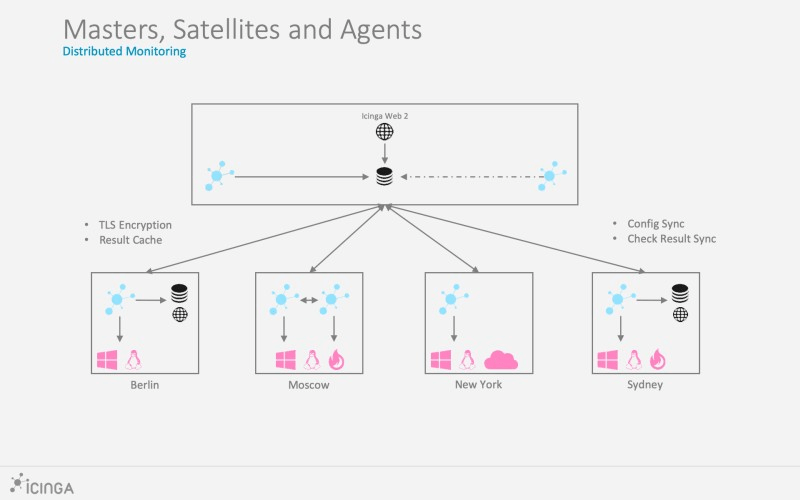
Figure 5. Icinga2
Icinga2 is a fantastic software suite that provides control back to network managers.
Prometheus
Based on Google's Borgmon, a time-series database and query tool that is still used internally by Google teams, Prometheus is an open-source network monitoring solution. For containerized networks that require more visibility throughout their infrastructure, Prometheus is the best open-source choice thanks to its time-series methodology and focus on a variety of data storage options.
On GitHub, Prometheus is accessible under the Apache 2 License. It is a suitable option for cloud or hybrid networking setups because it is a Cloud Native Computing Foundation graduating project.
Features of Prometheus are as follows:
- For queries that transform time-series data into different types of graphs, PromQL is available.
- Data visualization using a console template language, an integrated expression browser, or Grafana.
- Federation and functional sharding for scaled storage requirements.
- For notifications and silence, use an alert manager.
- Client libraries for service instrumentation
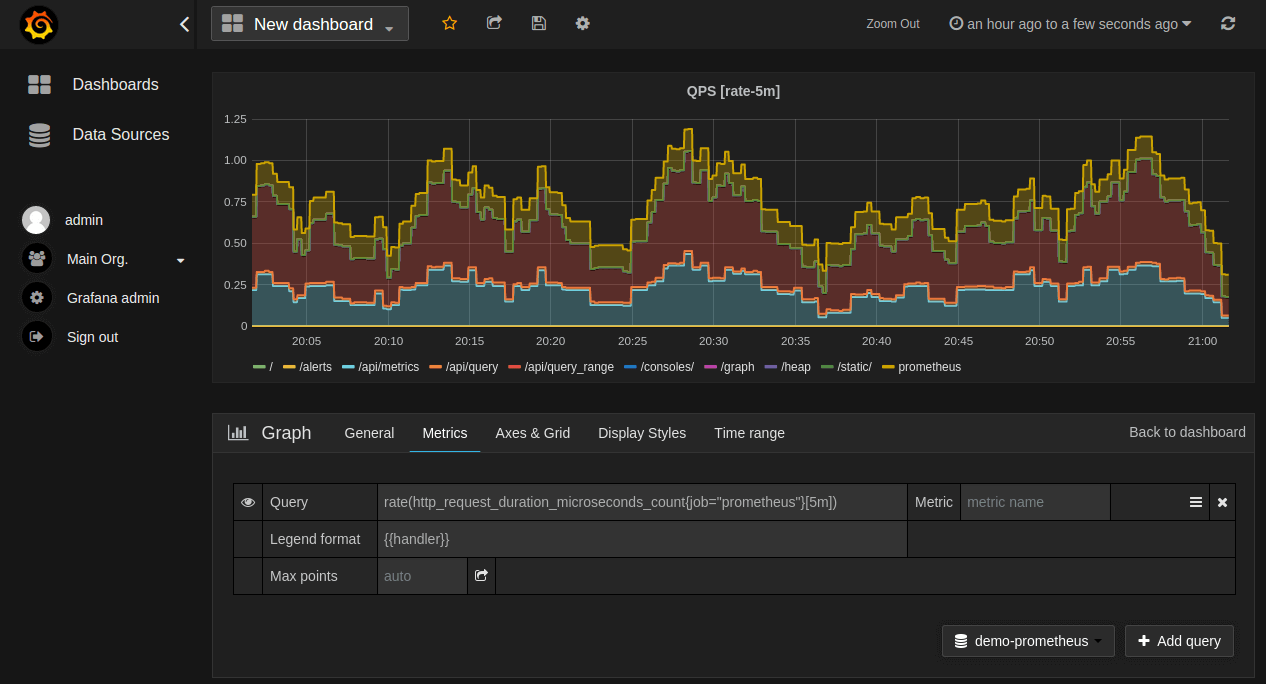
Figure 6. Prometheus
Check_MK
A different free and open-source program that also offers a business-oriented variant with more functionality and technical assistance is available. Checkmk provides both state-based and log-based monitoring. System administrators receive numerous levels of warnings from the monitoring software. About 1,700 intelligent plugins keep track of all activity on the network at any given time.
Checkmk can currently monitor both software and hardware performance. Analytics for business intelligence give clients the metrics they want.
Checkmk monitors a variety of devices, including servers, network devices, applications, etc., in contrast to Solarwinds NPM, which is solely focused on networking.
In order to detect faults and set off alarms, it gathers logs (using syslog, SNMP traps, etc.).
Pricing options of Checkmk are listed below:
- Version Raw: Totally free
- Enterprise For up to 10 hosts, the free edition is free.
- Enterprise Basic Edition: Priced at Euro 600 and above
- Managed Services for Businesses: From Euro 1200
Observium
Observium is another choice that provides both free and paid editions. Observium requires Apache and MySQL and runs on Linux.
Observium is a fantastic substitute for Nagios. Although it supports auto-discovery using several techniques, including CDP, LLDP, and FDP, it mostly uses the SNMP protocol. Observium can handle any device that can send warnings and statistics via SNMP. Both network hardware and IT systems (servers, computers, etc.) are included in this.
Moreover, agents that you install on the target system to relay data about resources, statistics, etc. can be used to perform some monitoring.
Three editions of the software are currently offered to accommodate the demands of every user. Companies can satisfy their requirements for network monitoring with a low-maintenance solution.
Because most of Observium's capabilities are automated, many firms favor it. The software can be installed by users, and administrators have quick access to the environment.
Observium Professional and Business cost Euro 230.00 or Euro 1,200.00 per year, respectively. Observium Community is free.
LibreNMS
Using a variety of protocols, including CDP, FDP, LLDP, OSPF, BGP, SNMP, and ARP, LibreNMS automatically detects specific devices and end-points throughout the setup process. Users don't have to spend hours adding each device they want to monitor. Customized alerts make sure administrators are always aware of what is happening after that.
Installing the utility on Linux computers running Apache and PHP is free. An easy-to-use online interface is accessible to manage the solution, manually add new devices if desired, receive alarms, etc.
LibreNMS offers a variety of approaches, including SNMP, syslog, using agents, etc., to monitor applications, network devices, IT systems, Linux machines, etc.
The real-time graphs of network bandwidth per port, up/down interface statistics, CPU use graphs, and many other things were very beneficial to a lot of people.
For network managers who are on the go, there are now iPhone and Android apps available.
LibreNMS is Free.
OpenNMS
Since its inception in 2000, OpenNMS has been under development. One of the only complete open-source network monitoring suites on the market right now is OpenNMS. Thankfully, OpenNMS offers a more complete solution than most other systems.
The project's creators provide experts with the tools and capabilities necessary to conduct comprehensive network and system monitoring.
Everything from in-depth network monitoring to advising and training services is included in this.
Although free and open source, the system has been successfully used by numerous users to support and monitor large enterprise networks. This tool's instance can monitor an infinite number of devices.
When a network monitoring solution has 20 years of development and is open source, it is difficult to argue against it. In actuality, many network monitoring systems are quite new.
OpenNMS is Free. If you require installation and support services, the provider charges for these.
Cacti
Cacti is a web-based networking monitoring platform and graphing solution based on RRDTool that produces precise network measurements for your company. Unlimited graph elements, graph data manipulation, adaptable data collection scripts, SNMP support, and auto-padding for graphs are among the features.
The front end may accommodate several users and allow for their individual graph setups. Because it enables them to show bandwidth statistics to their clients, it is the perfect option for web hosting companies.
It could be challenging for you to learn Cacti if you're new to network monitoring. But, as Cacti is an open-source solution, you are free to test it out with your network devices.
A free version of Cacti is available.
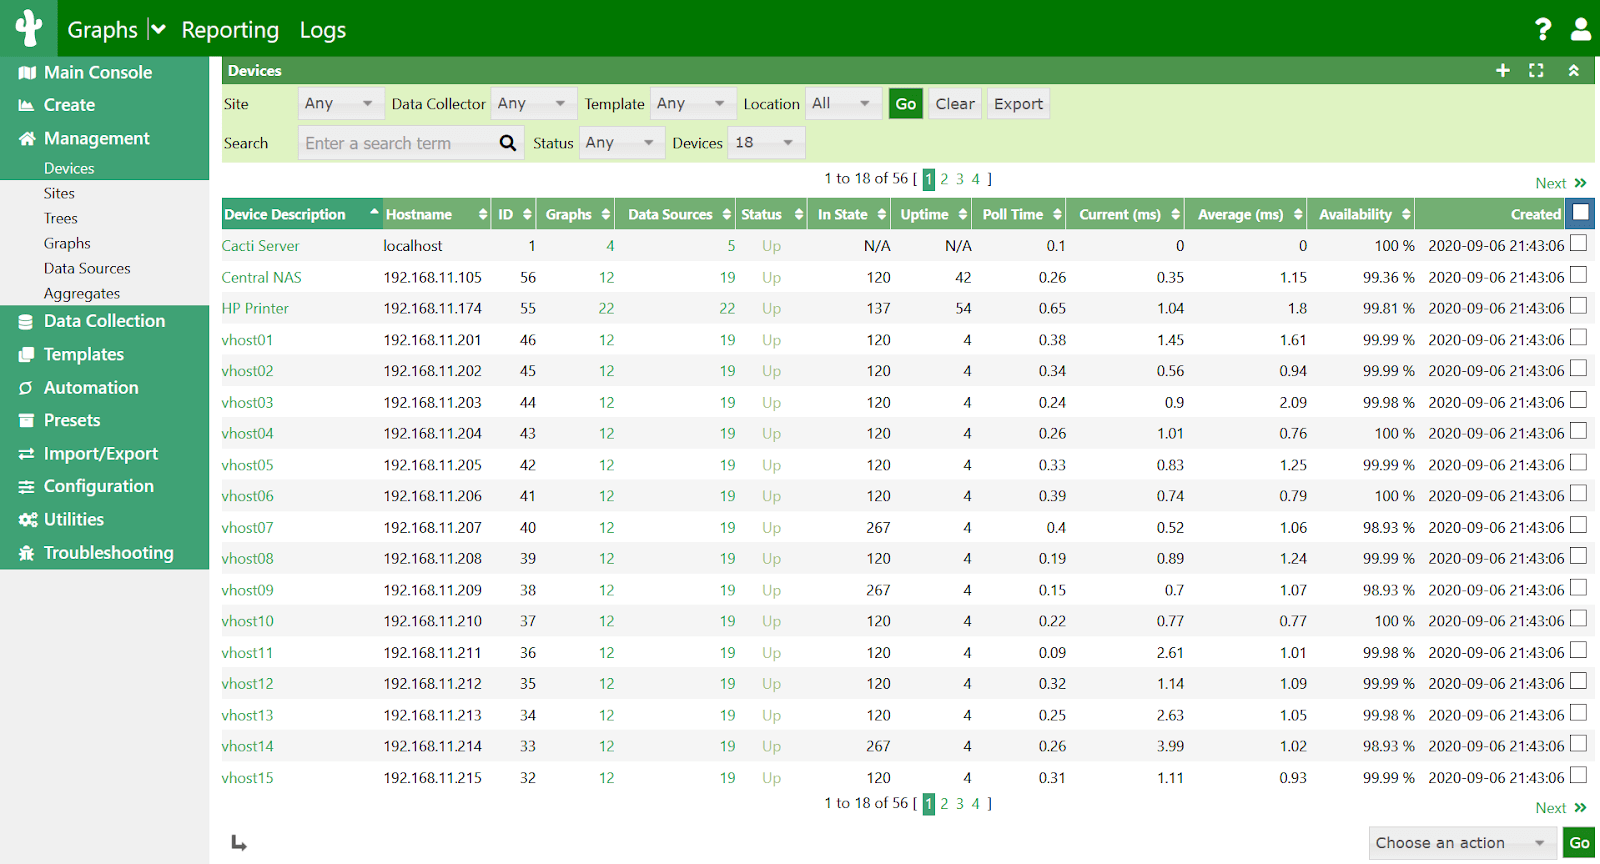
Figure 7. Cacti
OP5 Monitor
Both a free open-source edition and an enterprise version are available through OP5. The free version has several restrictions, therefore, you will need to purchase the Enterprise license if you require more robust and advanced features.
Although it is more adaptable and user-friendly, this program is built on the Nagios code. It provides monitoring services for technical administrators as well as sales and customer support staff.
Businesses may now manage a fully integrated solution that meets all of their IT infrastructure demands, thanks to OP5.
This network monitoring package includes a variety of strong services and features. Real-time network traffic monitoring and extensive performance data collection are conducted.
Businesses that use this software will always be aware of what's happening with their networks. Every measure that is tracked offers useful data to enterprise users.
Its flexibility and ease of use may still be OP5's key advantages. It takes some time to onboard new devices. From there, it is easy and painless to add a new device to the monitoring suite.
Users won't experience problems with small or large networks because OP5 is scalable for enterprises of all sizes. Not all network monitoring software offers a setup procedure that is as quick and flexible as this.
OP5 offers a 30-day free trial period. The number of monitored devices will then be capped at 20 after that. For pricing information on the Enterprise licensing version, you must contact them.