Mastering Network Monitoring: A Comprehensive Guide to Open-Source and Commercial Tools
Every linked organization should be doing network monitoring. You can control your devices and make sure they're available when you need them thanks to thorough network monitoring tools. It should come as no surprise that there are a huge variety of tools that fall under the category of "network management tools", given the diversity of factors that go into network administration. An example of a network tool that taps the network to let you watch data as it travels is a LAN analyzer or packet sniffer. But, these tools won't monitor every part of your job as a network manager.
Choosing the best network monitoring software and tools for your environment and budget can be difficult, though, because there is such a wide variety available. We compare the top network monitoring tools in this article, and you will find detailed information about the following topics related to network monitoring:
- What is the Importance of Network Monitoring?
- What are the popular Open-Source Network Monitoring Tools?
- Nagios
- Zabbix
- Icinga
- Pandora FMS
- Cacti
- Zenoss
- What are the popular Paid (Commercial) Network Monitoring Tools?
- SolarWinds Network Performance Monitor (NPM)
- PRTG Network Monitor
- WhatsUp Gold
- Datadog
- LogicMonitor
- ManageEngine OpManager
- What are the factors to consider when choosing a Network Monitoring Tool?
What is the Importance of Network Monitoring?
Network Monitoring, as the core of network management systems, assists in real-time monitoring of firewall, router, switch, server, and virtual machine device performance. The system enables you to manage different types of data, such as server traffic, CPU values, and storage and contacts the network administrator in the event of an interruption or any other problem.
Network Monitoring stands out as a proactive approach, identifying performance-related issues and structural bottlenecks promptly to stop the problem from getting worse. You may simply stop network losses and serious internet issues with the aid of an efficient network monitoring technique.
Monitoring the capabilities of hardware and software components linked to a network is one of the biggest issues that network managers encounter. The only effective method to monitor this is via a sophisticated network monitoring solution. You may set up several control points using network monitoring solutions to find possible issues before they arise on servers and machine records.
You need to simultaneously track every component on your system in order to build a durable and useful network. The network monitoring procedure allows for the detection of potential mistakes and occurrences that may result in errors.
What are the Popular Open-Source Network Monitoring Tools?
Below, you'll find information about the best open-source network monitoring tools:
- Nagios
- Zabbix
- Icinga
- Pandora FMS
- Cacti
- Zenoss
1. Nagios
A collection of free, open-source software called Nagios is available for network, infrastructure, and application monitoring. Although open source, the only free version of the platform is Nagios Core. Enterprise-level capabilities, support, and more pre-made dashboards and alarms are offered by products like Nagios XI.
Key Features of Nagios are listed below:
-
Use of Nagios Core is free.
-
With plug-ins, extensible
-
The top open-source network observer
A well-known free open-source system monitoring tool is Nagios Core. The utility can find any device linked to a network and offers network device monitoring. With the help of this feature, Nagios tool creates an inventory of the network, from which a topology map may be made.
This concept is particularly attractive since it enables businesses to test the free version and upgrade as necessary. Moreover, it provides businesses the freedom to use and abandon the paid model as they see fit. All essential monitoring functionalities are included in Nagios Core, which has a primary online interface.
A plugin package makes additional functionality like graphing and reporting accessible. The entire set of 50 core plugins may be downloaded at once. Users may utilize the Nagios Exchange to find community-created add-ins for further integrations and features. While Nagios Core is a wonderful place to start, solutions like Nagios Fusion add capabilities that make ticket resolution faster and showcase community insights features; Nagios has over 250,000 users and one of the largest open-source communities in the world.
The Nagios site offers premium help alternatives and an active support forum. Although the paid assistance choices are somewhat pricey, they are probably less expensive than what it would cost to engage a consultant if things went south. Be sure you've exhausted all of your free help resources before purchasing a "5 call pack" of phone support, which now starts at $1995.

Figure 1. Nagios UI
Nagios does provide what are referred to as "Nagios Quickstarts" for novice users. These are brief, no-cost support sessions created to assist new or prospective users with customizing installations and resolving any difficulties they may be having. This strategy should be used by more businesses since it facilitates the onboarding of new users and probably improves Nagios' customer retention.
For those who can afford it and use open-source networking monitoring tools, Nagios provides some fantastic free tools that save a ton of time. On the other hand, Nagios Core provides a strong platform for the development of robust networking monitoring functionality. Nagios does, however, often take a lot of effort to understand, much like other open-source systems.
The ability to be expanded by free plug-ins found in Nagios Exchange is one of Nagios' greatest strengths. One issue with this system is that there are no plug-ins for traffic analysis and the free tool lacks any such features. Windows, Docker, or VMWare are all supported by the program.
Pros of Nagios are listed below:
- Many support options are available, including complimentary onboarding help
- Alerts and insights operate in almost real-time and are extremely quick.
- It can monitor almost anything and makes use of SNMP standards.
Cons of Nagios are given below:
- For analytics and reporting, you would want to see updated native visuals.
- Interface requires improvement, particularly when preparing reports
- More native support for features would be nice; a lot of essential functions are listed as plugins.
- It may be excessively configurable.
2. Zabbix
A robust and well-liked open-source networking monitoring tool is Zabbix. In order to deliver insights into various networks, apps, hosts, and cloud-based services, it employs simple agents to collect SNMP and IPMI data. The platform makes use of a basic auto-discovery tool to find new devices and modifications to assets that are already being watched.
Key Features of Zabbix are listed below:
- SNMP-based surveillance
- automated detection
- templates for integrating products
- user community assistance
- cloud tracking Zabbix is a free system monitor that can keep an eye on servers, networks, and software. This application offers automated network monitoring with notifications for performance drops and resource shortages and includes a sophisticated user interface. Device monitoring and traffic analysis are provided via the network monitoring module. This package contains network inventory generation, device detection, and map construction.
To mention a few, there are many preconfigured templates available that support the products of well-known vendors like Cisco, Dell, Intel, and Netgear. You can look for help in the Zabbix community for integrations that are more difficult to implement. With a Facebook group and a Telegram chat supported in more than nine different languages, the community is robust. The Zabbix support system functions as a real-time bug tracker. This approach aids in alerting the creators of crucial security flaws, guaranteeing the product is continually reliable.

Figure 2. Zabbix Dashboard
Although the default interface is rather attractive, you may personalize how your environment appears by using widget-based apps. There are several choices for warnings, escalation, and remediation that help to clearly define what must be done to fix a problem. Moreover, Zabbix makes use of event correlation to assist in pointing personnel in the proper direction while making manual repairs. Remediation may be script-automated or set up to generate a helpdesk ticket through ITSM integration. All sizes of organizations can use Zabbix, although smaller ones will find it more useful. Cloud platform performance may be monitored by the server monitoring system, and network monitoring can reach such platforms over the Internet. The software is incredibly simple to use and automatically configures itself. Pros of Zabbix are as follows:
- a transparent, open-source tool
- use ICMP and SNMP for a wider breadth of monitoring
- instantly recognizes new devices and configuration alterations and provides helpful templates for rapid insights
- a robust notification system that supports webhooks, SMS, email, and custom scripts
The main cons of Zabbix is that it will take a lot of time to become proficient with the platform. Overall, the open-source networking monitoring solutions offered by Zabbix are highly versatile, and the platform is backed by a sizable, committed community that has been steadily enhancing it over time.
Two well-known open-source network monitoring applications, Nagios and Zabbix, are capable of monitoring the status and operation of OPNsense devices. Their function is to oversee the security of OPNsense networks. Additionally, they are applicable to network payload monitoring. By monitoring the security of OPNsense networks with Nagios or Zabbix, administrators can detect and rectify potential security issues prior to a breach.
3. Icinga
An open-source platform called Icinga provides a number of tools, including a network monitoring program. Organizations may have total insight into their infrastructure, network, and analytics through the Icinga stack thanks to the products' seamless integration.
Key Features of Icinga are given below:
- networks, servers, and applications monitoring
- compatible with Nagios plug-ins
- support from the public
- cloud monitoring
Icinga, the fork of Nagios Core, offers greater network monitoring tools since the Nagios developers moved its traffic analysis features off into a separate, for-pay program. This tool may be expanded with Nagios plug-ins and is entirely free to use. The platform is still being updated, and it has started to support many types of agentless monitoring systems. Icinga has established itself as a dependable open-source network monitoring tool, and major companies like Adobe, T-Mobile, and Siemens have all adopted it. The platform provides network monitoring services for containerized applications, cloud-based services, and on-premises infrastructure. Although the infrastructure monitoring capabilities and the cloud monitoring modules are different, they may both be accessible from the same platform. The tool is excellent at introducing you to its ecology. Icinga makes it simple to start small and work your way up to more complex monitoring integrations, whereas many solutions aim to overwhelm you with possibilities. The platform offers monitoring across hundreds of vendors, including HP, and Cisco, and there are several templates and support for vendor connectors. Icinga strives to give total infrastructure visibility throughout the network, whereas other systems are intensely focused on a specific aspect of monitoring, making it simpler to locate the problem's origin. The alert system is well-designed, and although it may be customized, it does provide an excellent place for anyone to gain immediate, actionable insights. Strong community support for Icinga is available via a variety of platforms, including GitHub, web forums, Meetup, and even live events. Incinga features a page for platform users who contribute frequently. Icinga is an effective open-source networking monitoring application that is dependable enough to be utilized in an enterprise setting while still being affordable for smaller organizations.

Figure 3. Icinga UI
In comparison to Nagios, the Icinga system provides a superior user interface. The program offers complete network, server, and application monitoring and may be used with Linux or Windows. Moreover, it may provide monitoring services for cloud resources. Small and medium-sized enterprises can use this bundle.
Pros of Icinga are listed below:
- excellent documentation and API
- for administrators who like CLI tools, it is a suitable option because it can be customized using a GUI or DSL.
- enables integrated graphic reporting
- modules to provide various functionalities while keeping the base system safe and light.
- may be used with both Linux and Windows operating systems.
Cons of Icinga are given below:
- more difficult to master than other tools
- it might be difficult to execute without technical experience, as it is designed for more skilled users.
4. Pandora FMS
More than 10,000 nodes may be monitored by Pandora FMS in its free edition, which includes (without restriction) network, server (agent-based or remote), and application monitoring. complete functionality for reporting, third-party integrations through API, and so forth.
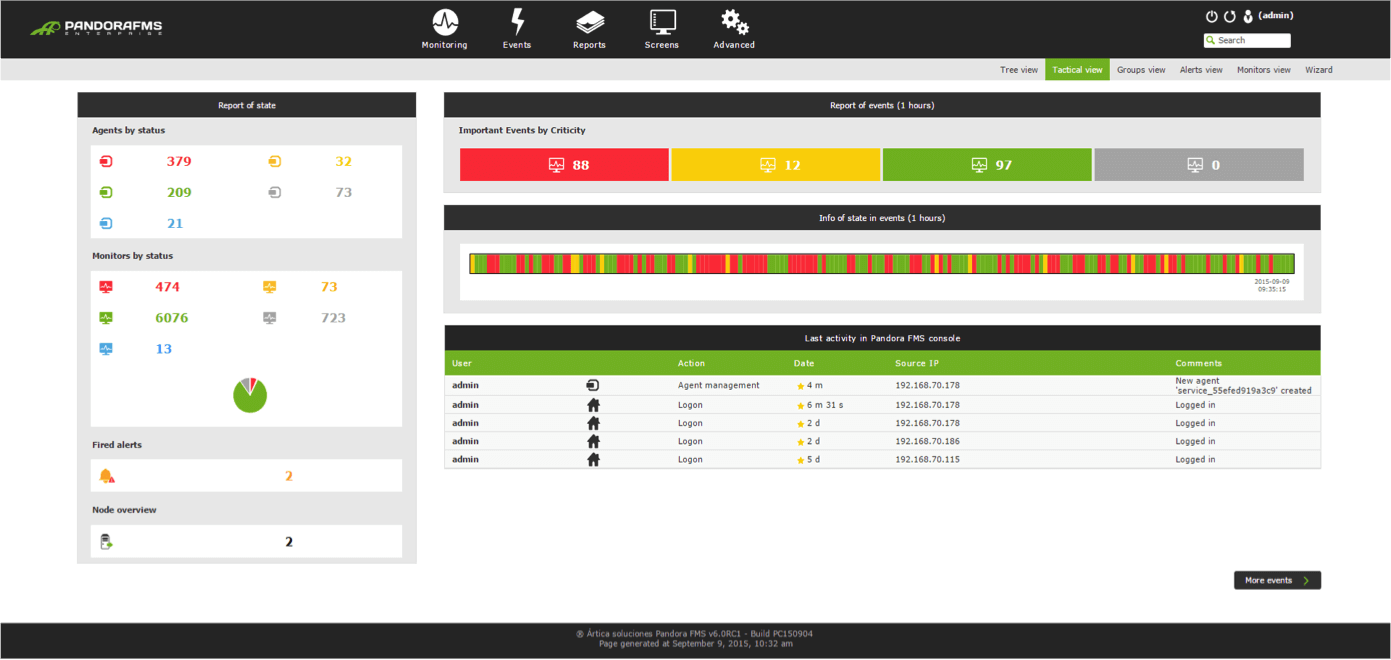
Figure 4. Pandora FMS UI
It is one of the few programs whose design is entirely original and not based on Nagios, making it completely scalable in large situations. Monitoring an environment with more than 100,000 nodes has not revealed any performance issues (in its Enterprise version).
We draw attention to its interaction with mobile devices, which allows you to access the console from them as well as keep an eye on them using their geolocation system. Its network auto-discovery mechanism can instantly locate each component of a network. Notwithstanding minor one-off variances, the development of interest in Pandora Flexible Monitoring Software has been consistent throughout time.
Pros of Pandora FMS are listed below:
- Using a single central console, it keeps track of everything (servers, applications, and networks).
- Scalability (tens of thousands of devices).
- There are many more things as well, such as network maps, reports, SLAs, integrated alerts, service maps, event correlation, log collection, etc.
- It has everything you need. The main cons of Pandora FMS is that its user base is smaller than that of other programs like Zabbix or Nagios.
5. Cacti
Cacti is a monitoring platform that allows for extensive customization and includes networking graphing and data visualization features. Similar to Prometheus, the platform is highly complex and needs a skilled administrator in charge to fully take advantage of all of its capabilities. SNMP, ICMP, and TCP/UDP availability checking are just a few of the protocols that Cacti uses to monitor networks and devices. The platform offers automated device and network discovery, making it a good choice for busy networks.
Key Features of Cacti are listed below:
- SNMP tracking
- Customizable
- Community assistance
The versatile data analysis program Cacti was developed to offer network monitoring. The system enables full customization but requires extensive setup. To speed up development, you may choose from a library of templates and plug-ins. Windows, Linux, and Unix are all supported by this program.
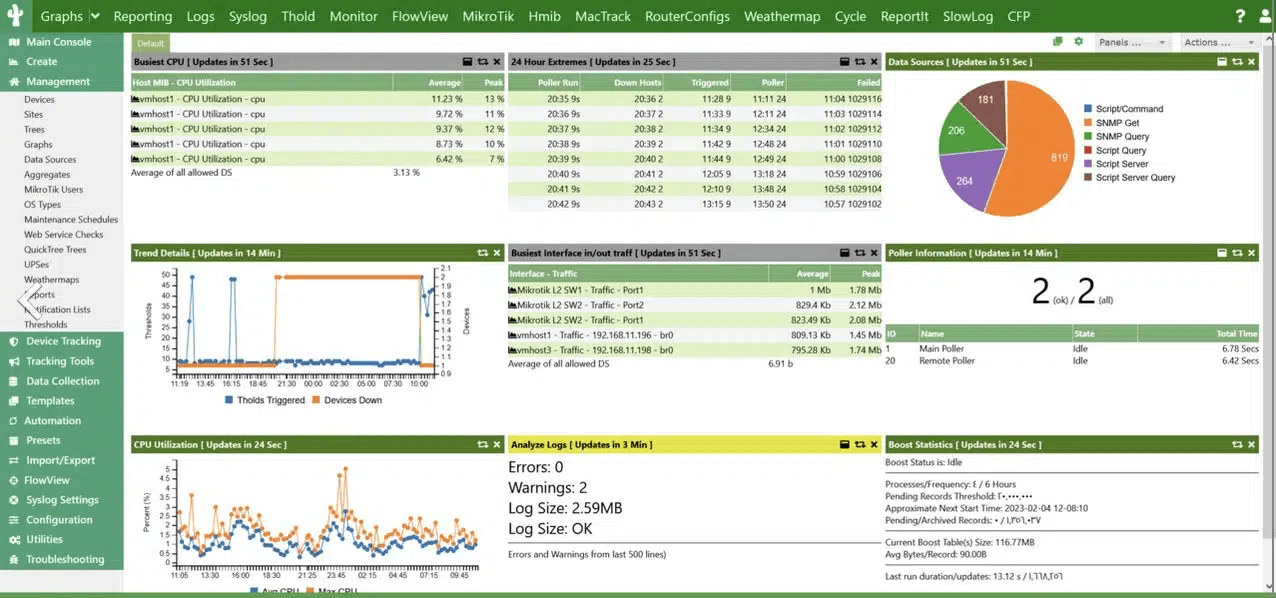
Figure 5. Cacti UI
Although the platform might occasionally seem overwhelming, there are more device and image templates accessible for consumers to utilize, so they can start using it right away. Cacti is quite green on the outside, but other than the obvious color scheme, it is rather simple to browse. There are six alternative themes available if you don't like green, and each one may be personalized in any way you wish.
The platform features a large number of plugins that all use the Cacti Framework to expand the platform's functionality. Both the community and some of the platform's top developers contributed to the creation of these plugins.
For assistance, Cacti currently includes a mailing list, an online forum, and rather extensive written documentation. There are a few video lessons on Cacti's YouTube channel.
For network administrators who wish to set up their own network monitoring system, the Cacti system is an excellent choice. It is perhaps better suited to small organizations with a peculiar network that is not fully covered by traditional monitoring solutions. This tool can be enhanced by people with technical knowledge and is akin to Prometheus.
Pros of Cacti are listed below:
- There are no restrictions on alterations.
- Data collection with several threads can provide network monitoring for thousands of devices.
- Extremely thorough charting and data visualization techniques
Cons of Cacti are given below:
- Really complicated
- You may want to see more user community platforms.
- For new users, video training might be quite helpful.
6. Zenoss
Zenoss software was developed by an American corporation to track storage, networks, servers, applications, and virtual servers. It is unique in that it monitors without the use of agents. Moreover, it comes in "Community" and "Commercial" versions, the latter of which has all functionality.
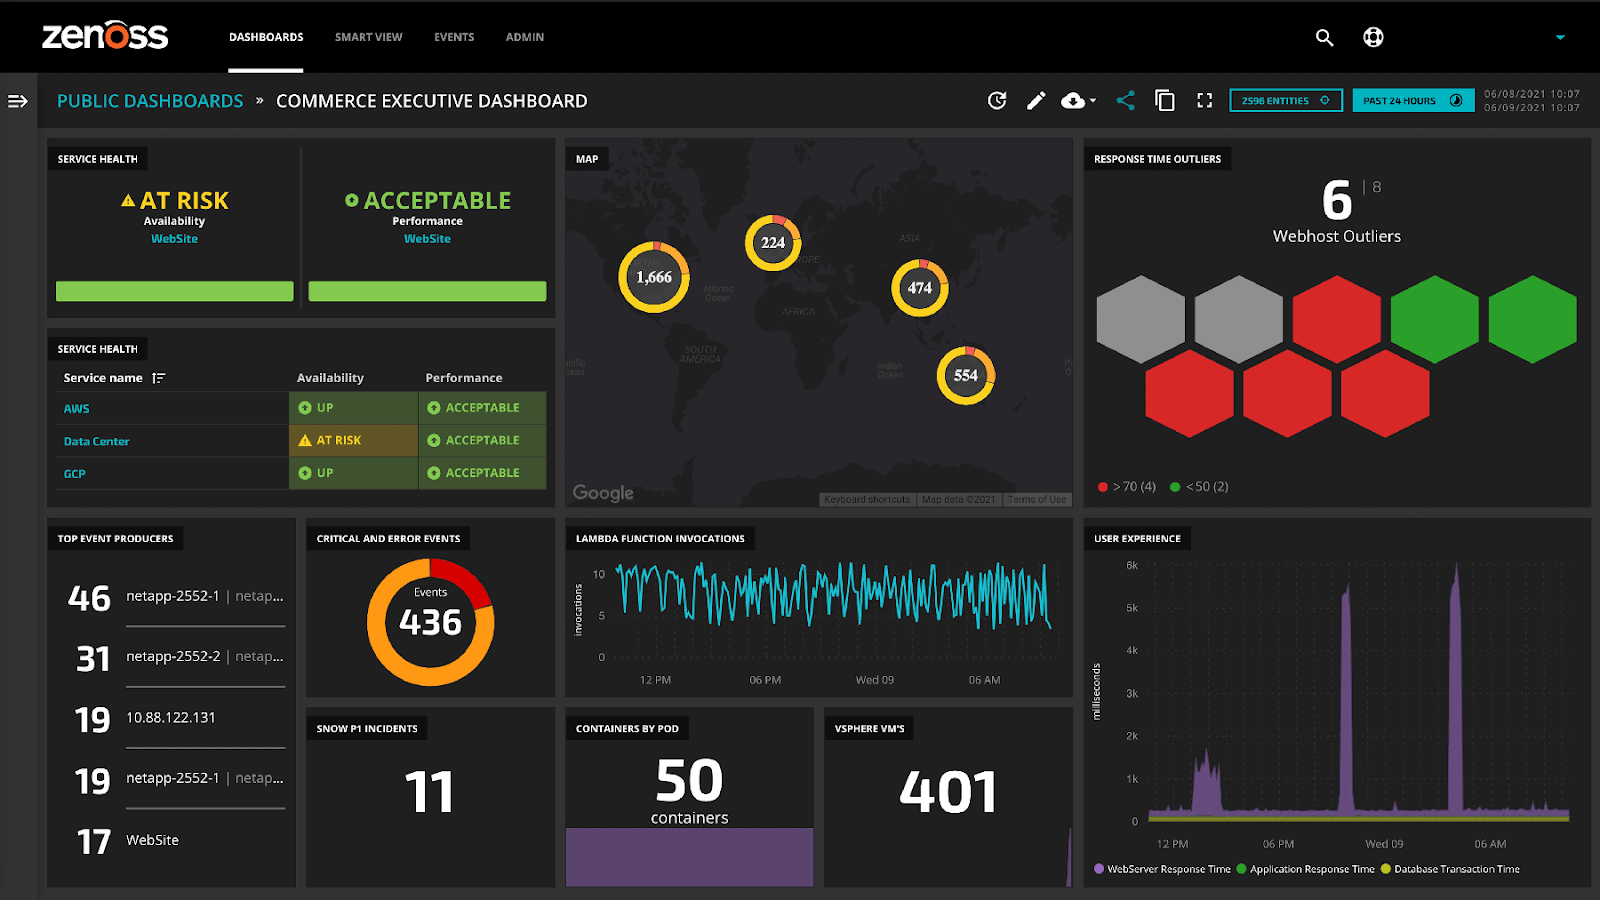
Figure 6. Zenoss UI
If you don't want to spend a lot of money on monitoring software, Zenoss is an intriguing option. You may rely on Zenoss as one of your network tools if you have a small number of computers and don't feel the need to spend money on exceptional features and support. Be careful; a highly powerful computer is needed as of Zenoss version 5.
Pros of Zenoss are as follows:
- in terms of platforms, off-road. It has the ability to be watched on several platforms.
- It has a versatile and modifiable dashboard. really potent.
- a strong capability for event management. extremely strong and adaptable.
Cons of Zenoss are listed below:
- It might be challenging to adjust, depending on the installation's complexity and the factors you wish to monitor.
- In expansive setups, the database layer may be burdensome.
- In some implementations, the dashboard might be sluggish and need extensive knowledge to be optimized.
- Underneath, it just has one MySQL server and its own database. It is incompatible with other databases.
- Topology maps fall short of other applications in terms of strength and clarity.
What are the popular Paid (Commercial) Network Monitoring Tools?
The top paid network monitoring tools are as follows:
- SolarWinds Network Performance Monitor (NPM)
- PRTG Network Monitor
- WhatsUp Gold
- Datadog
- LogicMonitor
- ManageEngine OpManager
1. SolarWinds Network Performance Monitor (NPM)
SolarWinds Network Performance Monitor is a complete network performance monitoring tool that can track device status through SNMP. It can easily discover network devices connected to your network. Use the dashboard to keep a close eye on the performance and availability of all connected network devices.
Key Features of SolarWinds NPM are listed below:
- SNMP monitoring
- Automatically discovers connected network devices
- Network packet analysis
- Intelligent network maps with NetPath
- Create WiFi heat maps
- Alerts system
- Reports system
The NetPath tool is one of SolarWinds' distinctive features. This is comparable to the TraceRoute feature included in other products on our list, notably PRTG and Site24x7. The path is depicted visually by NetPath, though.
The SolarWinds Network Performance Monitor is an automatic monitoring tool that locates all networked devices, maps them, and keeps an eye out for performance problems. This system will notify you if there are any issues with the collection. A network topology map, which shows how your infrastructure is connected, is used to see any found devices, programs, or services. You may trace packet transfers hop-by-hop with the help of the NetPath function, which can help you pinpoint the root cause of network performance issues more precisely. You can specify alert trigger circumstances using the custom alert system. The program will notify you through email or SMS when the trigger requirements are satisfied to let you know that an event has occurred. Visit the All Active Alerts page to get a full list of alerts organized by severity.
SolarWinds Network Performance Monitor automates network monitoring and is used by all sizes of businesses because it doesn't require expert network administration skills. It can even set itself up. Because of alerts, you can put your time to other uses and let the NPM take care of the network as long as you don't receive a signal that something is wrong.
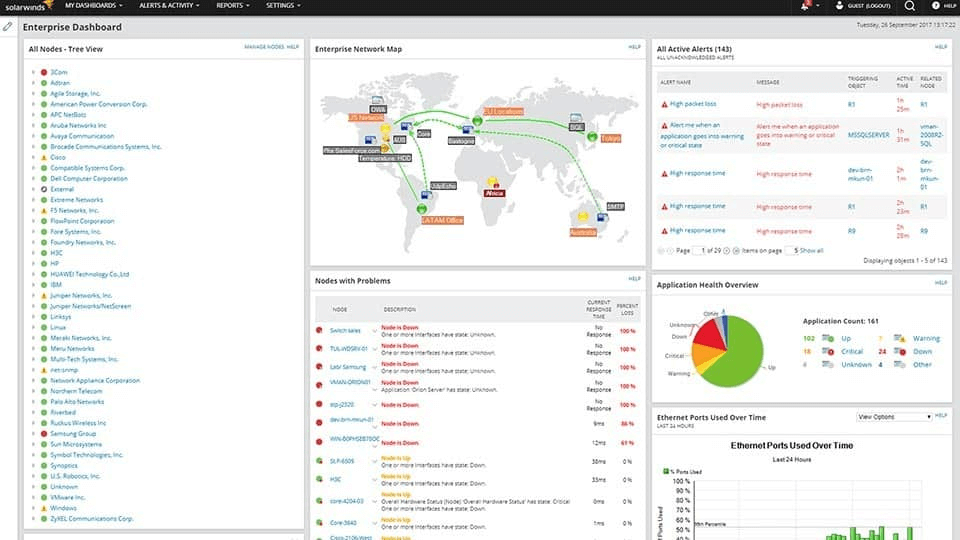
Figure 7. SolarWinds NPM UI
Pros of SolarWinds Network Performance Monitor are listed below:
- Intended for use with large and corporate networks
- Enables auto-discovery, which creates network topology maps and inventory lists based on new device arrivals in real time
- Has some of the greatest alerting features that strike a mix between usability and effectiveness
- Gives you greater control over monitoring than similar tools since it supports both SNMP monitoring and packet tracing
- Alters the look and feel of the dashboard using drag-and-drop widgets
- Robust reporting system with ready-made compliance templates
The main cons of SolarWinds NPM is that small LANs and operations could find this corporate solution to be too feature-rich and confusing.
Because of its extensive feature set, SolarWinds Network Performance Monitor is our top network monitor. With ease, it can switch from SNMP monitoring to packet analysis, providing you flexibility over which areas of your network you choose to watch. Starting at $2.995, SolarWinds Network Performance Monitor is available for purchase.
2. PRTG Network Monitor
Using SNMP, packet sniffer, and WMI, PRTG Network Monitor by Paessler is a free network monitoring tool that keeps a watch on your network. Search for and add devices to monitor by scanning network segments. You may choose from a selection of sensors to monitor various components of your network. Each sensor tracks a different value within your network; for example, there are sensors for bandwidth monitoring, hardware parameters, network data utilization, SNMP, VOIP, QoS, and more.
Key Features of PRTG are as follows:
- SNMP monitoring
- Bandwidth monitoring
- Scan for network devices by IP segment
- Custom dashboards
- Threshold-based alert system
- Reports system
- Customizable network maps
PRTG is likely the finest option among the on-premises solutions on our list for monitoring website response times. A Web Page Sensor is part of the PRTG system and tracks page load times. This can be used immediately or on a predetermined schedule. A Ping-based website availability monitor is part of the bundle. The free edition of the PRTG system includes all of the website monitoring sensors.
A highly versatile service is Paessler PRTG. You may design your own specialized network, server, and application monitoring solution by selecting which sensors to activate.

Figure 8. PRTG Network Monitor UI
The application offers a configurable dashboard that enables you to create real-time network maps of your infrastructure for improved visibility. Using the drag-and-drop editor, you can build maps using more than 300 map items. Even better, you can use customized HTML to make your own map items.
In the event that a sensor's state changes, value shifts, or a threshold is crossed, the threshold-based alert system keeps the user informed. Email, push notifications, SMS, Slack messages, Syslog messages, SNMP traps, HTTP actions, running programs, and more formats are among the possible notification types. Large enterprises might use PRTG because of its comprehensive nature, which offers thorough monitoring for all types of IT systems. Small firms, however, find the free option, which has a cap of 100 sensors, to be quite enticing.
Pros of PRTG are listed below:
- Combines packet sniffers, WMI, and SNMP to produce reports on network performance.
- The completely customizable dashboard will be useful for both independent administrators and NOC teams.
- It is simple to create custom views and reports using a drag-and-drop editor.
- Supports a variety of alert delivery methods, including SMS, email, and third-party platform integrations like Slack.
- Each sensor is uniquely constructed to track the application it is used for. For instance, some prebuilt sensors are built to record and track VoIP activities.
- Allows for a freeware version
The main disadvantage of PRTG is that it is a highly thorough platform with several features and moving pieces that take time to understand. For businesses searching for affordable yet comprehensive network monitoring solutions, PRTG Network Monitor is a must-try. Less than 100 sensors may be used on the platform for free before you have to start paying. Paid versions start at $1.600 for the installation of 500 sensors on one server. You may get a 30-day free trial of the Windows Server operating system-based PRTG software.
3. WhatsUp Gold
WhatsUp Gold by Progress (formerly Ipswitch) combines log and configuration management with network and application performance monitoring. After being bought by Progress, the monitoring tool has received a significant overhaul and has resolved many of the usability and interface problems for which it had previously come under fire. Like the majority of professional monitoring tools, WhatsUp Gold has an automated device discovery feature that scans the network for available devices. However, it goes a step further: following device discovery, the tool automatically generates interactive layer 2 and layer 3 network topology maps that are dynamically updated as network changes occur or based on predetermined network scans.
WhatsUp Gold does not, however, have any prebuilt integration templates compared to, say, PRTG. REST API calls are required for integrations with third-party systems and apps, therefore, there is a lot of configuration and setup required.
Real-time alerts and customizable notifications are provided by WhatsUp Gold. A helpful feature is the ability to designate which application components are vital or not, in addition to setting certain thresholds. This enables you to produce pertinent warnings for business-critical components that might obstruct your network if there are any problems.

Figure 9. WhatsUp Gold UI
WhatsUp Gold's absence of an open licensing policy is a disadvantage. You must request a price and provide information about your network infrastructure because each version is individually designed. The license is based on devices or points, depending on the version you select. Certain functions, such as network traffic analysis or application monitoring, are only offered as add-on modules (or are automatically included in the Total Plus license). WhatsUp Gold costs a little bit more than other monitoring products.
Pros of WhatsUp Gold are listed below:
- Since being bought by Progress, this interface has been clear and simple to use
- Combination of log and configuration management with network and application performance monitoring
- Network detection and topology mapping are automatically performed
- Alerts and notifications that may be partially customized
- Connectivity with different third-party tools is possible
Cons of WhatsUp Gold are given below:
- Because there are no prebuilt integration templates, a lot of configuration and setup work must be done via REST API requests.
- Expensive cost with opaque license; each version is individually customized
- Fewer automation features than those of other network monitoring tools
- Basic reports are accessible, and there are no sophisticated reporting tools. There are few customization possibilities, making it unsuitable for enterprises with particular monitoring needs.
4. Datadog
A cloud-based SaaS infrastructure monitoring solution called Datadog Network Performance Monitoring looks at network traffic flows. A network device monitoring service, which focuses on the status of each network device, including switches, routers, and appliances, is linked with it.
Key Features of Datadog are listed below:
- Network mapping and protocol analysis in real-time
- Notifications of performance thresholds that have been altered using machine learning
- Correlation with information from other sources, such as SNMP Teams may monitor and analyze data from many sources with Datadog's out-of-the-box connection with hundreds of well-known services and platforms, including web servers, databases, cloud services, and even specialized applications like Shopify and WordPress.
With this adaptable plan, you may choose to subscribe to device tracking, traffic monitoring, or both. Datadog Network Monitoring can monitor any network worldwide from a single operations center thanks to its cloud-based infrastructure.

Figure 10. Datadog UI
The network monitoring efforts for several sites and cloud services may be combined using the Network Performance Monitor. The monitoring software's CPU and storage space are both included in the service as a SaaS package. This network monitoring service provides packet capture and analysis tools in addition to live status updates.
You may have total control over your networks by combining the Network Performance Monitor with the Network Device Monitor. On registration, the system provides an autodiscovery feature that lists every device linked to your network. The service builds an IT asset inventory, and from that, it produces a network topology map. Whatever adjustments you make to your infrastructure are automatically reflected in the network inventory and the topology map since the autodiscovery process runs continually.
Switches and routers are queried for status information by the Network Device Monitor using the Simple Network Management Protocol (SNMP). These reports are analyzed to display real-time device health information on the screen. This system collects details on each device, including its brand, model, age, and processing power.
Each piece of network equipment has an SNMP agent already installed by the manufacturer, and if the agent detects an issue with the device, it notifies the appropriate parties. These messages are retrieved by the Datadog Network Device Monitoring service, which then shows them as alerts in the system console.
The alerting mechanism in Datadog Network Device Monitoring may be modified to create an alert if any of the metrics that the system obtains crosses a preset threshold. You may set your own thresholds to receive notifications for any situation. There is a warning system built into the Network Performance Monitor, so when bottlenecks start to appear, traffic limits will be recognized.
To get notifications via email, SMS, PagerDuty message, or Slack message, you may set up an alert forwarding rule. Because you will be informed if human intervention is required, you may let the two network monitoring systems keep an eye on the network on their own.
The Network Performance Monitoring module's traffic monitoring services go beyond merely counting the number of packets traveling over the network. It can do activity monitoring for containers and detect data flow within a virtualization system. The utility includes cloud services, where it may display the inbound and outbound traffic for each of your cloud-based accounts.
The Datadog Network Monitoring solution would be most advantageous for centralized data centers. Without having to visit the location, the program may be configured remotely to monitor any network.
Just two modules exist on the Datadog platform: Datadog Network Performance Monitoring and Datadog Network Device Monitoring. These programs integrate nicely with the Datadog APM and Synthetic Monitoring service, among other Datadog monitors. All Datadog products are available for a 14-day free trial.
Pros of Datadog are as follows:
- With autodiscovery, a network asset inventory that is continually updated may be created.
- SNMP monitoring for network devices
- Mapping the network topology
- Alerts may be received through SMS, email, Slack, or PagerDuty.
- Tracking traffic trends, including virtualization activity
- A cloud-based platform with integrated metrics storage
The main drawback of Datadog is that the trial time should be extended.
5. LogicMonitor
The health and performance of network devices as well as network traffic are monitored using the cloud-based network monitoring software LogicMonitor.
LogicMonitor does not require an on-premises installation because it is a SaaS product. It can be swiftly set up thanks to its auto-discovery capability, which depending on the hostnames or IP addresses you give, automatically gathers data about your IT infrastructure. Then, new network devices are dynamically found.
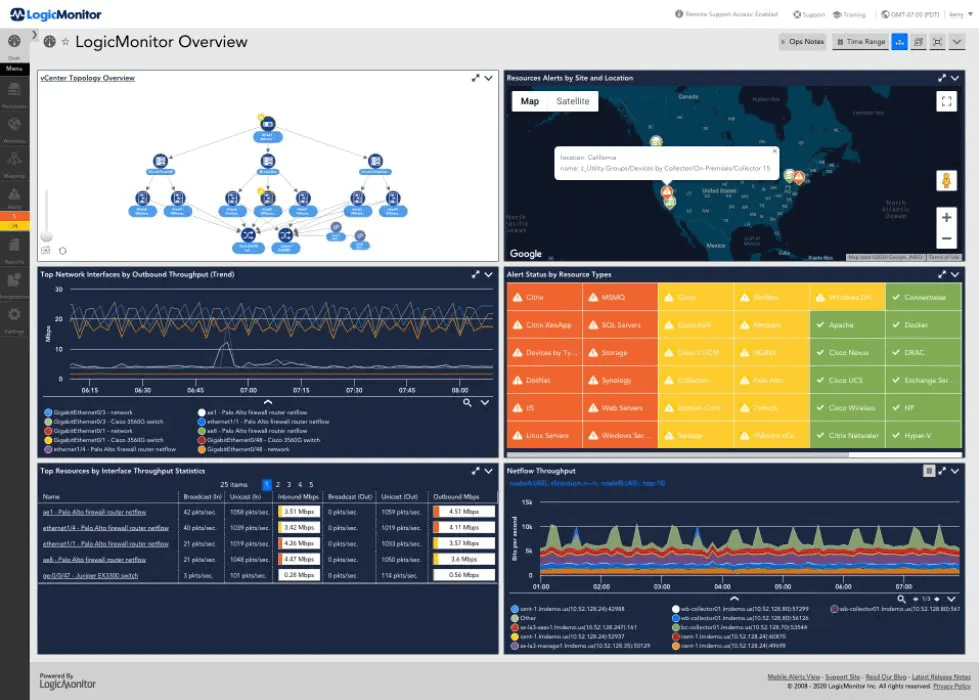
Figure 11. LogicMonitor UI
Your network devices are monitored by LogicMonitor using SNMP, flow protocols (NetFlow, jFlow, sFlow, and IPFIX), WMI, and NBAR2. It has a ton of connectors for well-known suppliers that make setting up your monitoring simple.
By separating warnings that affect your services from ones that do not, intelligent alerting avoids alert fatigue. Moreover, you can alter the default alert levels and leverage built-in interfaces with service management or communication solutions to inform your staff.
The network topology maps that LogicMonitor offers are pretty much its only visualization choices. They, however, are created automatically and help you identify connections between your network's business-critical devices and services. As the topology maps are interactive, you can easily identify the source of a problem.
LogicMonitor's free trial period is just 14 days long. Sadly, this limited time frame makes it difficult to evaluate all functionality. You have two purchasing options for the complete version: Pro, which covers up to 199 devices, and Enterprise, which adds AIOps features for more than 200 devices. The cost per gadget is determined through quotes.
Pros of LogicMonitor are as follows:
- Simple installation and integration with a large number of third-party applications
- Strong scalability to accommodate varying business needs
- Intelligent alerting that may be customized to avoid alert fatigue
- The platform for cloud-based network monitoring that doesn't require installation on-premises
- Extensive assistance, such as user forums, tutorials, and online documentation
Cons of LogicMonitor are listed below:
- It may be expensive for small organizations that must keep track of several devices.
- Overall, there are fewer customization choices than with other monitoring systems.
- It may be difficult to configure, making it appropriate for more experienced users.
- Only network topology diagrams are available as visualizations
- Limitations on data retention may force organizations to buy more storage.
6. ManageEngine OpManager
ManageEngine OpManager is a network monitoring tool that can track the functioning of virtual machines, servers, routers, and switches in real time. Around 200 widgets are available on customizable dashboards, so you can design a special monitoring experience.
Key Features of ManageEngine OpManager are listed below:
- Automatic discovery
- Network mapping
- SNMP monitoring
- Email and SMS alerts
- Customizable dashboards
OpManager tracks servers in addition to network gear, unlike the other on-premises network monitoring programs on this list. The OpManager system's server monitoring tools keep track of crucial resource indicators, including CPU, RAM, and disk capacity and use.
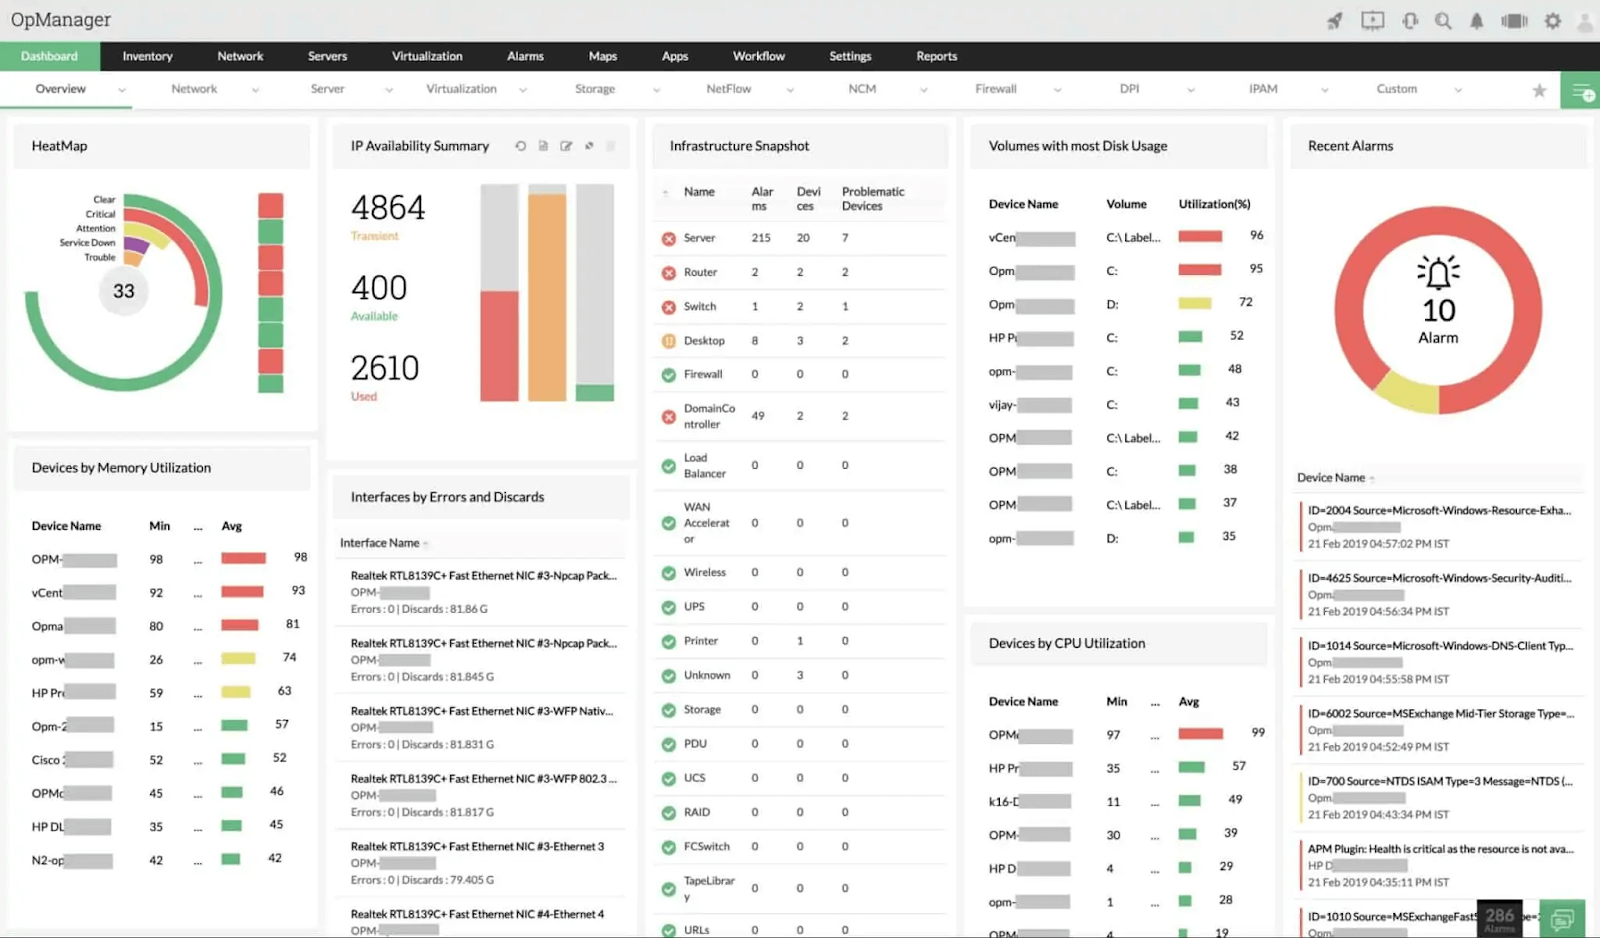
Figure 12. ManageEngine OpManager UI
One of the only comprehensive network monitoring tools with a graphical user interface for Linux is ManageEngine OpManager. OpManager's high-quality graphs and charts make it simple to identify status, despite the fact that the majority of Linux network monitors are command-line applications.
You are kept informed about the functionality of the devices in your network thanks to SNMP monitoring. The network mapping tool lets you instantly find and map new devices for better visibility. After new devices are connected to your network, network discovery may be scheduled to find them. You can react promptly to changes in performance thanks to the alert system. In order to reduce false positives, ManageEngine OpManager correlates network events and only shows the user relevant warnings. The software notifies you of any new issues by sending email and SMS notifications. Those who desire a straightforward infrastructure monitoring solution are advised to utilize ManageEngine OpManager, an all-in-one network monitor. It is possible to install this software package on Linux, Windows Server, Azure, and Amazon. Although it functions effectively on each of these platforms, ManageEngine OpManager is regarded as the top Linux-based network monitoring system.
Pros of ManageEngine OpManager are listed below:
- With over 200 movable widgets, it is possible to create customized dashboards and reports right away.
- Makes use of auto-discover to locate, list, and map new devices
- Reduces false positives and warning fatigue over larger networks by using intelligent alerting
- Supports a number of alerting methods, such as webhooks, email, and SMS
- Integrates effectively with the other tools from ManageEngine.
The main disadvantage of ManageEngine OpManager is that it is a powerful tool with many features that will take some time to master. Those who desire a straightforward infrastructure monitoring solution are advised to utilize ManageEngine OpManager, an all-in-one network monitor. Paid versions range in price from $245 for devices up to 1,000 up to $11,545 for devices 250 to 10,000. Download the risk-free 30-day trial now.
What are the factors to consider when choosing a Network Monitoring Tool?
An integral component of your organization's infrastructure should be a thorough network monitoring system. Full network visibility provided by monitoring may help you lower the likelihood of downtime and sluggish performance, which will eventually increase customer and employee satisfaction. Which of the many commercial and open-source monitoring companies is best for your company? What considerations must you make before you dive in? Before implementing a solution, make sure your IT staff is ready, capable of using it, and aware of its advantages, as well as that it meets your company's short- and long-term objectives. These are our top 10 suggestions to think about before committing a network monitoring solution:
- Recognize your priorities: Make a list of everything you want or need to keep an eye on. Do you want to track uptime alone, for instance, or do you want built-in email-specific monitoring if you want to monitor your email server? What kind of alert do you need? What reporting features do you require? Are you interested in an appliance or only a software-based solution? Are you intending to virtualize the solution? How easy is it to set up and install? While prioritizing the solution to select, you should consider these and other questions. There is no one solution that works for all businesses and networks since they are all unique.
- Availability of IT resources: How large is your support staff right now? Do you have procedures and roles in place to handle the activity the system generates? Make sure you are aware of who on your team is in charge of reviewing reports, assigning priority to events, and taking care of issues in each region of your network before you put your new monitoring system into place.
- The sequence of events: Make sure you have a strategy and procedure in place in case an event occurs. How will BAU activities be affected? Is there a formal escalation procedure? Does your team recognize its responsibilities? Is there a strategy in place for contacting them?
- Multi-site companies: Your IT team's or support provider's capacity to maintain your network may be impacted by where they are located. To guarantee that local employees can respond promptly to issues before they worsen, place them close to your data center. Make sure they have the knowledge necessary to maintain the hardware they are maintaining.
- Your monitoring solution's scope: In addition to the preceding point, any network monitoring system you select must be able to manage the many hardware and software configurations you have. It should be able to handle several locations and distant sites (in the event of multi-site or multinational enterprises). It should be capable of handling virtualized appliances if you have any. Recognize the structure of your own network before contacting a monitoring supplier.
- SLA for the solution: Make sure you have support level agreements (SLAs) in place for both internal and external help. Understand their escalation procedure if you are working with an external support partner. Determine if an external business SLA may be modified to meet your company's internal demands.
- After-hours assistance: Make sure you have after-hours assistance set up, as we covered in our last article. This is crucial for firms that require 24/7 consumer access, such as banks or online stores. Are there procedures and preparations in place for after-hours incidents?
- Scalability: Whichever monitoring program you use, be sure it can adapt to changes without any trouble. Networks in business are always changing. When a firm expands, more devices are installed and switched out. Your selected monitoring system must be able to handle and adapt to these changes since network support will need to modify itself to accommodate these adjustments.
- Automated configuration and discovery: Automating monitoring is time and money-effective if your company has a sizable, multi-site network. Devices are monitored as they are added without user involvement if the monitoring system has the capacity to detect and configure itself. For instance, the Simple Network Management Protocol (SNMP) enables rapid and simple device addition.
- Customization to your procedures and needs: Every company and network has a unique set of procedures and specifications. Whichever monitoring system you select, be sure it provides complete customization and that the output meets your procedure for handling that alert.