Introduction to OPNsense Diagnostic Tools
In the world of network management, ensuring a smooth and secure online experience requires constant vigilance. Diagnostic tools are your allies in this endeavor, acting as the magnifying glass and stethoscope of your network, allowing you to proactively monitor its health and identify and address issues before they become major disruptions.
OPNsense, a powerful open-source firewall platform, equips you with a comprehensive arsenal of diagnostic tools categorized to target specific aspects of your network infrastructure. These categories cater to various needs, providing insights into:
- System Diagnostics: Gaining a holistic understanding of your system's overall health, including CPU usage, memory consumption, and system logs.
- Interface Diagnostics: Delving into the nitty-gritty of your network interfaces, analyzing traffic flow, identifying potential bottlenecks, and troubleshooting connectivity problems.
- Firewall Diagnostics: Ensuring your firewall operates optimally, verifying rule functionality, and investigating suspicious activity or connection attempts.
- VPN Diagnostics: Maintaining secure and reliable VPN connections by monitoring tunnel status, examining logs for potential errors, and troubleshooting configuration issues.
By delving deeper into these categories in the following sections, you'll gain a thorough understanding of how OPNsense's diagnostic tools empower you to maintain a robust and secure network environment.

System Diagnostics
OPNsense equips you with a robust suite of diagnostic tools, offering a window into the heart of your system. Within this suite lies System Diagnostics, a three-pronged approach designed to provide you with a comprehensive understanding of your system's health and performance. The main components of System Diagnostics on OPNsense are as follows:
- Activity
- Services
- Statistics
By leveraging these three key components of System Diagnostics, you gain valuable insights into your OPNsense system's inner workings, empowering you to make informed decisions, troubleshoot issues effectively, and maintain a healthy and efficient network environment.
Activity
The activity module displays current active processes and provides basic statistics such as CPU usage, memory consumption, and process IDs. To view the list of active processes on OPNsense, navigate to the System → Diagnostics → Activity on web UI. Here's a breakdown of each column:
- PID: Process ID - A unique identifier assigned to each running process.
- USERNAME: Username - The user account under which the process is running.
- PRI: Priority - The current priority level of the process, influencing its scheduling by the operating system.
- NICE: NICE value - A numerical value (-20 to 20) indicating the process's relative priority compared to other processes. Lower values represent higher priority.
- SIZE: Size - The total memory size occupied by the process, including code, data, and stack segments.
- RES: Resident memory - The amount of physical memory (RAM) currently being used by the process.
- C: CPU (visible only on multi-processor systems) - The CPU core on which the process is currently executing.
- TIME: CPU time - The total amount of CPU time (system and user) consumed by the process.
- WCPU: Weighted CPU percentage - An estimate of the CPU utilization by the process, taking into account process priority and execution time.
- COMMAND: Command string - The actual command or program name that initiated the process.
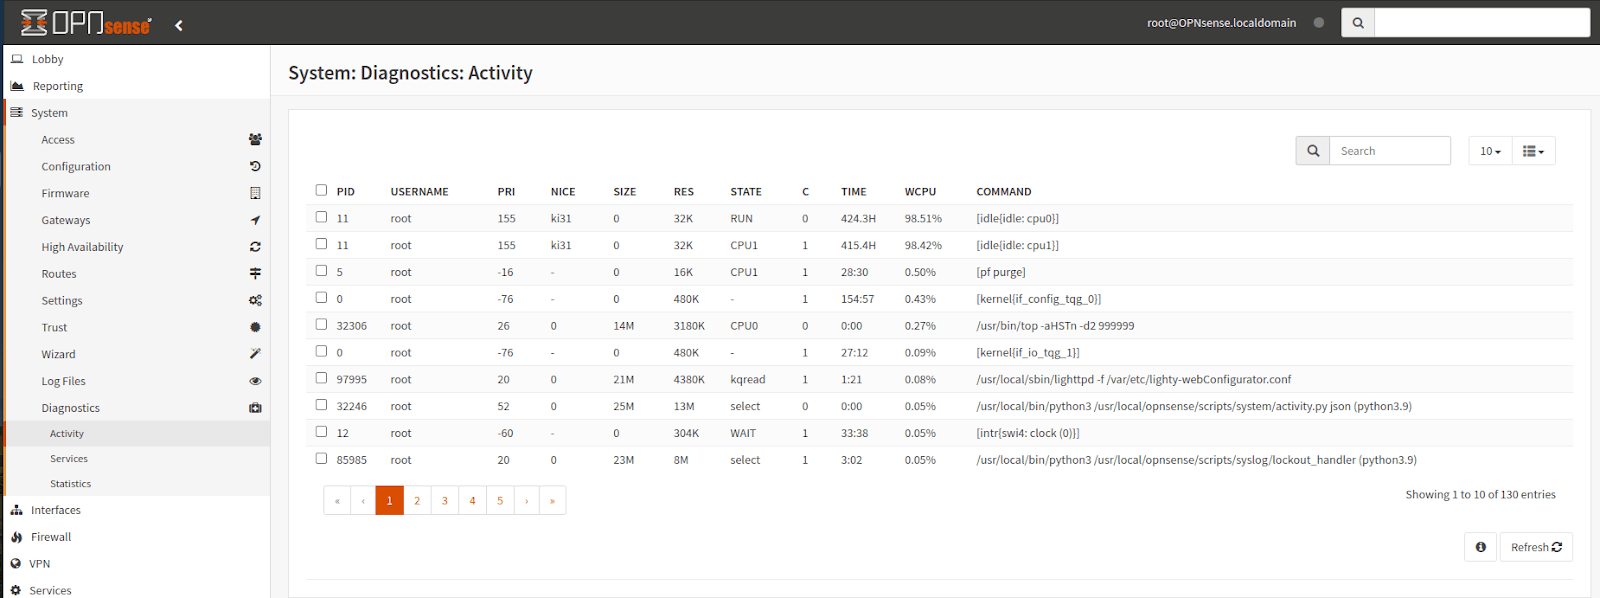
Figure 1. OPNsense System Diagnostics by Activity
What is the aim of Activity Diagnostics on OPNsense?
By analyzing this information, you can gain valuable insights for the following purposes:
- Resource utilization: identify processes consuming significant CPU, memory, or other resources.
- System stability: Monitor for unusual process behavior that might indicate potential issues.
- Security analysis: Investigate suspicious processes or unexpected user activity.
- Troubleshooting: Identify processes involved in specific functionalities or causing errors.
Remember, interpreting this information effectively requires understanding system processes and their typical resource usage patterns.
Services
The System → Diagnostics → Services menu in OPNsense displays information and allows management of various system services essential for its operation. This section provides an overview of essential services running on your system. The services diagnostics page lists the following details:
- Name: The descriptive name of the service.
- Description: A brief explanation of the service's purpose.
Understanding these services is crucial for maintaining system stability and functionality. You can identify critical services, diagnose service failures, and ensure they operate as intended.
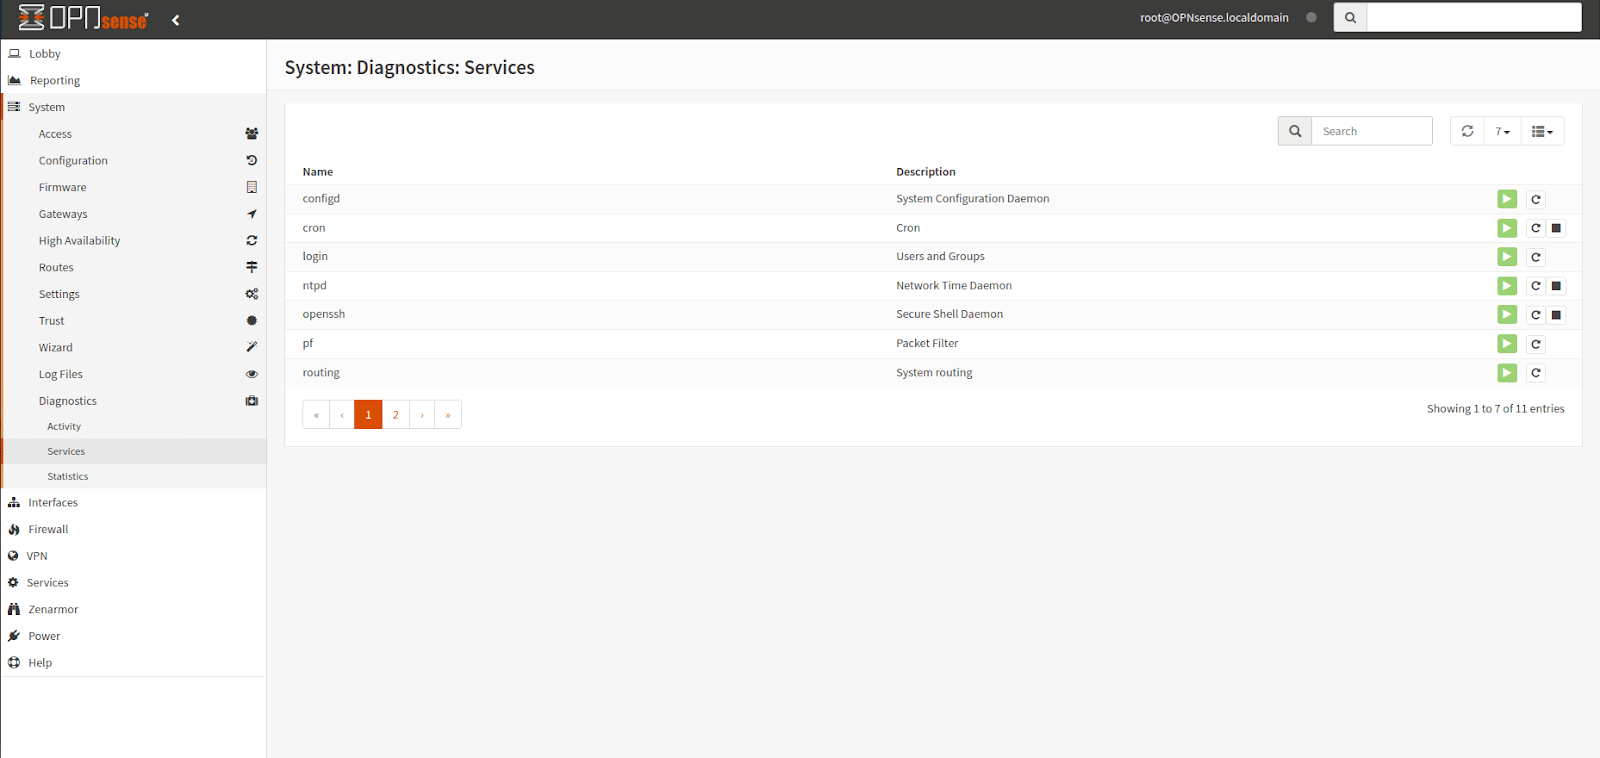
Figure 2. OPNsense System Diagnostics by Services
What are the OPNsense services?
The breakdown of some OPNsense services are listed below:
-
configd:
- Description: System Configuration Daemon
- Functionality: Manages system configuration files and ensures their consistency.
- Importance: Crucial for maintaining system stability and proper configuration application.
-
cron:
- Description: Cron Job Scheduler
- Functionality: Executes scheduled tasks and scripts at predefined intervals.
- Importance: Enables automation of various system tasks like backups, log rotations, and software updates.
-
login:
- Description: Login Service
- Functionality: Handles user login attempts and authentication processes.
- Importance: Essential for secure access to the OPNsense web interface and console.
-
ntpd:
- Description: Network Time Protocol Daemon
- Functionality: Synchronizes the system clock with external time servers for accurate timekeeping.
- Importance: Ensures consistent timestamps for logs, system events, and network communication.
-
openssh:
- Description: Secure Shell Daemon
- Functionality: Provides secure remote access to the system using SSH protocol.
- Importance: Enables secure administration and management of OPNsense from remote locations.
-
pf:
- Description: Packet Filter Firewall
- Functionality: Provides core firewall functionality for filtering and controlling network traffic.
- Importance: Essential for protecting your network from unauthorized access and malicious activity.
-
routing:
- Description: System Routing Service
- Functionality: Manages routing of network traffic between different interfaces and networks.
- Importance: Ensures efficient and accurate packet delivery within your network and to the internet.
The above list represents a subset of commonly encountered services on OPNsense. Other services might be present depending on your specific configuration and installed packages.
What are the Tasks on the Services Diagnostic Page?
The Services menu usually provides the following information and options for each service at the right of the page:
- View Status: Whether the service is running, stopped, or encountering errors.
- Start/Stop: Ability to manually control the service's state.
- Restart: Option to restart the service if necessary.
- Configure: Access to service-specific configuration settings.
By understanding the purpose and importance of these services, you can effectively manage your OPNsense system and ensure its smooth operation and security.
Statistics
The information displayed under System → Diagnostics → Statistics on OPNsense provides insights into your system's memory usage and allocation. Here's a breakdown of the sections:
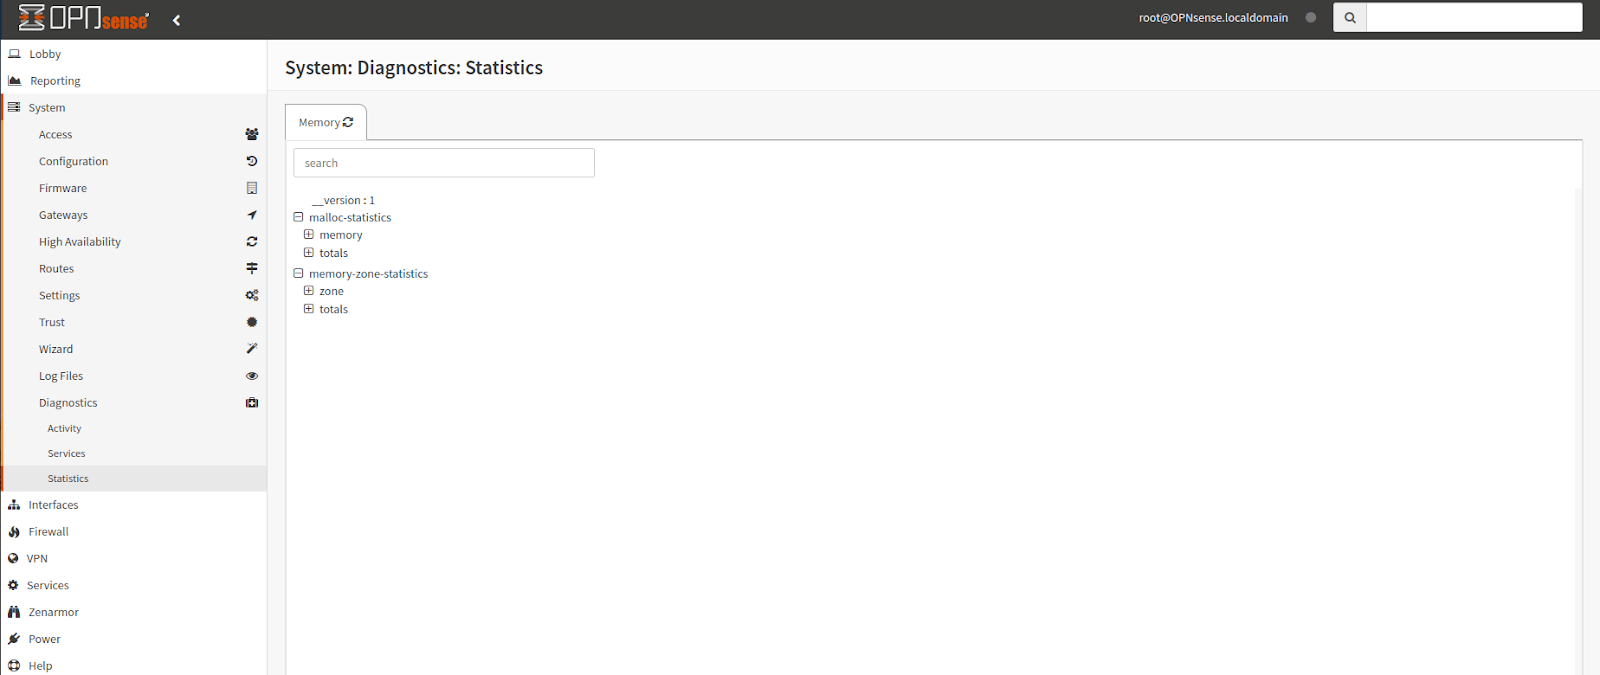
Figure 3. OPNsense System Diagnostics by Statistics
-
__version: This simply indicates the version of the memory management software being used.
-
Malloc-statistics: This section focuses on memory allocated using the malloc function, a common memory allocation method in C programming. It likely displays further details like:
- memory: Total amount of memory allocated using malloc.
- chunks: Number of individual memory blocks allocated.
- highwater: Highest memory usage observed since the system started.
- requests: Total number of memory allocation requests made.
-
Memory-zone-statistics: This section delves deeper into memory allocation categorized by different memory zones. Memory zones are specific areas within the memory space used for different purposes with varying allocation and management strategies. The zone subsection likely displays information for individual zones, potentially including:
- totals: Similar statistics as the overall memory section but specific to the zone.
- allocations: Number of memory allocations within the zone.
- size: Total size of memory allocated in the zone.
By analyzing these statistics, you can identify areas for optimization, monitor resource consumption trends, and proactively address potential issues before they impact system performance.
Understanding memory statistics on OPNsense helps you to perform the following tasks:
- Monitor memory usage: Identify potential memory bottlenecks or resource constraints.
- Diagnose memory leaks: Investigate if processes are not releasing memory properly.
- Optimize memory allocation: Adjust configurations or resource allocation strategies if necessary.
However, interpreting these details effectively often requires familiarity with memory management concepts and OPNsense's specific memory allocation mechanisms.
Interfaces Diagnostics
The interface diagnostics page contains various tools to help debug network issues, including the ARP table, DNS lookup, NDP table, ping, port probe, traceroute, and packet capture. To access the Interface Diagnostics menu, you may navigate to Interfaces → Diagnostics on OPNsense web UI.
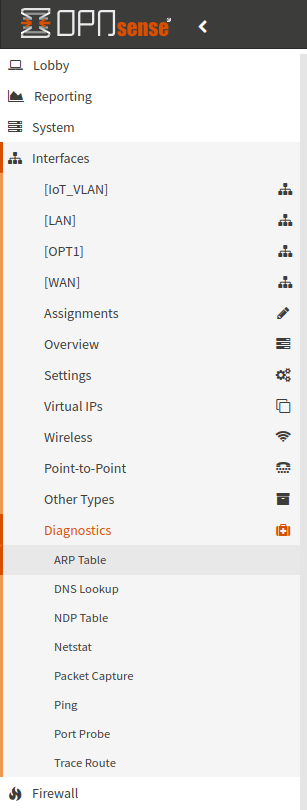
Figure 4. OPNsense Interface Diagnostics
Alternatively, you can access the interface diagnostics page directly by using the search box "Diagnostics" in the top menu and selecting "Interfaces" from the search results.
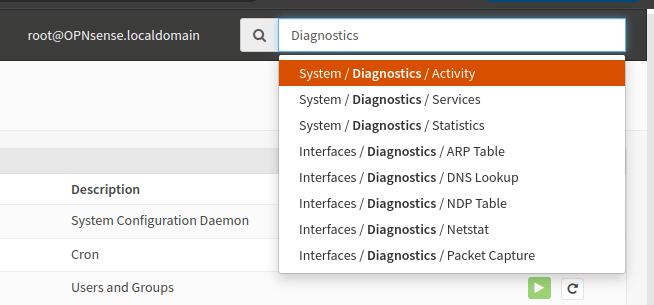
Figure 5. OPNsense diagnostic via search box
ARP Table
The ARP Table module in the diagnostics tool displays information about MAC addresses known by the firewall. It includes the IPv4 address, MAC address, manufacturer information based on the MAC address, associated interface, interface name, and hostname (if available from the DHCPv4 leases file) for the respective MAC addresses. This information helps in identifying and managing network devices connected to the firewall.
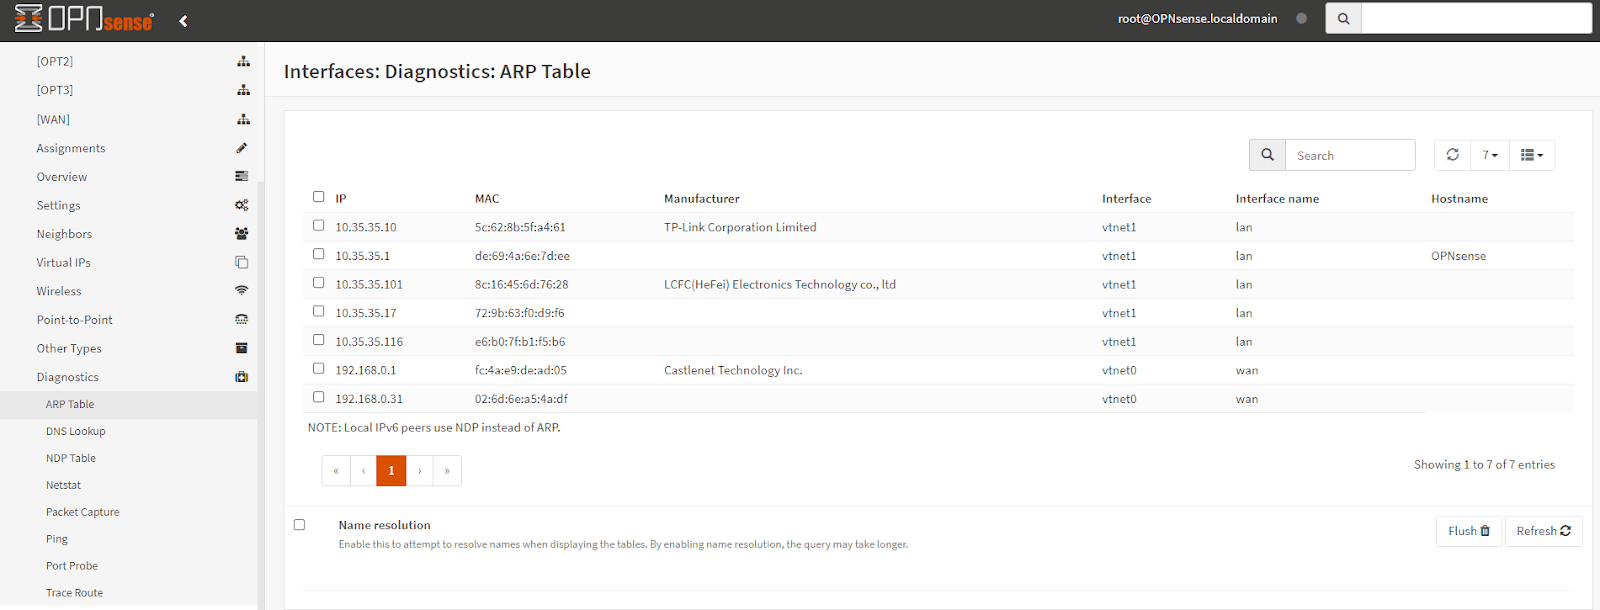
Figure 6. OPNsense Interface Diagnostic via ARP Table
The ARP Table within the Diagnostics section of OPNsense provides valuable information about devices connected to your network, aiding in identification, troubleshooting, and network management. To view the ARP Table, you may navigate to Interfaces → Diagnostics → ARP Table on OPNsense web UI.
The ARP table displays the following details for each entry:
- IPv4 Address: The IP address of the connected device.
- MAC Address: The unique hardware address of the device's network interface card (NIC).
- Manufacturer: (Optional) The manufacturer of the device based on the MAC address prefix (if available in a database).
- Interface: The name of the OPNsense interface to which the device is connected.
- Hostname: (Optional) The hostname of the device, if available from DHCP leases.
The ARP table is dynamic and automatically updates as devices connect and disconnect from the network. You can use the search bar to filter entries based on specific IP addresses, MAC addresses, or hostnames (if available). Remember that the manufacturer information based on MAC addresses might not always be accurate or complete.
What is the aim of Utilizing the ARP Table?
You may utilize the ARP Table on your OPNsense for the following purposes:
- Identifying Devices: Use the table to map IP addresses to their corresponding MAC addresses and potentially identify the devices connected to your network.
- Troubleshooting Connectivity Issues: If you're facing connectivity problems with specific devices, check their entries in the ARP table. Missing entries or inconsistencies might indicate issues with device communication or network configuration.
- Network Security Monitoring: Monitor the ARP table for unexpected or unauthorized devices appearing on your network, potentially indicating security concerns.
- Configuring Static ARP Entries: You can configure static ARP entries to manually associate specific IP addresses with known MAC addresses, ensuring consistent mapping and potentially improving network performance in certain scenarios.
By effectively utilizing the ARP Table on OPNsense, you gain valuable insights into your network's connected devices, enabling you to troubleshoot connectivity issues, monitor for potential security risks, and manage your network environment efficiently.
DNS Lookup
The OPNsense DNS Lookup tool allows for quick domain name resolution. DNS Lookup tool allows you to verify the functionality of your DNS server and troubleshoot potential resolution issues. You may use the DNS Lookup tool by following the next steps:
- Navigate to Interfaces → Diagnostics → DNS Lookup on OPNsense web UI.
- Enter the hostname you want to resolve (e.g.,
google.com) in the Hostname or IP field. - You can optionally specify a Server address if you want to use a specific DNS server for the lookup. Otherwise, the default configured DNS servers will be used.
- Click the Apply button.
You should see the following information:
- Hostname: The entered hostname.
- Response Type: The type of record returned (e.g., A for IP address, AAAA for IPv6 address).
- Address: The resolved IP address(es) associated with the hostname.
- Server: The DNS server that provided the response.
- Resolution Time: The time taken to resolve the hostname.
The expected successful outcome looks similar to the below:
Hostname:  www.google.com
Response  Type:  A
Address:  142.251.214.142
Server:  8.8.8.8
Resolution  time:  20  ms
This indicates that the hostname www.google.com successfully resolves to the IP address 142.251.214.142 with a resolution time of 20 milliseconds, using the default DNS server (8.8.8.8).
You will see an error message indicating the reason for the failure (e.g., "Name not found") for unsuccessful DNS Lookup queries.
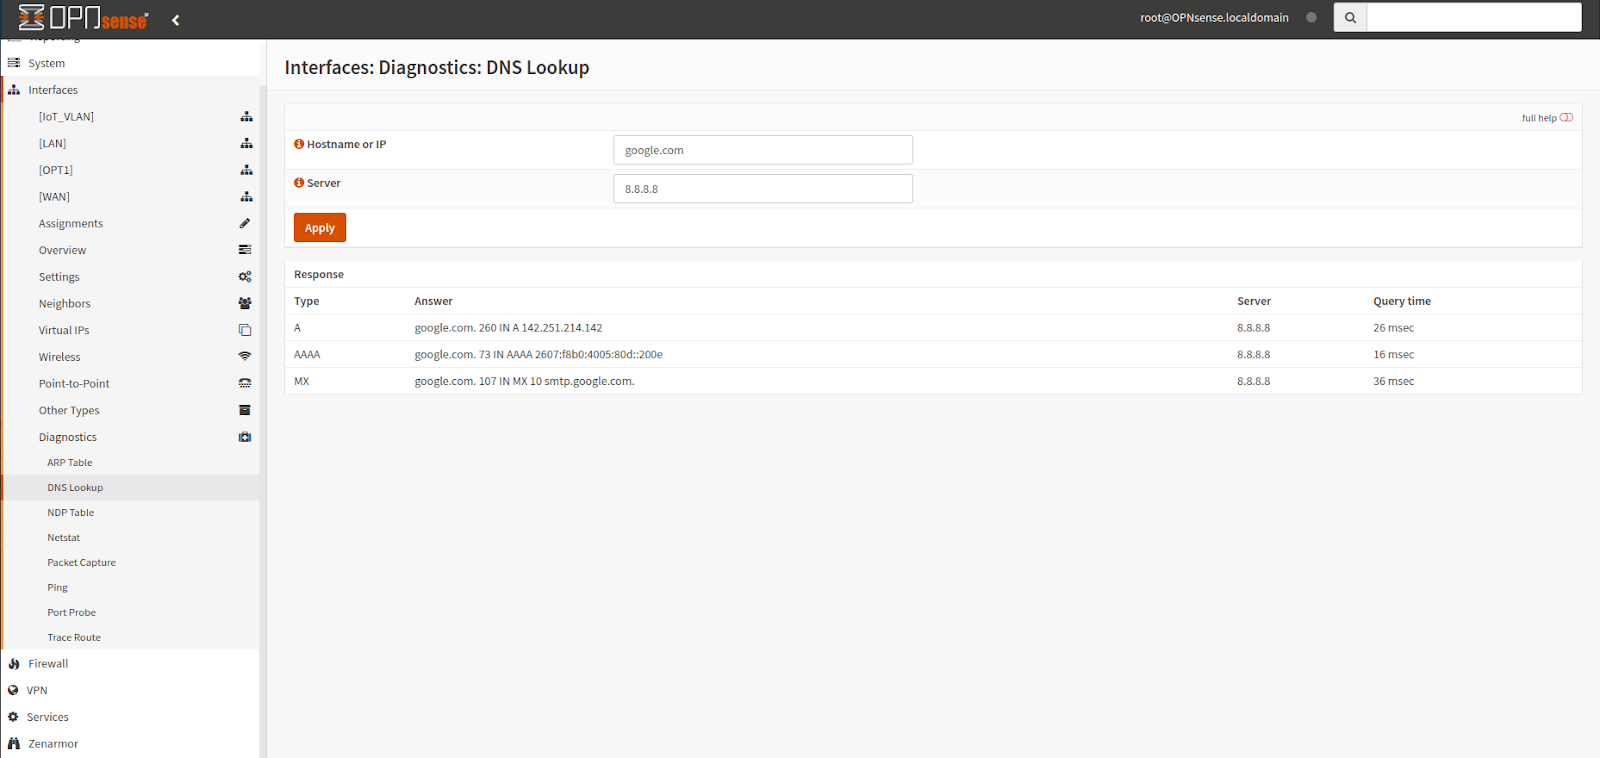
Figure 7. OPNsense Interface diagnostics via DNS Lookup
Some DNS Lookup troubleshooting tips are given below:
- If the lookup fails, try using a different DNS server address in the Server field.
- Verify your DNS server configuration in Services → Unbound DNS.
- Check your internet connectivity and ensure your firewall rules are not blocking DNS traffic.
By effectively using the DNS Lookup tool, you can diagnose and resolve DNS-related issues on your OPNsense environment, ensuring smooth internet access for connected devices.
NDP Table
The NDP (Neighbor Discovery Protocol) Table displays information about IPv6 neighboring devices on your network. Similar to the ARP table for IPv4, it shows the IPv6 address, MAC address, manufacturer (if available), associated interface, and interface name for each neighboring device. This information aids in identifying and managing IPv6-enabled devices connected to your network.
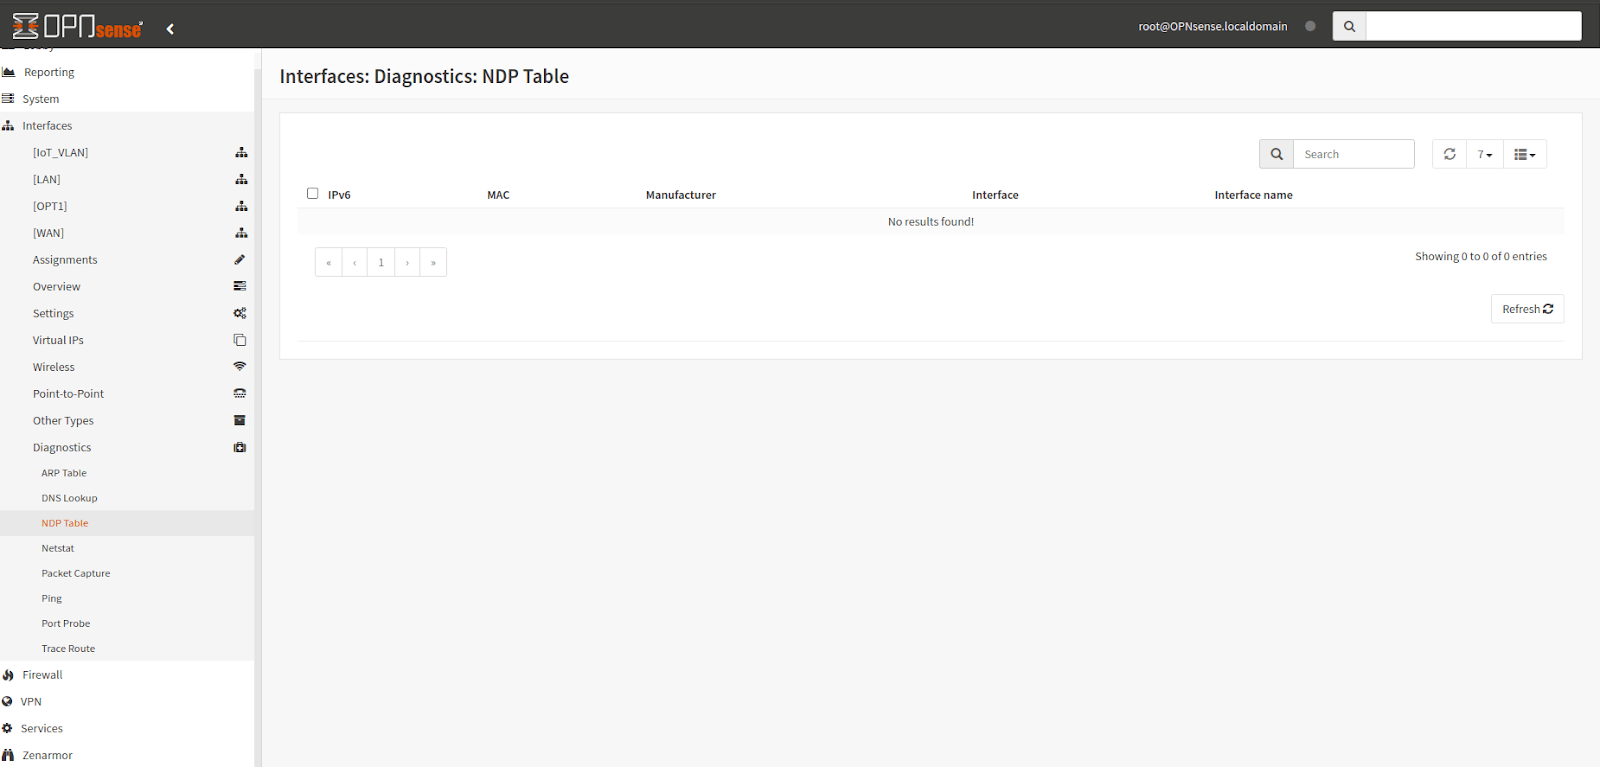
Figure 8. OPNsense Interface Diagnostics via NDP Table
The NDP table is dynamic and updates as IPv6 devices connect and disconnect. You can use the search bar to filter entries based on specific IPv6 addresses or MAC addresses (if available). Remember that the manufacturer information based on MAC addresses might not always be accurate or complete.
What is the aim of Utilizing the NDP Table?
You may utilize the NDP Table on your OPNsense for the following purposes:
- If you're experiencing issues with IPv6 connectivity, the NDP table can still be helpful for troubleshooting.
- Look for inconsistencies or missing entries for devices you expect to be communicating via IPv6.
- Ensure your network devices and applications are configured to use IPv6 correctly if necessary.
By understanding the NDP table and its limitations, you can effectively utilize it alongside other diagnostic tools to troubleshoot potential issues and maintain a healthy network environment in your OPNsense setup.
Netstat
The Interfaces → Diagnostics → Netstat module in OPNsense provides various sections offering insights into network traffic and resource utilization. While Netstat in OPNsense doesn't provide a single consolidated view like traditional tools, understanding each section's purpose and interpreting the displayed information empowers you to:
- Gain insights into network traffic patterns and resource utilization.
- Identify potential bottlenecks, errors, or unexpected activities related to network communication.
- Troubleshoot specific issues related to individual interfaces, protocols, or network connections.
Here's a breakdown of each section and its potential use for Netstat diagnostics:
-
Bpf: This section allows capturing live network traffic on specific interfaces using Berkeley Packet Filter (BPF) expressions. Show statistics about bpf(4) peers. This includes information like how many packets have been matched, dropped, and received by the bpf device, as well as information about current buffer sizes and device states. It can be valuable for capturing and analyzing network packets for deeper troubleshooting purposes.
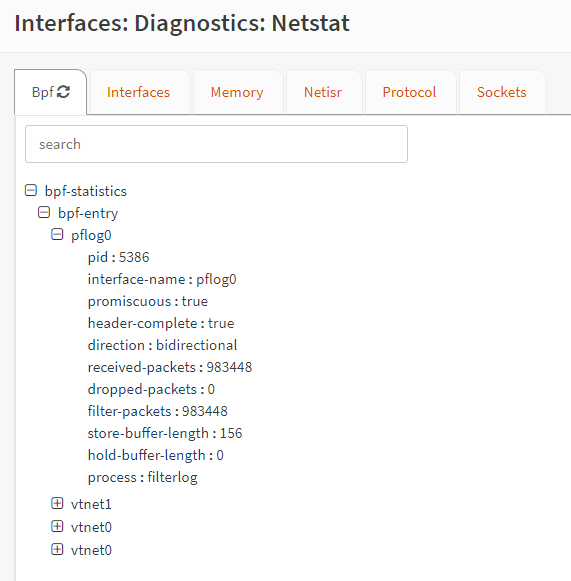
Figure 9. OPNsense Interface Diagnostics via Bpf Netstat
-
Interfaces: This section displays statistics and information about each network interface on your OPNsense firewall. Netstat Interfaces page shows the following details:
- Status: Whether the interface is up or down.
- IP address and subnet mask: Assigned IP configuration.
- Packets transmitted and received: Traffic statistics for the interface.
- Errors and dropped packets: Potential issues encountered during communication.
You may analyze these statistics to identify potential problems like high error rates, excessive traffic on specific interfaces, or interface failures.
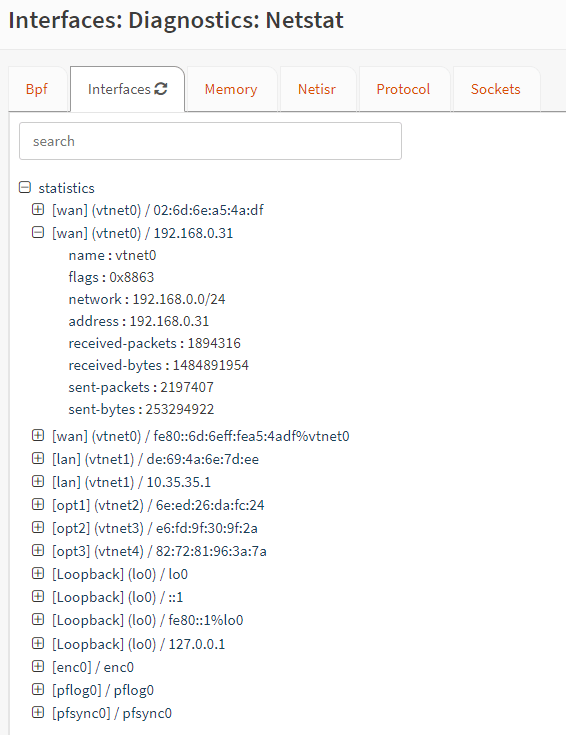
Figure 10. OPNsense Interface Diagnostics via Interfaces Netstat
-
Memory: This section provides information about memory usage related to network operations. Netstat Memory page shows the following details:
- Allocated memory: Amount of memory used by network-related processes and structures.
- Socket memory: Memory consumption specifically for network sockets.
You may monitor memory usage in this section to identify potential bottlenecks or resource constraints impacting network performance.
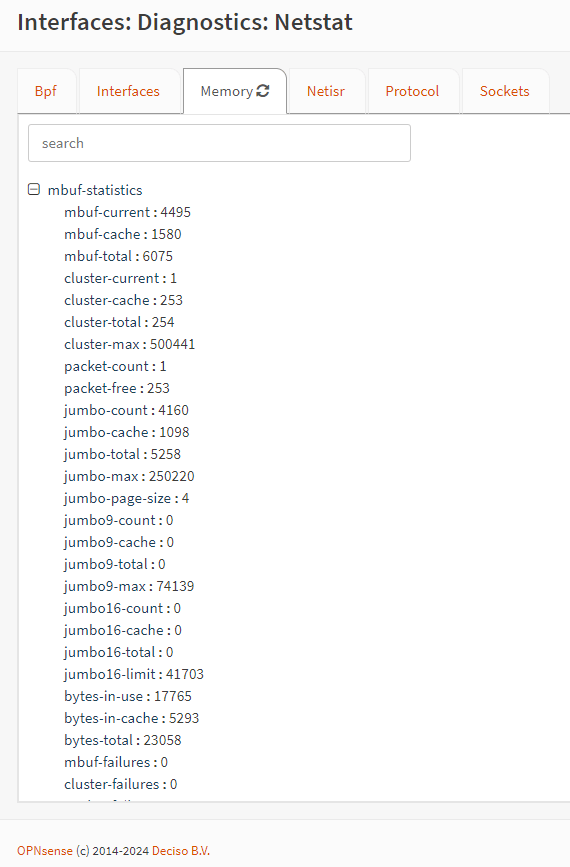
Figure 11. OPNsense Interface Diagnostics via Memory Netstat
-
Netisr: This section offers insights into the Network Interrupt Service Routine (Netisr), a kernel component handling network traffic interrupts. Netstat Netisr page shows the following statistics:
- Queues: Number of queues used for processing network traffic.
- Packets: Number of packets handled by each queue.
- Drops: Number of packets dropped due to various reasons.
You may analyze Netisr statistics to identify potential issues with network interrupt handling, which might indicate performance bottlenecks or resource limitations.
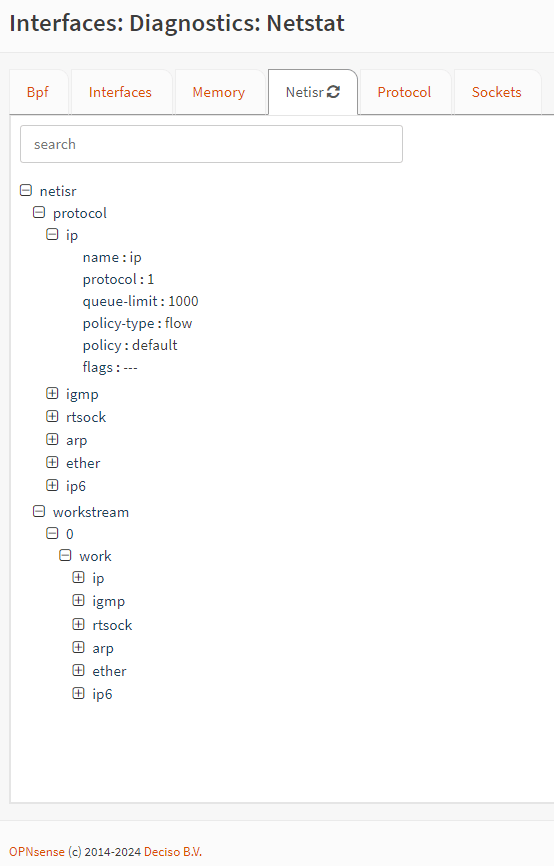
Figure 12. OPNsense Interface Diagnostics via Netisr Netstat
-
Protocol: This section displays information about various network protocols and their corresponding statistics. Netstat Protocol page shows the following details:
- Protocol name: e.g., TCP, UDP, ICMP.
- Packets transmitted and received: Traffic statistics for each protocol.
- Errors: Number of errors encountered during communication for each protocol.
You may analyze protocol statistics to identify potential issues specific to certain protocols, helping you isolate problems related to specific network services or applications.
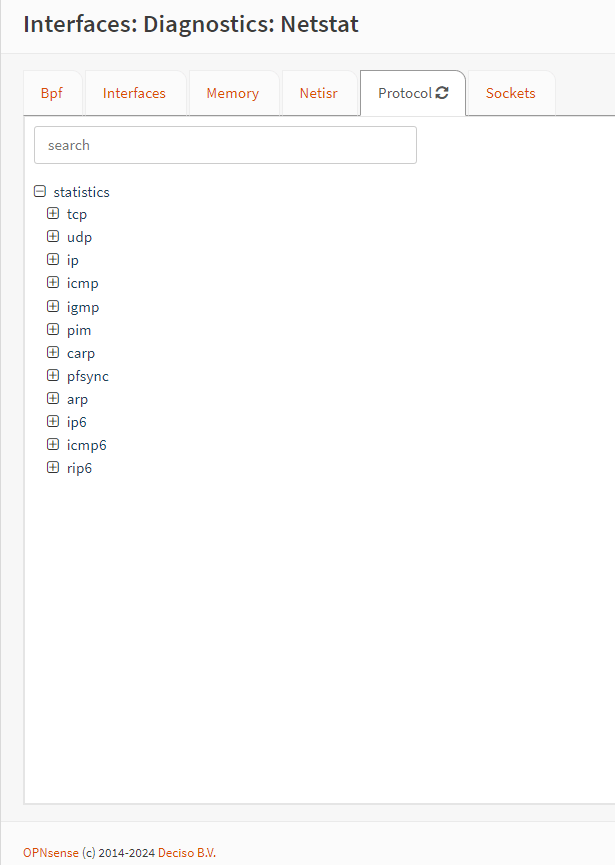
Figure 13. OPNsense Interface Diagnostics via Protocol Netstat
-
Sockets: This section displays information about active network sockets on your OPNsense system. Netstat Sockets page shows the following details:
- Local and remote addresses and ports: Involved parties in the communication.
- Protocol: Protocol used for the connection (TCP, UDP, etc.).
- State: Current state of the socket connection (e.g., established, listening, closing).
You may analyze socket information to identify established connections and their corresponding applications or services or to investigate potential issues like connection leaks or unexpected connections.
Packet Capture
The Packet Capture feature on OPNsense allows you to capture network traffic on specific interfaces for troubleshooting and analysis.
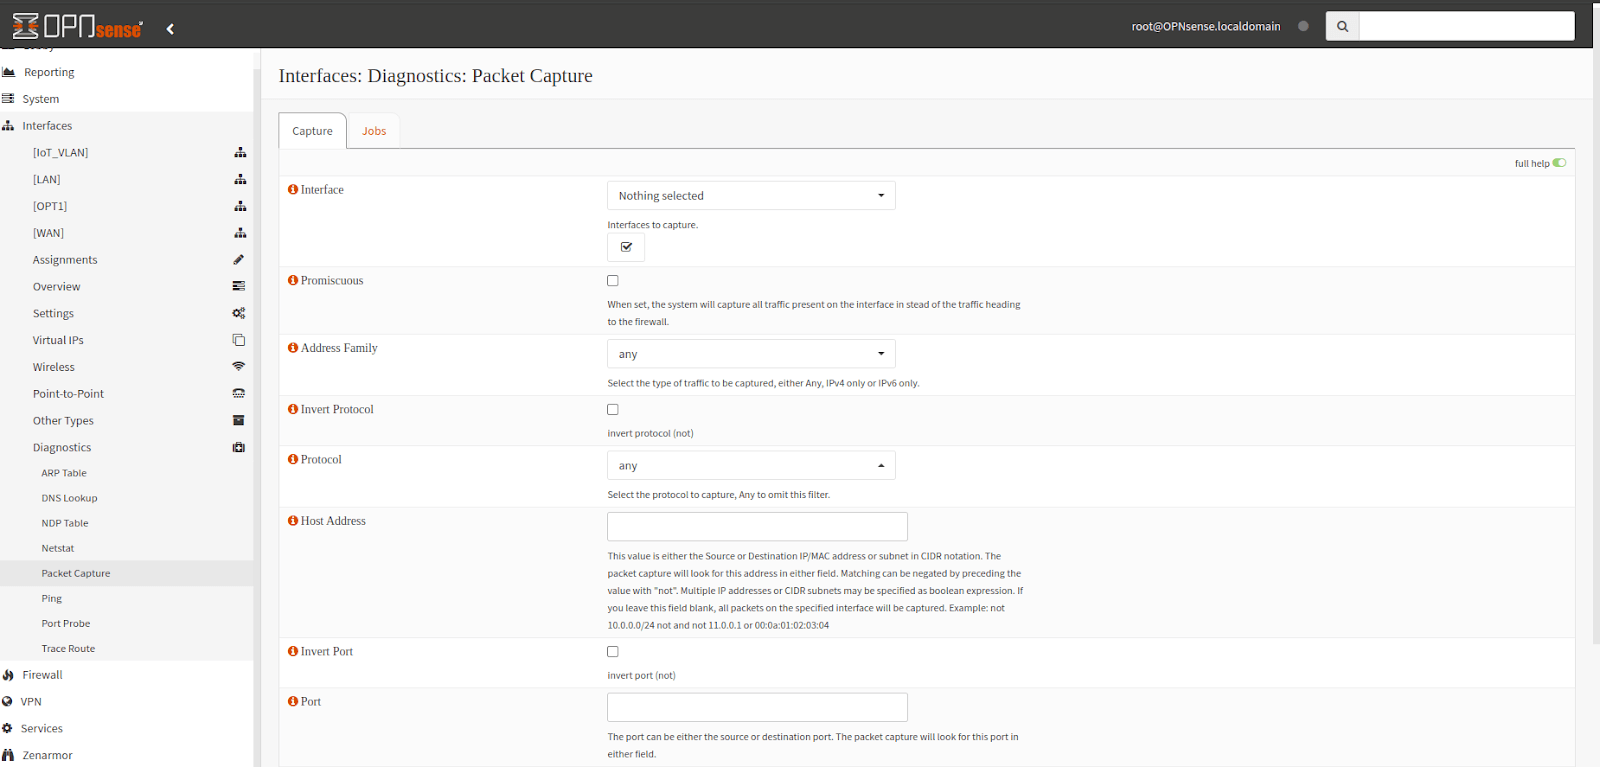
Figure 14. OPNsense Interface Diagnostics via Packet Capture
You may use Packet Capture on OPNsense by following the next steps:
-
Navigate to Interfaces → Diagnostics → Packet Capture on OPNsense web UI.
-
Choose the interface you want to capture traffic from using the Interface dropdown menu. This could be your WAN, LAN, or any other available interface.
-
You may enable Promiscuous option to capture all traffic on the interface, including traffic not destined for the firewall itself. This can be helpful for capturing communication between devices on your network, but be cautious as it captures a larger volume of data.
-
Select the type of traffic you want to capture from the Address Family drop-down menu. The following options are available:
- Any: Capture both IPv4 and IPv6 traffic.
- IPv4 Only: Capture only IPv4 traffic.
- IPv6 Only: Capture only IPv6 traffic.
-
You may enable Invert Protocol to capture packets that don't match the selected protocol(s).
-
Choose specific Protocols to capture (e.g., TCP, UDP, ICMP). Leaving it as "any" captures all protocols.
-
Specify Host Address by typing IP addresses, MAC addresses, or subnets to filter captured packets based on source or destination. This value represents either the Source or Destination IP/MAC address or subnet in CIDR notation. The packet capture will search for this address in both fields. To negate a match, add "not" before the value. Boolean expressions can include several IP addresses or CIDR subnets. Leaving this parameter blank will result in capturing all packets on the specified interface.
-
You may enable Invert Port to capture packets that don't match the specified port(s).
-
Enter specific Port numbers to capture traffic on those ports. It can be either the source or destination port. Leaving it blank captures all ports.
-
Define the maximum number of bytes to capture for each packet in Packet Length field. 0 captures the entire frame.
-
Set the number of packets to capture in Count option. 0 captures continuously until stopped manually.
-
Add a Description for the capture job for easier identification later.
-
Click the Start button to begin capturing packets.
After the capture is complete, you can view the captured packets in the Jobs tab. You can download the captured data in pcap format for further analysis using external tools like Wireshark.
What are the Tips for Packet Capturing on OPNsense?
Some helpful Tips for Packet Capturing on OPNsense are as follows:
- Capturing large amounts of traffic can consume significant disk space and resources.
- Be mindful of the filtering options to avoid capturing unnecessary data and focus on the specific traffic you need to analyze.
- Utilize external tools like Wireshark to decode and inspect the captured packets for detailed insights into network communication and troubleshooting purposes.
What are the Benefits of Packet Capture on OPNsense?
By effectively utilizing the Packet Capture feature in OPNsense, network administrators can unlock a plethora of valuable insights into network activity, connectivity issues, security threats, and overall network health. This powerful tool allows for the capturing and analysis of network traffic in real-time or based on predefined filters, enabling administrators to pinpoint and diagnose various network-related problems with precision.
First and foremost, the Packet Capture feature serves as a vital diagnostic tool, providing administrators with detailed visibility into network activity. By capturing and analyzing packets traversing the network, administrators can identify the source and destination of traffic, protocol usage, bandwidth utilization, and patterns of communication between devices. This granular level of insight is invaluable for troubleshooting connectivity issues, diagnosing performance bottlenecks, and optimizing network resources.
Moreover, Packet Capture plays a crucial role in identifying and mitigating security threats within the network. By monitoring network traffic for suspicious or malicious activity, administrators can detect potential threats such as unauthorized access attempts, malware infections, data exfiltration, and denial-of-service attacks. This proactive approach to security empowers organizations to swiftly respond to emerging threats, minimize the impact of security incidents, and protect sensitive data from unauthorized access or compromise.
Additionally, the Packet Capture feature facilitates the troubleshooting of various network-related problems, ranging from configuration errors to protocol issues. Administrators can capture packets related to specific network services, applications, or devices, allowing them to analyze communication patterns, detect anomalies, and pinpoint the root cause of issues affecting network performance or functionality. Whether troubleshooting connectivity issues, application latency, or network congestion, Packet Capture provides the necessary visibility and data to expedite problem resolution and ensure optimal network operation.
The Packet Capture feature in OPNsense is a versatile and indispensable tool for network administrators, offering unparalleled visibility into network activity, security threats, and performance issues. By harnessing the capabilities of Packet Capture, organizations can enhance network troubleshooting efforts, fortify cybersecurity defenses, and maintain the integrity and reliability of their network infrastructure.
Ping
The Ping tool in OPNsense allows you to test basic connectivity to a specific host by sending and receiving ICMP echo requests and replies.
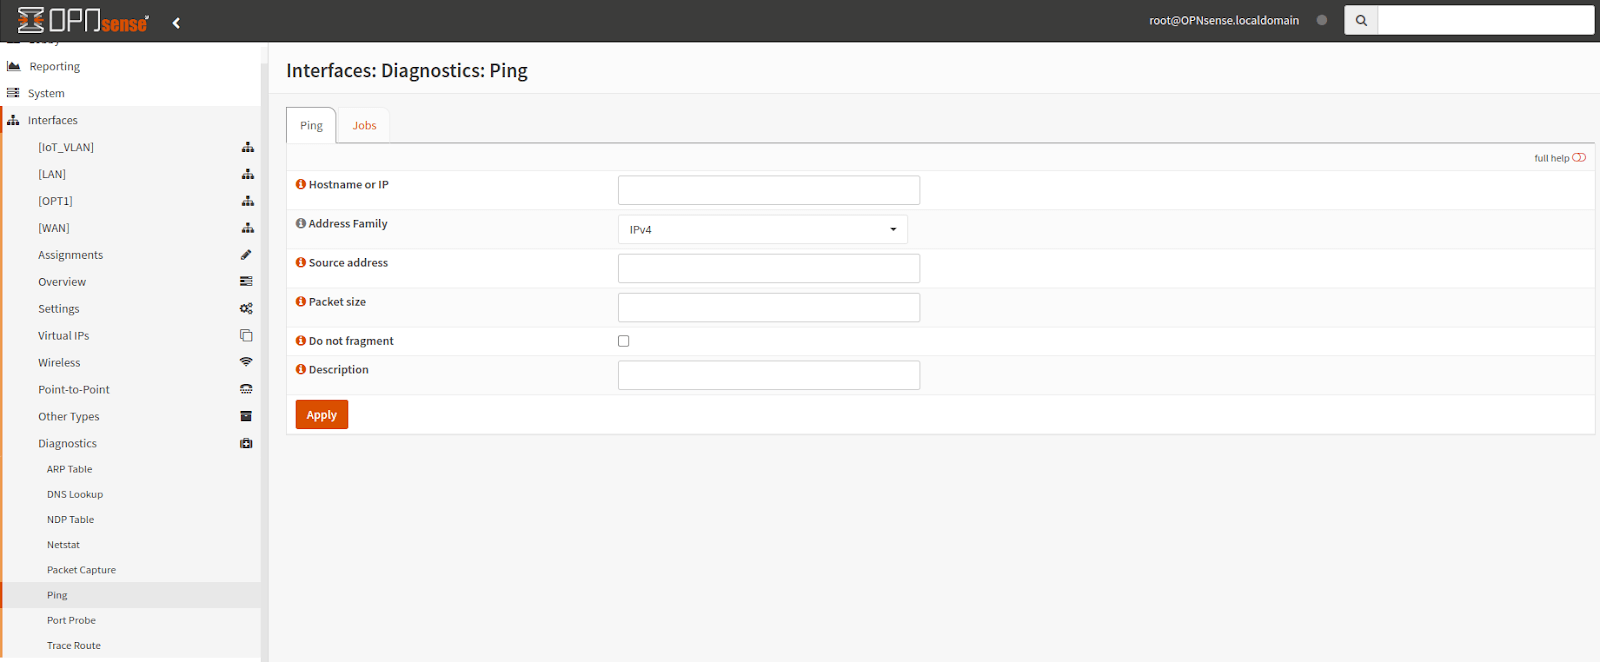
Figure 15. OPNsense Diagnostics via Ping
You may access the Ping Tool on OPNsense, by following the steps:
- Go to Interfaces → Diagnostics → Ping on the OPNsense web interface.
- Enter the hostname or IP address you want to ping in Hostname or IP field.
- Optionally you may choose Address Family. By default, IPv4 is selected. Choose IPv6 if you want to ping an IPv6 address.
- Optionally you may set up Source Address you want to use as the source for the ping request if needed.
- You may Specify the number of data bytes to be sent in Packet Sizefield. The default is 64 bytes.
- You may click "Do not fragment" option to disable fragmentation. It can be helpful to test the maximum packet size a network can handle.
- Add a Description to identify this specific ping job in the "Jobs" tab.
- Click Apply to initiate the ping test.
The results will be displayed in the Jobs tab, showing the number of packets sent, received, and lost, along with the minimum, average, and maximum round-trip times (RTT) in milliseconds.
Port Probe
The Port Probe tool in OPNsense allows you to perform a basic connectivity test to a specific port on a remote host. This tool attempts to establish a TCP connection with a specified host on a chosen port. It does not work for UDP ports as there's no reliable way to determine if they accept connections this way. No data is transmitted to the remote host during the test.
Combine the Port Probe with other diagnostic tools like ping and traceroute for a more comprehensive understanding of potential network connectivity issues.
By effectively utilizing the Port Probe tool in conjunction with other diagnostic techniques, you can gain valuable insights into network connectivity and troubleshoot potential issues related to remote hosts and specific services.
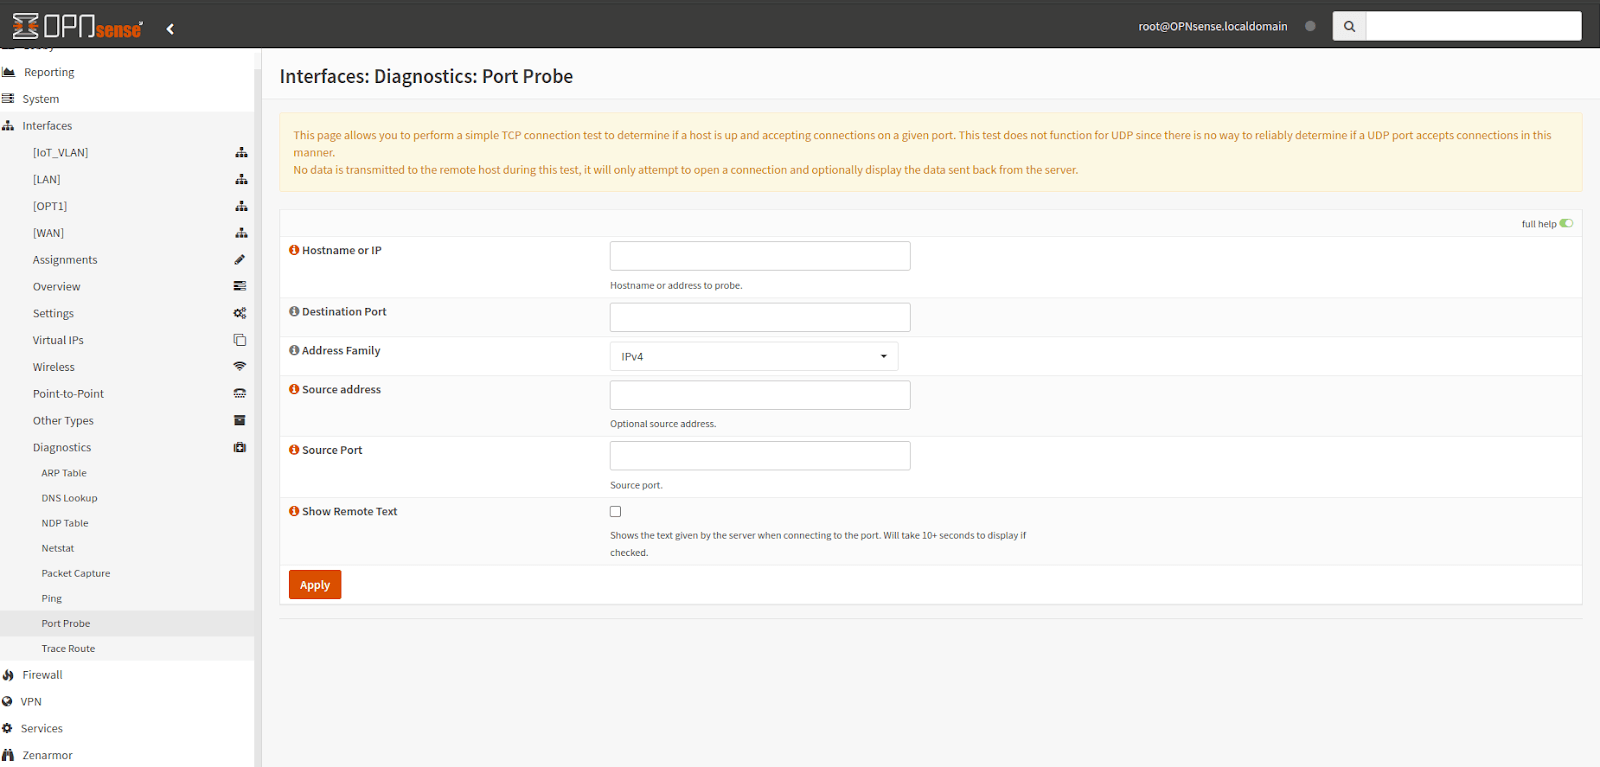
Figure 16. OPNsense Diagnostics via Port Probe
You may use the Port Probe Tool on OPNsense, by following the steps:
- Go to Interfaces → Diagnostics → Port Probe on the OPNsense web interface.
- Specify the Hostname or IP address of the remote host you want to test.
- Set Destination Port number you want to probe on the remote host.
- Select either IPv4 or IPv6 depending on the host's address type from Choose Address Family drop-down menu.
- You may specify a specific Source Address from your OPNsense firewall if needed.
- You may choose a Source Port for the outgoing connection (default is random).
- You may enable Show Remote Text option to display any text sent by the remote server upon connection (might take longer).
- Click Apply.
You'll see a message indicating "Connection established!", if the connection is established. You'll see an error message explaining the reason (e.g., "Connection timed out"), if the connection fails. The Port Probe only provides a basic indication of TCP connectivity on a specific port. It doesn't guarantee the functionality of the service running on that port or the overall health of the remote host.
Traceroute
The Traceroute tool in OPNsense helps you visualize the path packets take when traveling to a specific host. This information is crucial for troubleshooting network connectivity issues and identifying potential bottlenecks.
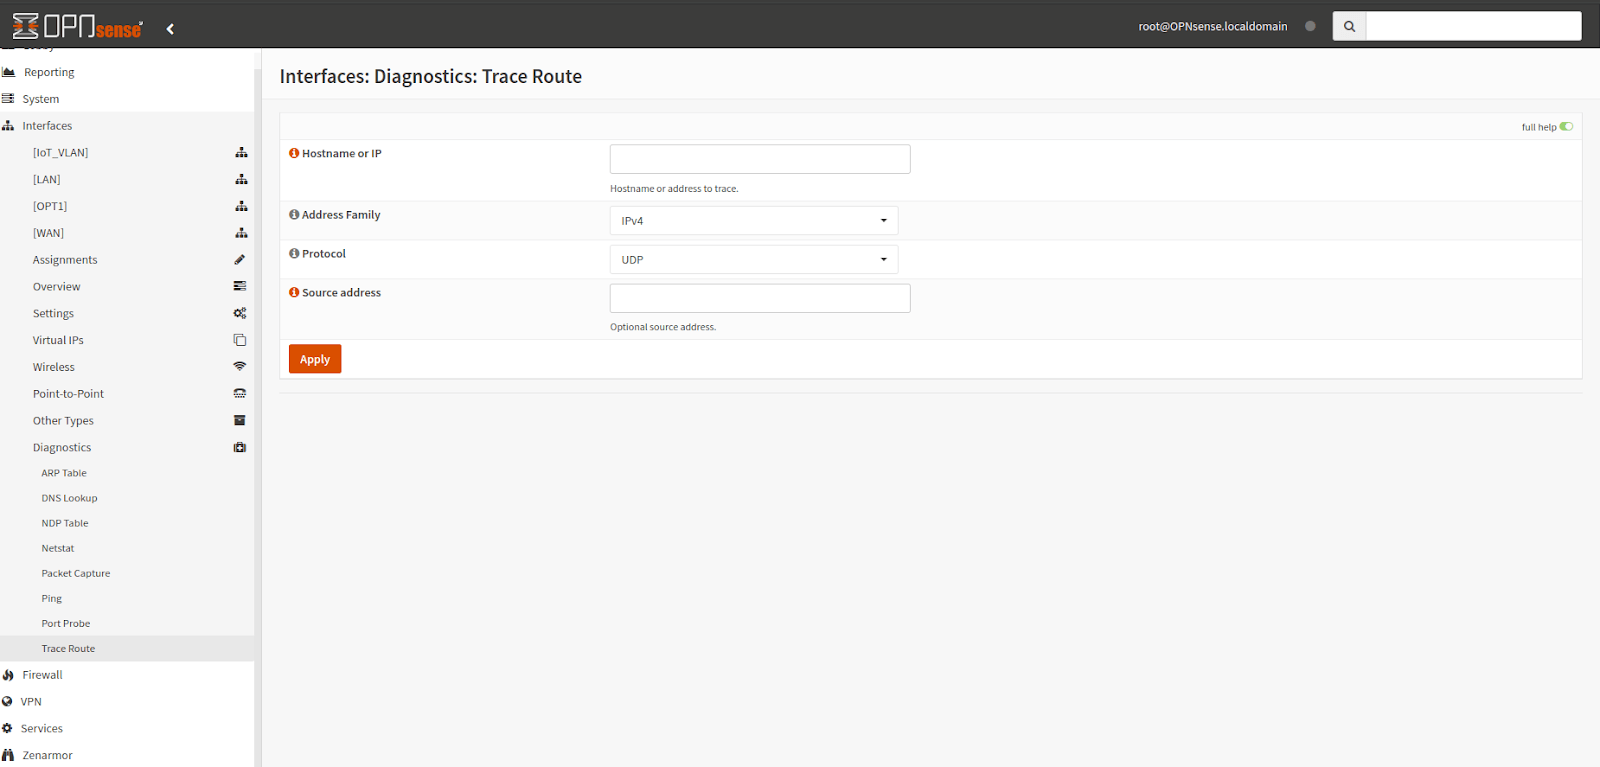
Figure 17. OPNsense Diagnostics via Traceroute
You may use the Traceroute tool on OPNsense, by following the steps:
- Go to Interfaces → Diagnostics → Traceroute on the OPNsense web interface.
- Enter the Hostname or IP address of the device you want to trace the route to.
- Select either IPv4 or IPv6 depending on the host's address type from Choose Address Family drop-down menu.
- Choose the Protocol for the traceroute:
- UDP: Commonly used for traceroute due to its simplicity.
- ICMP: Can be used if UDP is blocked by firewalls along the path.
- You may specify a specific Source address from your OPNsense firewall if needed.
- Click the Apply button to initiate the trace.
The results display a list of hops along the path, including:
- Hop number: Sequential number assigned to each hop.
- Hostname: (if available) Name of the device at that hop.
- IP address: IP address of the device at that hop.
- RTT (Round-trip time): Time taken for the probe to reach and return from each hop.
- Asterisks: Indicate timeouts or unreachable hops.
Traceroute only shows the path taken by packets and doesn't guarantee the functionality of specific services on the destination device. Interpret the results carefully, considering factors like potential load balancing or redundant paths that might affect the displayed route.
Why Do You Use Traceroute?
You may use traceroute tool on OPNsense for the following purposes:
- Identifying network path: Visualize the sequence of devices packets traverse to reach the destination.
- Troubleshooting connectivity issues: Locate potential problems like unreachable hops, high latency at specific points, or inefficient routing paths.
- Isolating network segments: Combine traceroute with ping to pinpoint where connectivity issues might be occurring along the network path.
By effectively utilizing the Trace Route tool in OPNsense, you can gain valuable insights into network connectivity and troubleshoot various network-related issues efficiently.
The results will show a list of hops between your network interface and the target, along with the response time for each hop (in milliseconds). If the intervening devices support it, you may see their hostnames thanks to the reverse lookup.
Remember, the results might vary depending on network conditions and configurations.
Firewall Diagnostics
The Firewall Diagnostics section in the OPNsense firewall menu offers various tools and information for troubleshooting network connectivity and firewall functionality. Here's an overview of each tool and its purpose:
Aliases
You may view Aliases diagnostics by navigating to the Firewall → Diagnostics → Aliases on OPNsense web UI. This page provides a detailed view of defined aliases (named groups of IP addresses or networks). It shows information like alias name, content (IP addresses/networks), and statistics (if enabled). It allows manual editing by adding, deleting, or finding references to specific addresses within aliases.
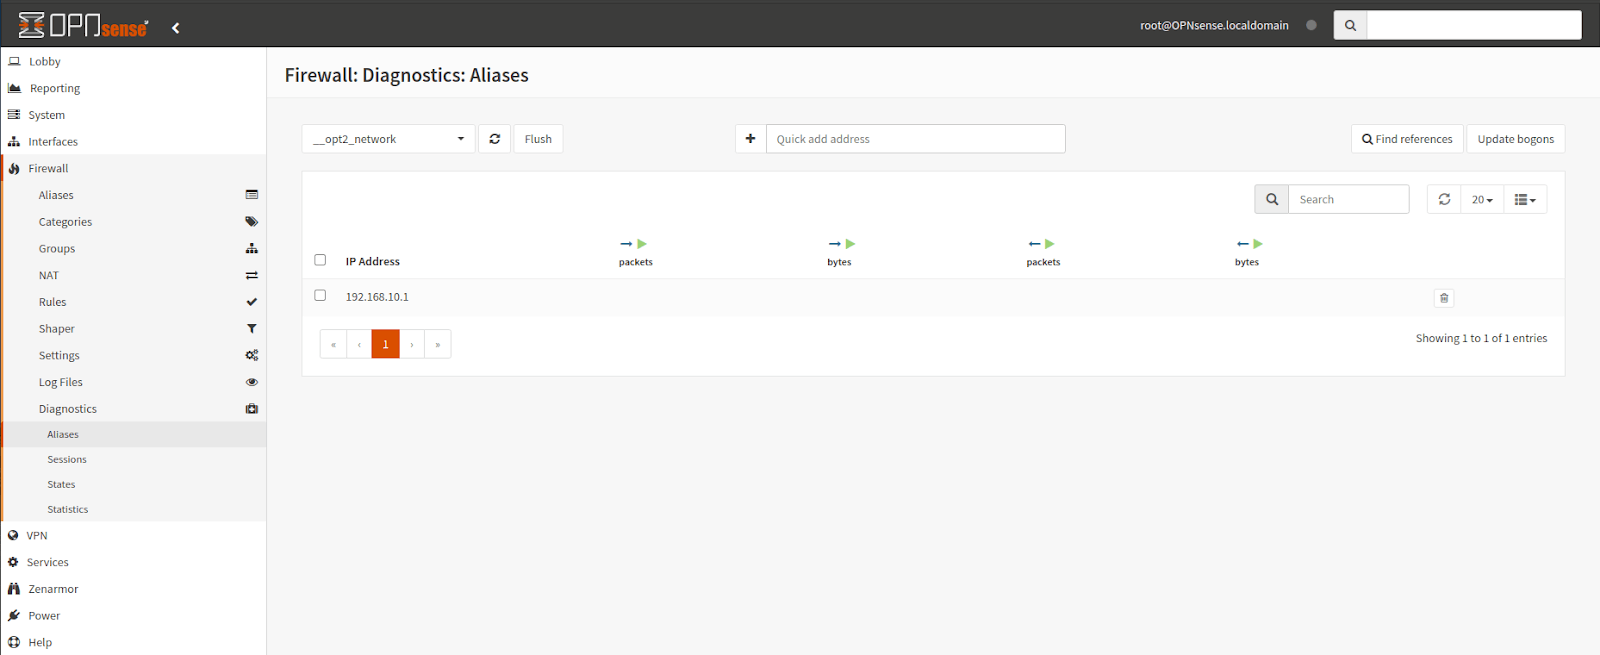
Figure 18. OPNsense Firewall Diagnostics via Aliases
Sessions
Firewall Diagnostics Sessions page utilizes the pftop tool to display real-time information about active network sessions. This page shows the following details:
- Direction (incoming/outgoing)
- Protocol used
- Source and destination addresses and ports
- Gateway used for NAT translation (if applicable)
- State of the session (e.g., established, closing)
- Age and expiration time of the session
- Packet and byte counters for the session
- Rule associated with the session (if applicable)
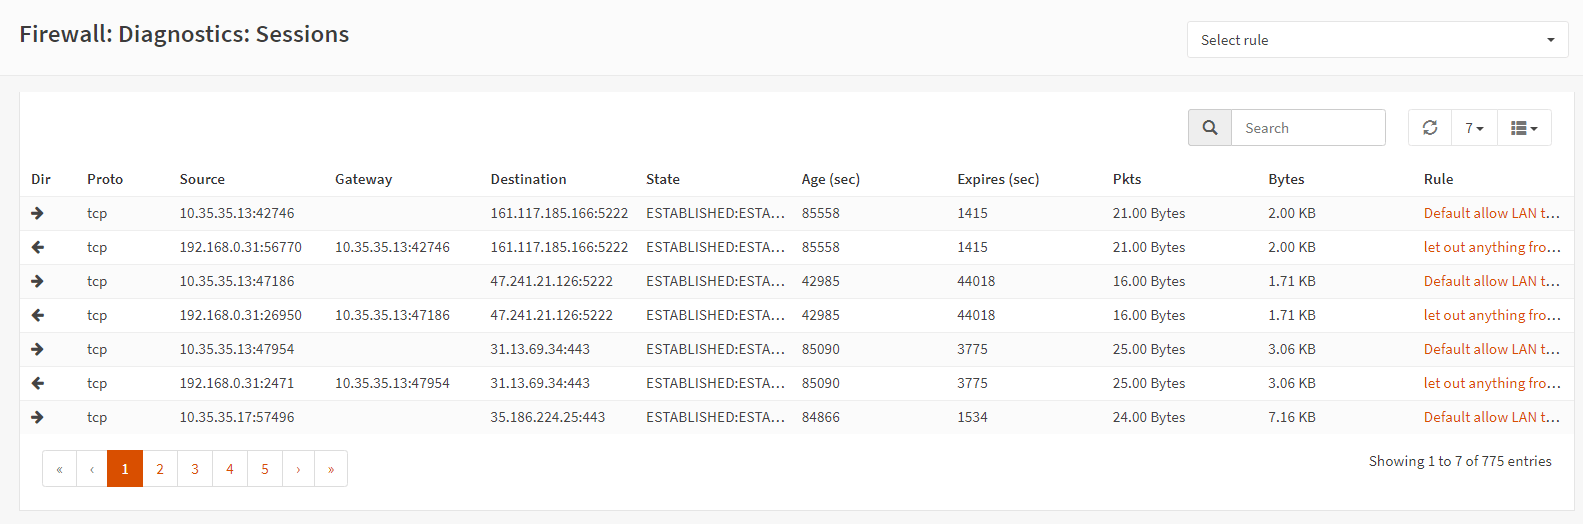
Figure 19. OPNsense Firewall Diagnostics via Sessions*
What is the aim of Utilizing the Firewall Sessions Diagnostics?
You may utilize the Firewall Diagnostics Sessions page on your OPNsense for the following purposes:
- Look for unexpected connections or missing entries corresponding to desired services.
- Identify potential bottlenecks by observing high packet counts or slow transfer rates for specific sessions.
- Filter traffic flows by source, destination, or port to isolate relevant connections.
- Compare observed traffic details with intended rule behavior.
- Identify missing sessions for expected traffic, indicating potential rule problems.
- Verify that established sessions align with the corresponding firewall rule's purpose.
States
Firewall Diagnostics States page Offers insights into the firewall's state table, which tracks active connections. It allows searching, viewing details, and even resetting the entire state table. Firewall Diagnostics States page displays the following details:
- State ID and origin
- Interface used
- Direction (incoming/outgoing)
- Protocol used
- Source and destination addresses and ports
- NAT translation information (if applicable)
- State of the connection (e.g., established, closing)
- Rule associated with the state (if possible)
- Option to drop individual states
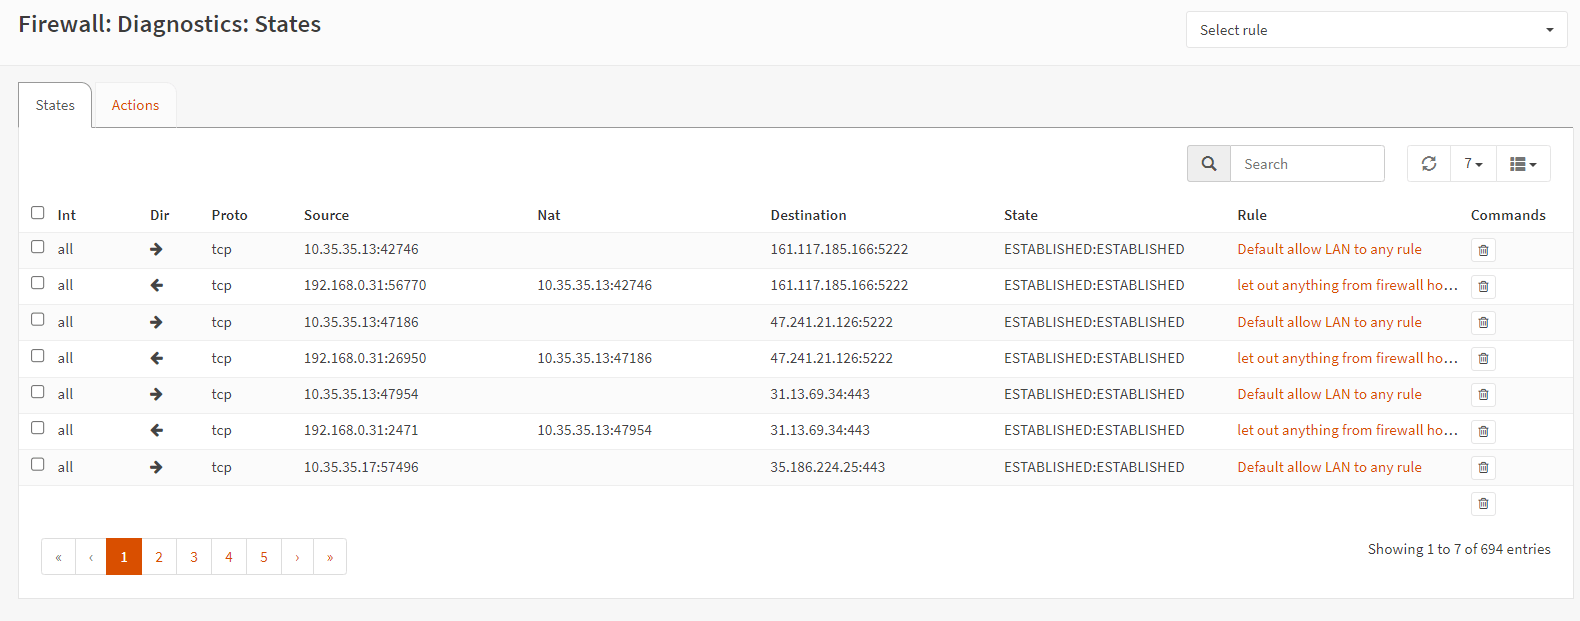
Figure 20. OPNsense Firewall Diagnostics via States
What is the aim of Utilizing the Firewall States Diagnostics?
You may utilize the Firewall Diagnostics States page on your OPNsense for the following purposes:
- To examine active connections and their states.
- Identify connections stuck in unexpected states (e.g., "FIN_WAIT_1" for a long time) indicating potential issues.
- Verify if connections are associated with the intended firewall rules.
- Reset the state table (use cautiously) under specific troubleshooting scenarios, but be aware it drops all active connections.
- To examine state correlation for debugging firewall rules
Statistics
Firewall Diagnostics Statistics page Gathers various detailed statistics related to the firewall operation. This page shows the following information:
- Packet counters per interface (incoming, outgoing, dropped)
- Memory usage and limits
- Configured timeouts for different operations
- List of active firewall rules with detailed information
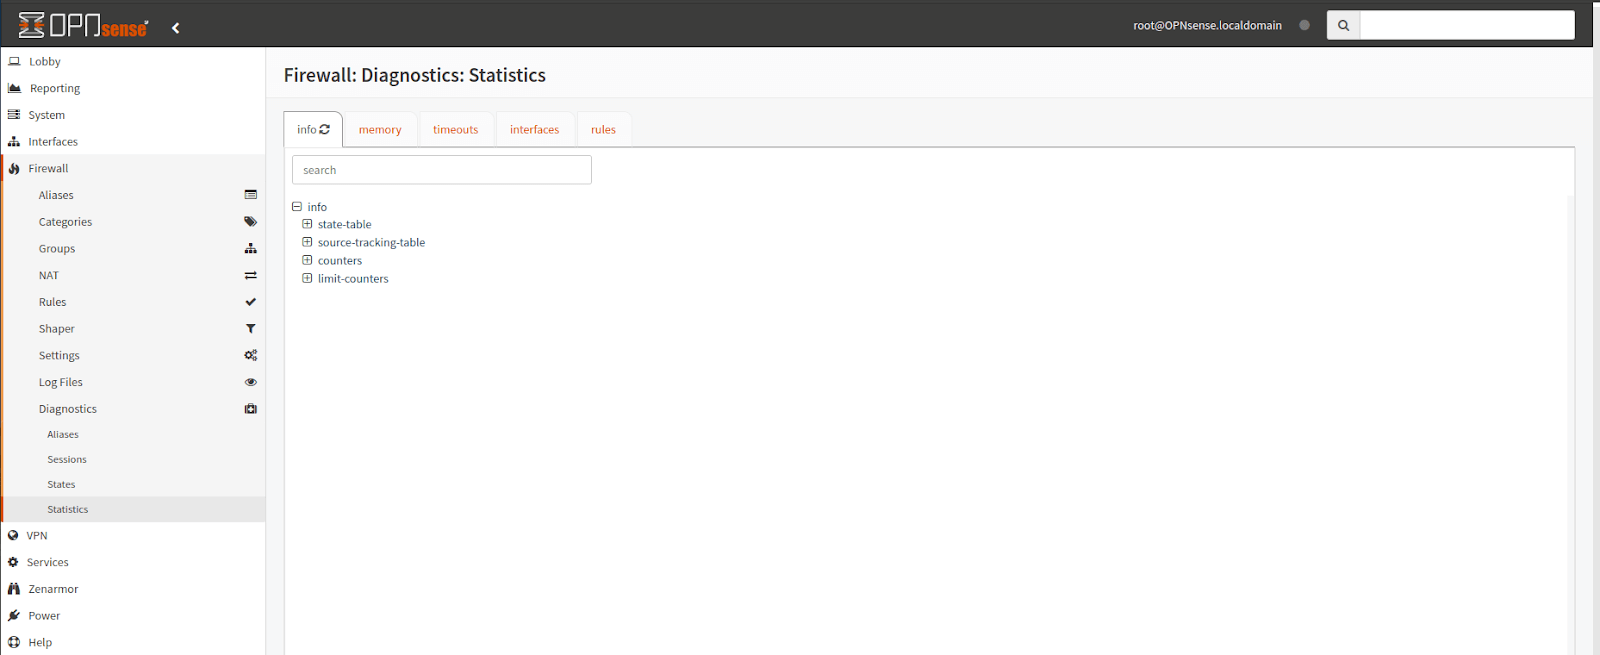
Figure 21. OPNsense Firewall Diagnostics via Statistics
What is the aim of Utilizing the Firewall Statistics Diagnostics?
You may utilize the Firewall Diagnostics Statistics page on your OPNsense for the following purposes:
- To monitor firewall performance
- To analyze packet counters per interface, such as Incoming, Outgoing, or Dropped.
- To identify unusually high traffic volumes on specific interfaces, potentially indicating network congestion or suspicious activity.
- To investigate high drop rates suggesting restrictive firewall rules or performance bottlenecks.
- To assess resource utilization
- To monitor memory usage and configured timeouts.
- To identify potential memory constraints impacting firewall performance.
- Adjust timeouts cautiously based on your specific network environment and troubleshooting needs.
By effectively utilizing the diagnostics tools in OPNsense, you can gain valuable insights into network activity, troubleshoot various network-related issues, and ensure your firewall operates optimally.
VPN Diagnostics
Virtual Private Networks (VPNs) provide a secure tunnel for your internet traffic, encrypting data and anonymizing your online activities. However, even with a well-configured VPN, unforeseen issues can arise. This is where VPN diagnostics come into play.
Diagnostics allow you to proactively monitor the health and functionality of your VPN connection, ensuring:
- Security: Verifying secure encryption and proper authentication protocols are in place.
- Reliability: Identifying connectivity issues, tunnel disruptions, or performance problems.
- Troubleshooting: Pinpointing configuration errors and addressing specific problems within your OPNsense setup.
WireGuard
OPNsense provides tools to help you diagnose and troubleshoot issues with your WireGuard setup. You may troubleshoot WireGuard on your OPNsense by navigating to VPN → WireGuard → Diagnostics. This section displays information about your configured Instances and Peers in separate tabs.
WireGuard Instances page represents your WireGuard server configurations with the following details.
- Last known handshake: Shows the timestamp of the last successful communication with the connected peer.
- Data exchange: Indicates the amount of data transferred through the tunnel in both directions.
- Interface (wgX) status: Indicates if the underlying interface (e.g., wg0, wg1) is up and running (depends on CARP configuration, if applicable).
WireGuard Peers page represents the connected devices within your WireGuard network. It displays Last known handshake showing the last successful communication timestamp.
You may view WireGuard Log File on OPNsense by navigating to VPN → WireGuard → Log File. This log file contains detailed information about WireGuard events and potential errors. You may start by checking the logs when encountering configuration or connectivity issues.
OpenVPN
Although OPNsense recommends transitioning to WireGuard for new VPN setups, OpenVPN remains available for legacy configurations.
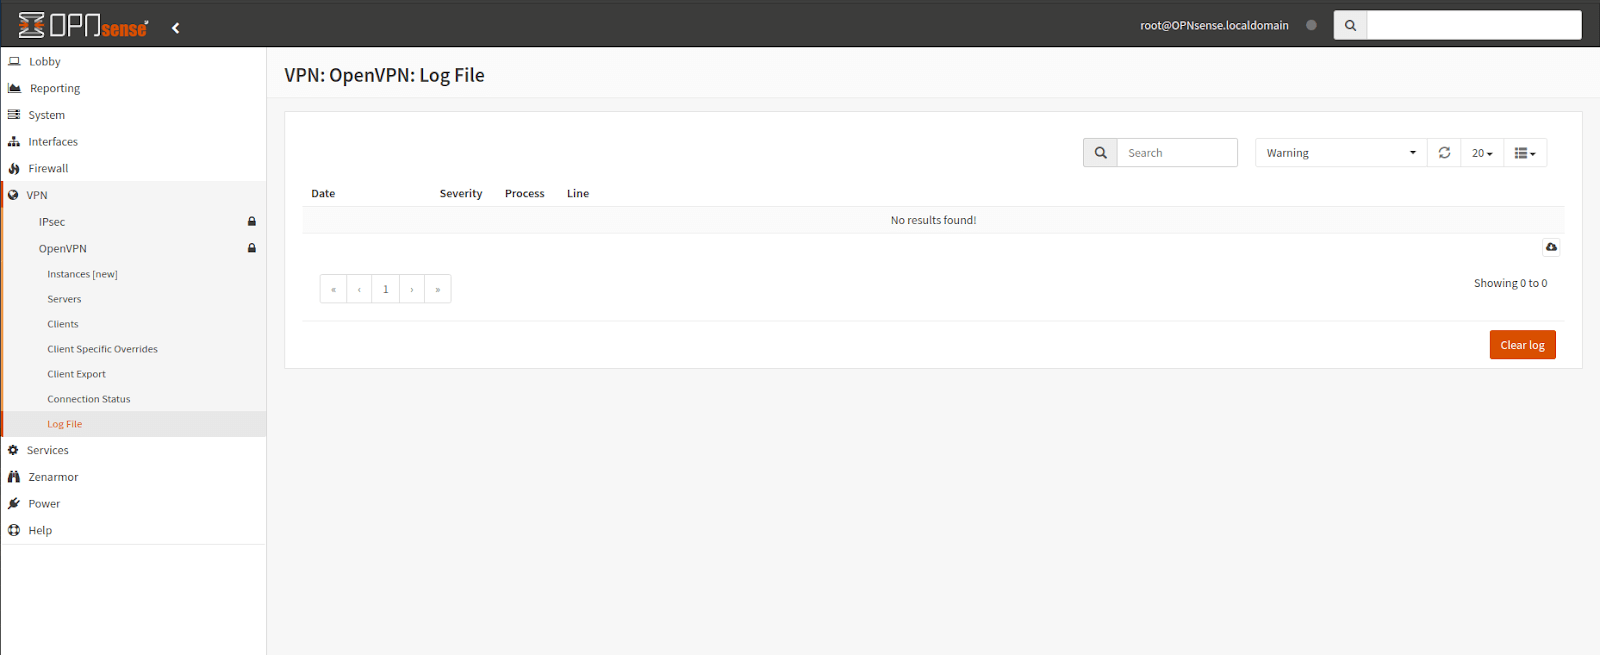
Figure 22. OPNsense OpenVPN Logs
You may view the OpenVPN Log file by navigating to VPN → OpenVPN → Log File.
Some OpenVPN troubleshooting tips are given below:
- Look for error messages related to connection attempts, configuration issues, or unexpected behavior in the log file.
- Double-check your OpenVPN server and/or client settings based on your setup type (Site-to-Site or Road Warrior).
- Ensure correct port usage (default: 1194 UDP), tunnel networks, firewall rules, and remote network specifications.
- Verify that the OpenVPN server is running and accessible.
- Check if firewall rules allow traffic on the OpenVPN port (1194 UDP) and the tunnel interface group (OpenVPN).
- Ensure the client device has a valid internet connection and can reach the server.
- If using certificates, verify their validity and proper configuration on both server and client for authentication issues.
- If using username/password authentication, ensure the correct credentials are entered by the client.
- If using overrides, check the logs for messages like "unable to write client config" or "overwrite not found" to identify mismatches.
- Verify your overrides match the client's X.509 common name (default matching) or username (if using specific settings).
- Ensure the virtual IP address (CARP) is properly configured for both server and client (if applicable) in a high availability environment and verify the client stops attempting to reconnect when not in "MASTER" mode (new instances).
By following these steps and using the available diagnostic tools, you should be able to identify and resolve the most common OpenVPN issues on your OPNsense firewall.
IPsec
Using the VPN → IPsec → Status Overview menu, you can view all of the configured IPsec tunnels and keep track of their connections. Status Overview section provides a clear view of all configured IPsec tunnels, including their current status (connected, disconnected, etc.), uptime, and other relevant information. This allows you to easily monitor the health and activity of your VPN connections.
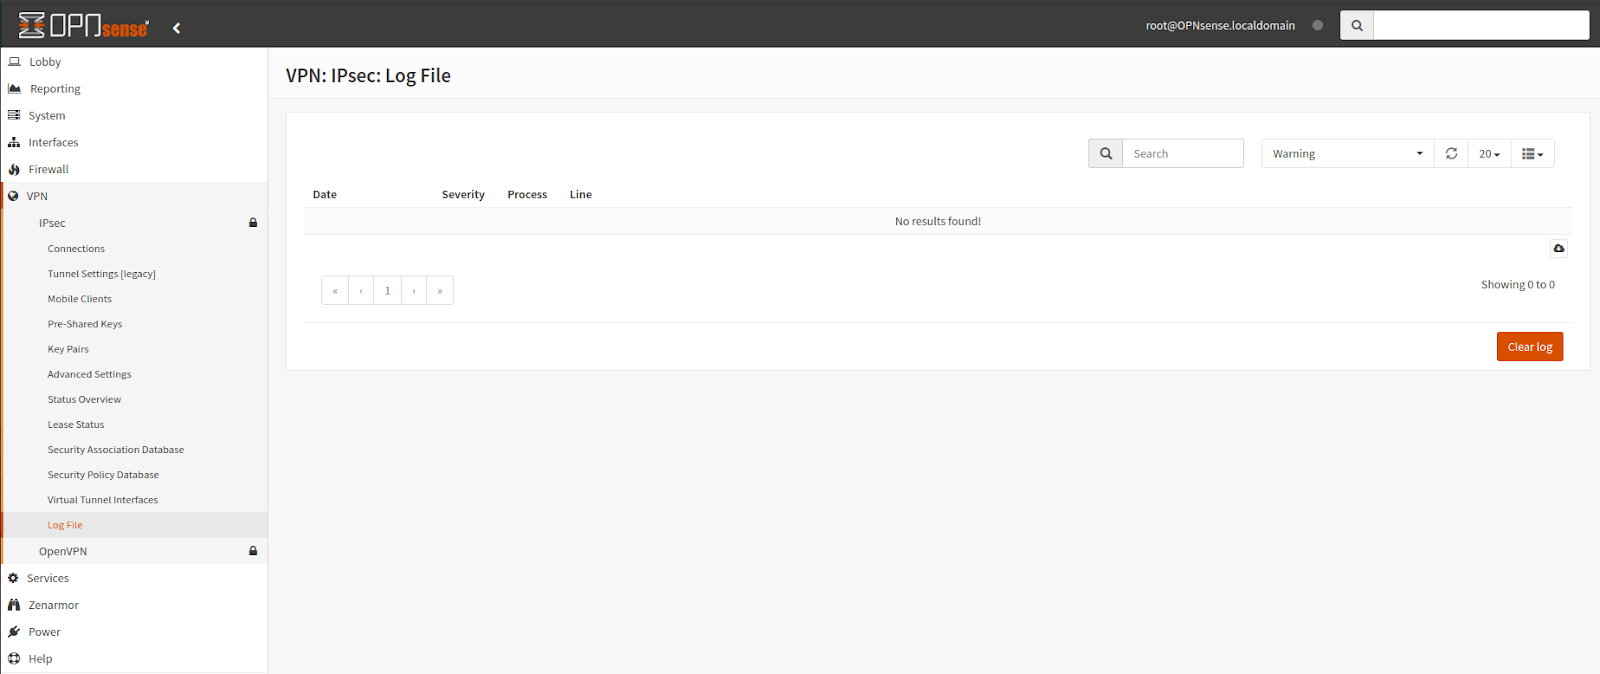
Figure 23. OPNsense IPSec Diagnostics
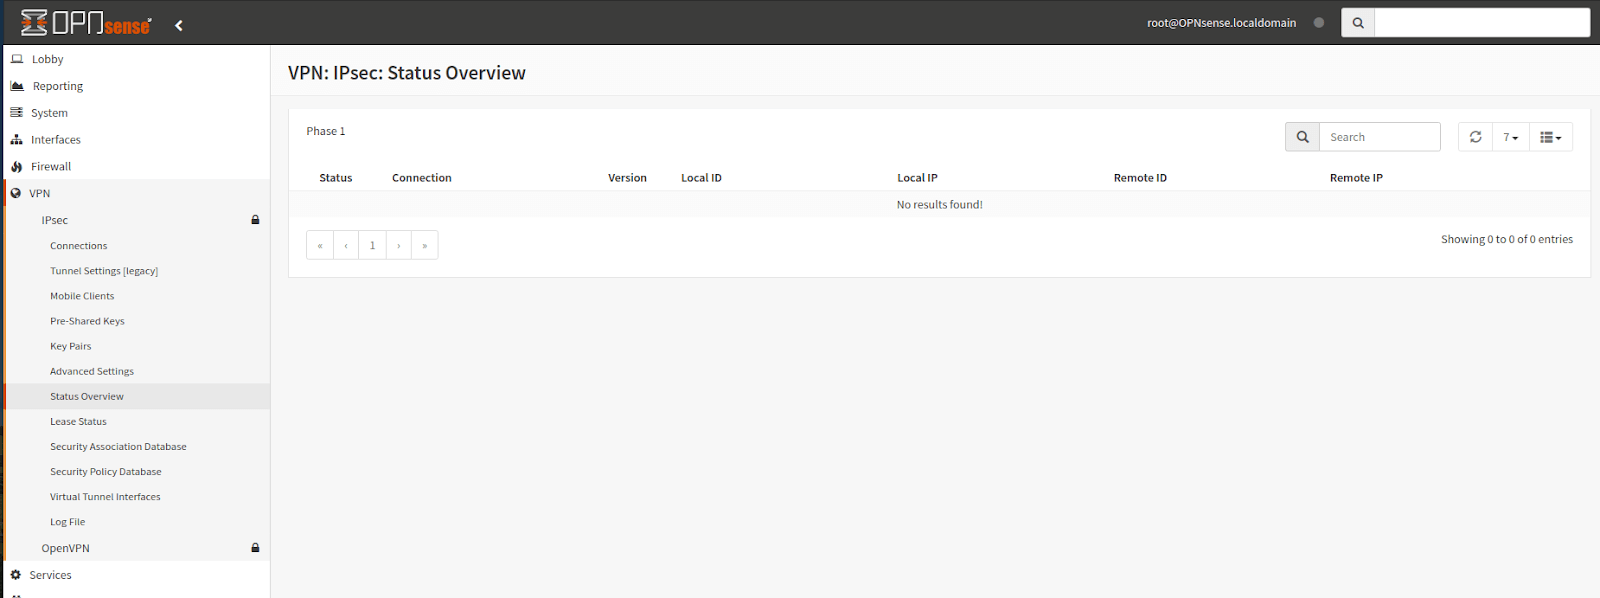
Figure 24. OPNsense IPsec Status Overview
IPsec Security Policy Database (SPD) offers detailed insights into the registered policies associated with your IPsec tunnels. IPsec Security Policy Database page includes the following information:
- Source and destination addresses: Specifies the allowed traffic flow between the connected networks.
- Protocols: Identifies the protocols permitted through the tunnel (e.g., TCP, UDP).
- NAT traversal: Indicates if Network Address Translation (NAT) is used for the tunnel and displays any additional SPD entries related to NAT.
By utilizing these features, you can effectively monitor and manage your IPsec VPN connections, ensuring secure and reliable communication between your networks.
OPNsense provides comprehensive logging capabilities for its IPsec tunnels, offering valuable insights for troubleshooting and monitoring your VPN connections. You may utilize IPsec Log feature for diagnostics by navigating to the VPN → IPsec → Log file:
The log file displays the following entries related to your IPsec tunnels:
- Timestamp: Date and time of the logged event.
- Severity level: Indicates the severity of the event (e.g., info, warning, error).
- Message: Provides a detailed description of the event, including:
- Tunnel name: The specific IPsec tunnel involved.
- Event type: Whether it's a connection attempt, authentication process, data transfer, or error message.
- Additional details: Specific information related to the event, such as error codes, packet details, or security policy references.
You may analyze the logs for Diagnostics by performing the following tasks:
- Identify relevant entries: Filter the log entries based on the timestamp, severity level, or specific keywords related to the issue you're facing.
- Interpret the message: Carefully analyze the details provided in each entry. Look for error messages, warnings, or unusual events that might indicate potential problems.
- Correlate entries: If encountering recurring issues, analyze multiple log entries across different timestamps to identify patterns or establish a timeline of events leading to the problem.
- Consult resources: Refer to the OPNsense documentation or online resources for specific guidance on interpreting error messages and troubleshooting common IPsec issues based on the information found in the logs.