Managing Notifications & Event Logs
Zenconsole (Centralized Cloud Management Portal) provides you the following 5 event log priorities on your firewalls.
-
Emergency: Extremely serious error events that caused the application to terminate. -
Critical: Serious error events that may cause the application to terminate. -
Error: Significant error events that will prevent normal program execution but may allow the application to continue running. -
Warning: End-users or system administrators may be interested in potentially harmful situations that indicate potential problems. -
Informational:End-user and system administrator-friendly informational messages that highlight the application's progress.
It also has customizable notification feature. Customizable notifications allow you to be notified of important Zenarmor events on your firewalls. Central notifications can be delivered through the Portal UI and/or via e-mail.
Figure 1. Notifications Button
Total number of new/unread notifications with the highest priority are always visible in different colors at the upper right corner of the notification button depending on the log priority. The following colors are used for the log priorities:
-
Purple: Emergency -
Red: Critical -
Orange: Error -
Yellow: Warning -
Blue: Informational
Viewing the Notifications
To view the notifications delivered via web UI (In-App), go to Portal Administration Bar and click the Notifications button with a Ring icon on the . This will redirect you to the Events & Logs → Notifications page.
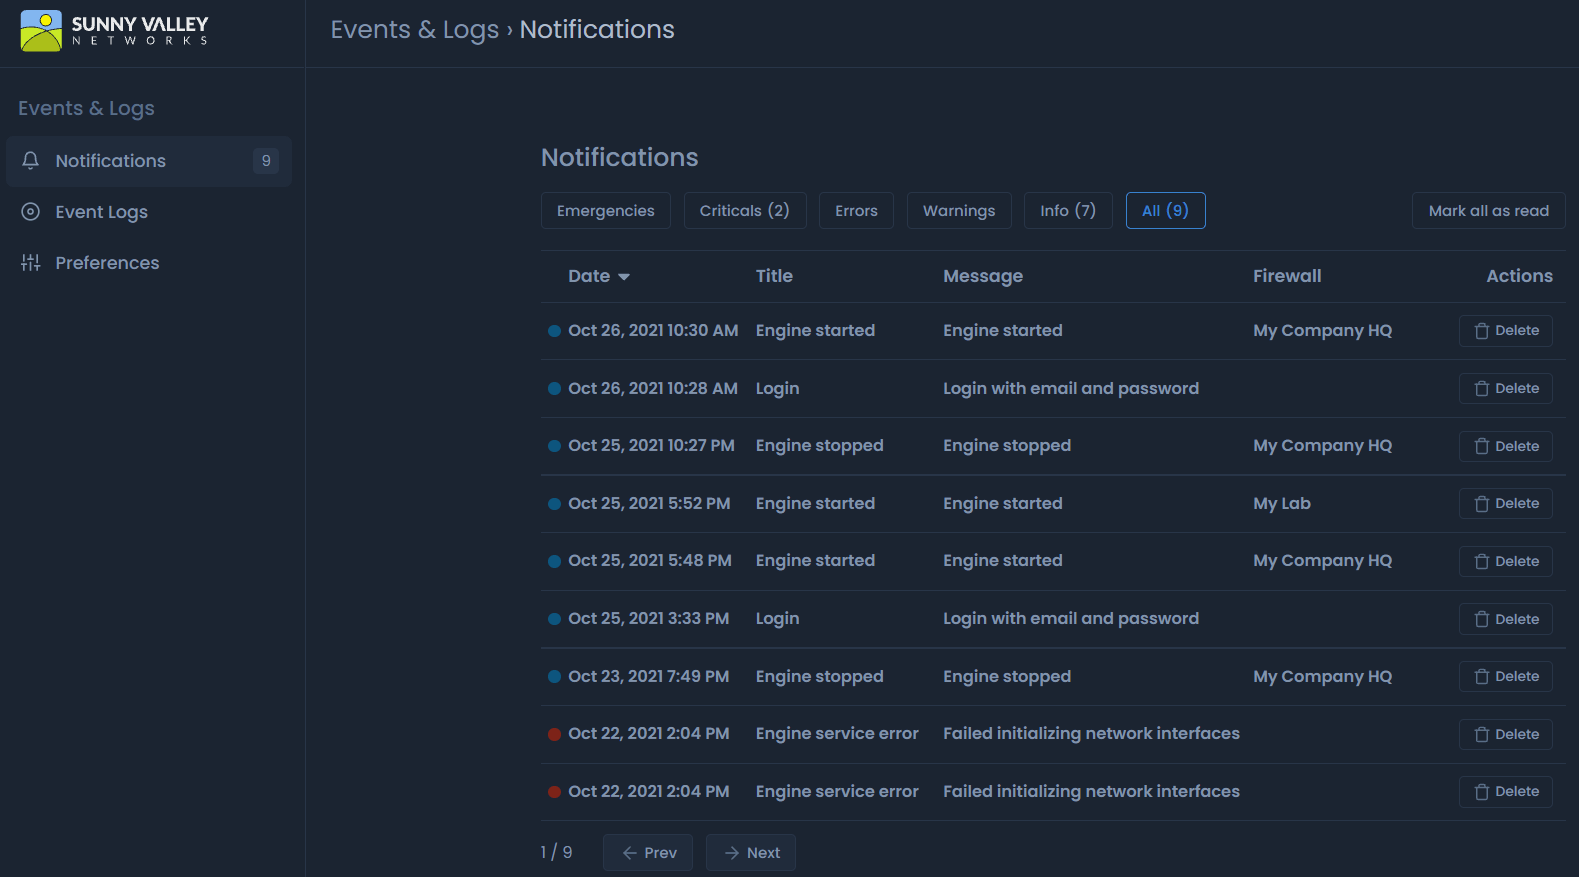
The notifications with the highest priority are displayed by default on the Notifications page. For example, if you have error messages but no emergency or critical notifications, the error messages are displayed when you open your Notifications page.
You may filter the messages based on the event log priority by clicking on the priority filtering buttons at the top of the page.
Notifications page provides you the following details and tasks about the event logs.
-
Date: Time of the event that occurs. -
Title: Gives a comprehensive description about the event. -
Message: Details of the event log. -
Firewall: Name of the node to which event log belongs to. -
Action: You may remove a notification by clicking on theDeletebutton under theActioncolumn. -
Navigation: Maximum number of notifications which are displayed on a page is10. When you have more notifications, you may navigate between the pages by clicking on thePrevandNextbuttons. -
Number of new messages: Total number of new/unread messages are visible on the priority filtering buttons at the top of the page.
Figure 2. Viewing notifications
Removing the Notifications
To remove a notification message from the web UI one at a time,
-
Click on the
Deletebutton at the end of the notification row on theNotificationspage. This will open a dialog box for confirming the deletion. -
Click on the
Deletebutton to delete the notification message.Figure 3. Confirming the notification message removal
To remove all read notification messages,
-
Click on the
...- 3 dot menu icon at the end of the Notifications header.
Figure 4. Removing all read notification messages
-
Click on the
Delete all read. This will pop up a dialog box. -
Click on the
Delete all readfor confirming the removal of all read notification messages.Figure 5. Confirming to remove all read notification messages
Reading the Notifications
You can easily read the notification messages by double clicking on the notification message on the Notifications page. This will pop up a window containing the details of the notification.
Figure 6. Reading notification details
New/unread notification messages are displayed in Bold font.
Zenconsole also allows you to mark all notification messages as read easily.
To mark all notifications as read, you may follow the next steps:
-
Click on the
...- 3 dot menu icon at the upper right corner of theNotificationpage. This will open a drop-down menu. -
Click on the
Mark all as readbutton. This will bring up a confirmation dialog box. -
Click the
Mark all as readbutton to confirm the operation.Figure 7. Confirmation dialog box for
Mark all as read
Sorting Notifications
You may sort the notification messages on the Notifications page by time. To sort the notification messages in ascending/descending order click the Date column header on the page.
Customizing the Notifications
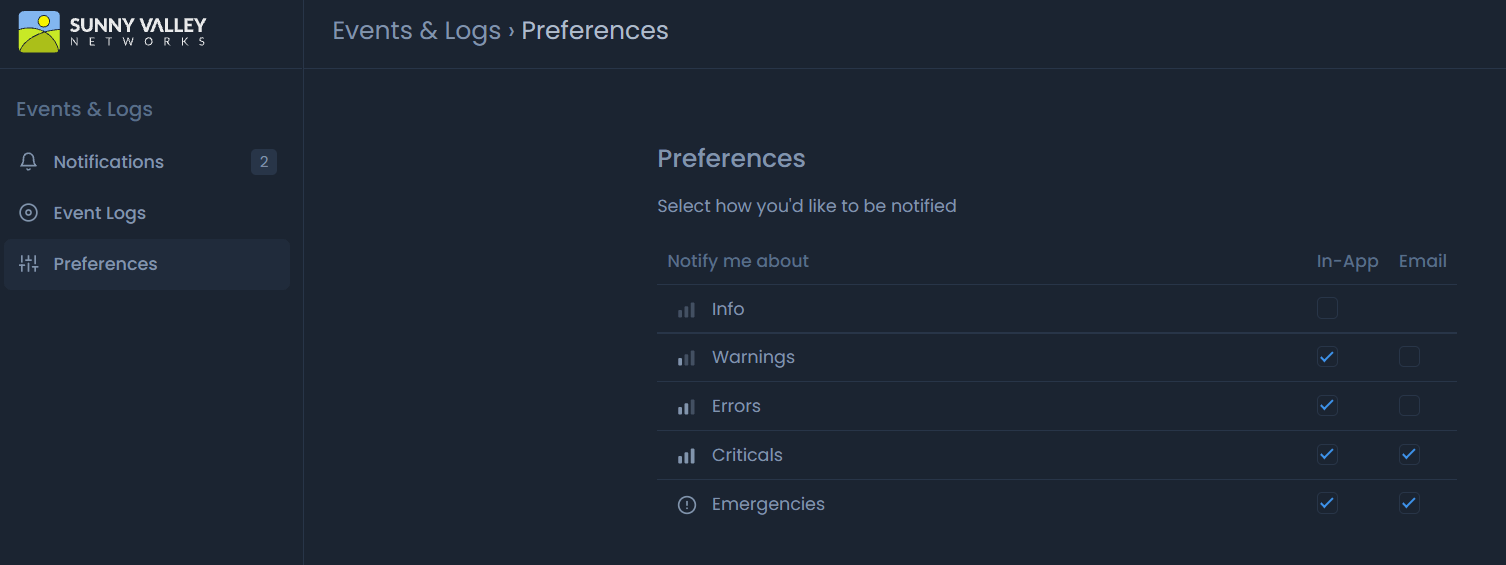
Depending on your preferences, Event Logs notifications can be delivered to you via the web UI and/or e-mail. You can set your preferences for notification delivery by following the steps outlined below:
-
Click the
Notificationsbutton with aRingicon on thePortal Administration Baror click on theAccountbutton and thenEvent Logsbutton. These will take you to theEvents & Logspage. -
Click on the
Preferencesbutton on the left side bar. -
Set the preferences for the notifications as you wish.

Figure 8. Setting the preferences for the notifications
By default Emergency and Critical priority event logs are sent you via both web UI (In-App) and Email since they are vital and may be a sign of upcoming or occuring service interruptions. Also, Warnings and Errors priority event logs are delivered on web UI (In-App) by default.
Viewing Event Logs
To view the event logs, you may follow the next steps:
-
Click on the
Accountbutton -
Event Logsbutton. These will take you to theEvents & Logspage.
Or
-
Go to the
Portal Administration Bar -
Click the
Notificationsbutton with aRingicon -
Click
Event Logsbutton on the left sidebar.
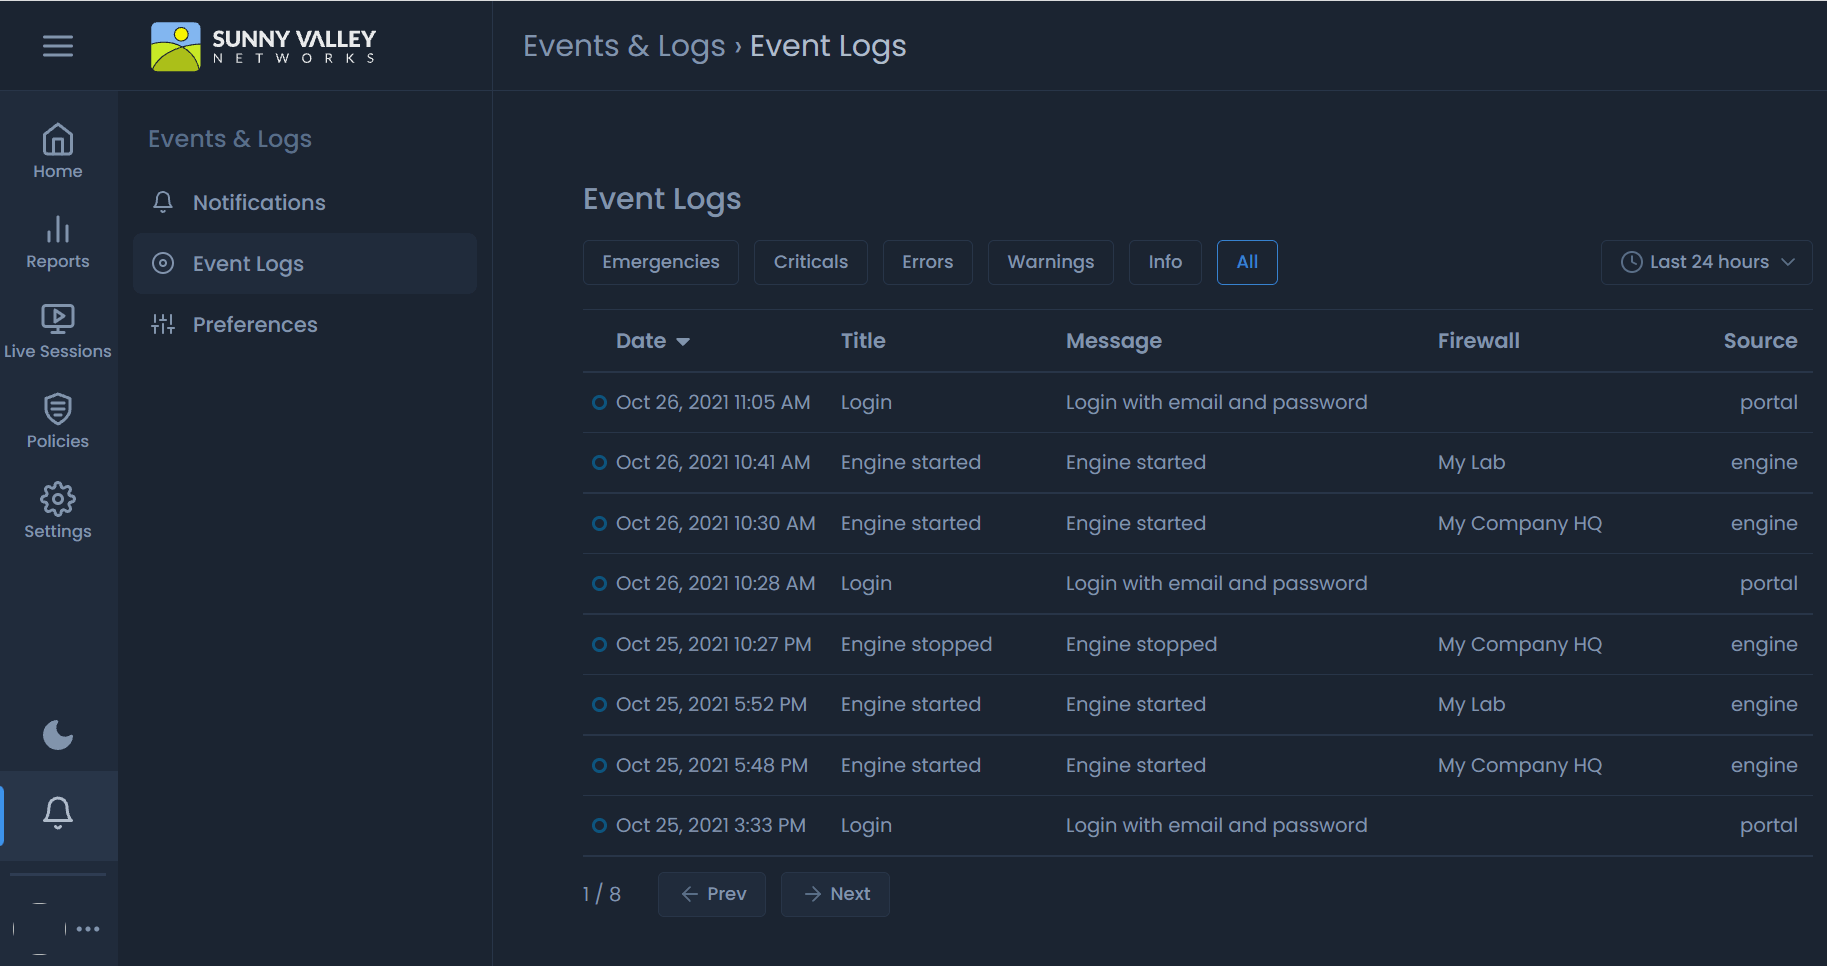
Figure 9. Viewing event logs
All event logs are displayed by default on the Event Logs page. Later, you may filter the messages based on the event log priority by clicking on the priority filtering buttons at the top of the page.
Notifications page provides you the following details and tasks about the event logs.
-
Date: Time of the event that occurs. -
Title: Gives a comprehensive description about the event. -
Message: Details of the event log. -
Firewall: Name of the node to which event log belongs to. -
Source: Source of the event log,engineorportal. -
Navigation: Maximum number of event logs which are displayed on a page is10. When you have more event logs, you may navigate between the pages by clicking on thePrevandNextbuttons. -
Setting Time Range: You may set the time range for the event logs.
Sorting Event Logs
You may sort the event logs on the Event Logs page by time. To sort the event logs in ascending/descending order click the Date column header on the page.
Setting Time Range for Event Logs
The time range for the Event Logs can be set by clicking on the Time Range drop down menu at upper right corner of the page. By default, it is set to the last 24 hours. Available time ranges for the Event Logs are as follows:
-
Last 30 minutes
-
Last 6 hours
-
Last 12 hours
-
Last 24 hours
-
Last 72 hours
-
Last week
-
Custom range
Figure 10. Setting time range for event logs
With the custom range, you can create a custom event log view for a specified time range. To set a custom time period, you may follow the next steps:
-
Click on the
Time Rangedrop down menu at upper right corner of the page. -
Click on the
Custom range. This will open a window to set theStart dateand theEnd dateof the report.Figure 11. Setting a custom time range
-
Set the
Start dateand theEnd dateas you wish. You can either enter the date and time manually or select them by clicking on the related icons (calendar/clock).Figure 12. Setting the start time of the Event Logs
Figure 13. Setting the start hour/minute of the Event Logs
-
Click the
Applybutton.