Viewing Global Deployments
The Global Deployments page in Zenconsole is a centralized dashboard that provides a complete overview of your organization’s network deployments. It allows administrators to see all gateways and endpoints in one place, presented in both map and list formats.
Global Deployments feature is especially valuable for organizations that have multiple locations, remote users, or distributed infrastructures. By consolidating visibility into a single interface, the Global Deployments enhances control, efficiency, and security.

Figure 1. Global Deployments View
Global Deployments is only available for SSE and higher editions.
Benefits of Global Deployments View
Understanding the benefits of the Global Deployments is essential for organizations that want to improve visibility, simplify operations, and strengthen the security of their network infrastructure. By consolidating information into a single dashboard, administrators gain valuable insights and can act faster to maintain a healthy and secure environment.
-
Unified Visibility: With the Global Deployments, you can gain a complete picture of your entire network at a glance. Instead of signing into multiple devices, the Global Deployments brings everything together in one place. Administrators can quickly understand the current status of all gateways and endpoints.
-
Operational Efficiency: With centralized control, you can manage your deployments more effectively and save time on routine tasks. Adding new gateways or endpoints requires only a few clicks. Updates and monitoring can be performed without switching between different systems.
-
Real-Time Monitoring: With live insights into device activity and health, you can stay informed about the status of your network at all times. The Last Seen status helps identify inactive devices. Map and list views make it easy to spot issues and act immediately.
-
Simplified Troubleshooting: By identifying and resolving issues faster, you can reduce downtime and improve the reliability of your network. Offline gateways or outdated engine versions are visible at a glance. It helps administrators quickly isolate and fix potential problems.
-
Enhanced Security: Keep your organization safe by ensuring only secure connections are part of your deployment. This minimizes the risk of unsecured or unauthorized devices accessing the network.
Accessing Global Deployments View
The Global Deployments View is built to be user-friendly and intuitive. By following the steps below, you can quickly access the page, explore its features, and manage your deployments with ease.
-
Open your browser and navigate to Zenconsole.
-
Enter your username and password.
-
Once logged in, the left-hand sidebar will display the navigation menu.
-
Click Global Deployments on the left-hand sidebar.
-
The menu will expand to show the following sub-options:
- Gateways & Endpoints
- Devices on Gateways
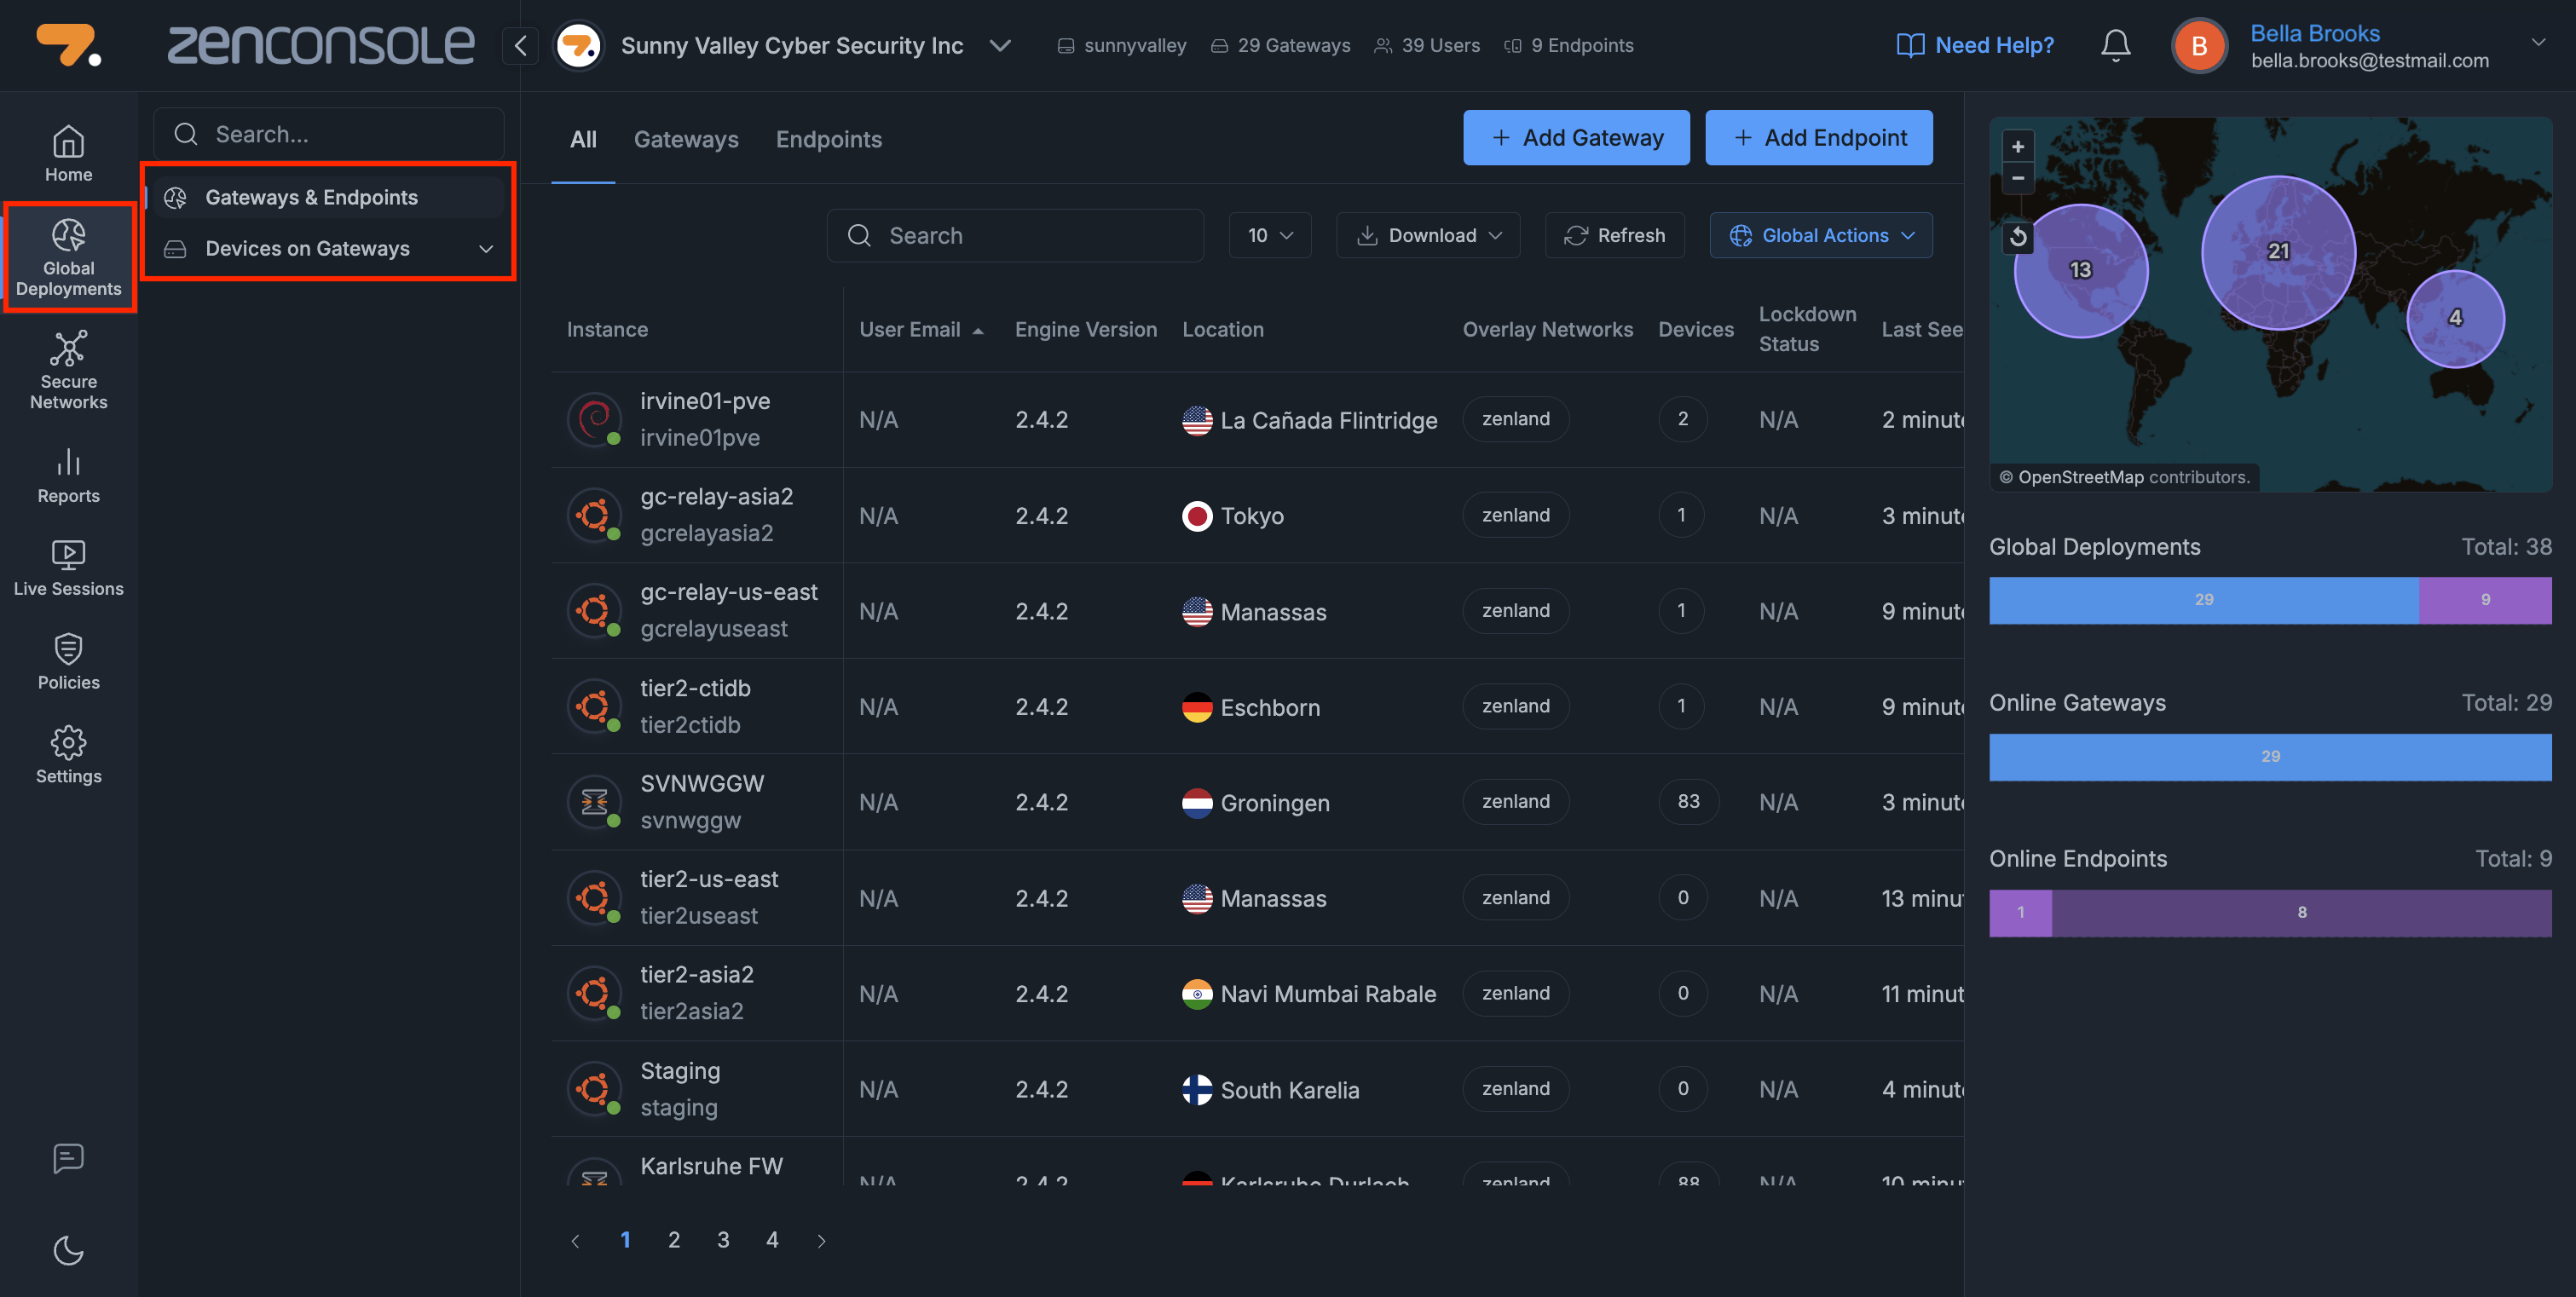
Figure 2. Global Deployments Menu
Think of this menu as your “control tower” for managing your organization's networks.
Once you have accessed the Global Deployments, you can perform several key actions that help you monitor, manage, and expand your secure network.
- Explore Gateways & Endpoints: You may view all gateways and endpoints in a unified list, filter by type, and check details like engine version, location, and last seen status.
- Explore Devices on Gateways: You may view which user devices are connected through each gateway and check their online/offline status.
- Use the Map and Statistics Panel: You may gain quick visual insights into where your deployments are located and how many devices are online.
- Add New Devices: You may easily register new gateways or endpoints to expand your secure network.
These actions cover the core functionality of the Global Deployments, giving you complete visibility and control over your organization’s secure networks.
Exploring Gateways & Endpoints
This section provides an overview of all gateways and endpoints in your organization. It is the central place where you can review all registered devices and their current status in one table.
To view all gateways and endpoints in your organization, click Gateways & Endpoints in the left navigation. At the top of the table, you will notice three tabs that are shared below.
- All: Displays all gateways and endpoints together in a single list.
- Gateways: Filters the list to show only gateway devices.
- Endpoints: Filters the list to show only endpoint devices.
The All tab provides a quick overview, while the Gateways and Endpoints tabs allow you to focus on specific device types.

Figure 3. Gateways & Endpoints
Management Bar
The Management Bar sits directly above the instance table. From left to right, you will see the following buttons.
-
Search
-
Rows‑per‑page selector (e.g., “10”)
-
Download
-
Refresh
-
Global Actions

Figure 4. Management Bar
Searching Zenarmor Instances
You can find the Search field with a magnifying glass icon on the left side of the Management Bar. The search function allows you to quickly find specific gateways or endpoints by using keywords such as the instance name, user email, and location. The table will instantly update to show only matching entries.
You can follow these steps to search for Zenarmor instances.
-
Click into the Search field on the Management bar at the head of the Global Deployments page.
-
Type a keyword (e.g., Lab-OPNsense-VM, [email protected]).
-
The list will automatically filter in real time as you type. You may clear the search by deleting the text to return to the full list.

Figure 5. Searching Instances
Combine the search with the category tabs (All / Gateways / Endpoints) to narrow the scope. If you don’t see expected results, check that filters are cleared and the correct tab is selected.
Listing Zenarmor Instances (Rows per page)
You can control how many instances are shown on a single page by using the rows-per-page selector, which is located right next to the Search field on the Management Bar. It is represented by a stack icon and a number (for example, 10).
You can follow these steps to list Zenarmor instances.
-
Click the rows‑per‑page selector.
-
Choose the number of rows for the Zenarmor instances list. This will be automatically applied to your view. Available options are as follows:
- 10
- 20
- 50
- 100
- All

Figure 6. Listing Instances
Exporting Zenarmor Instances
You can export the currently displayed list of instances, including any active filters and the visible columns, by using the Download button with a download icon on the right side of the Management Bar.
You can follow these steps to export Zenarmor instances.
-
Navigate to the Global Deployments page on Zenconsole.
-
Click Download on the management bar. This will open a drop-down menu.
-
Click CSV to export your Zenarmor instances list into a CSV file. This will open a dialog box.

Figure 7. Exporting Instances
-
You may rename the CSV file or browse on your local disk and then click the Save button.

Figure 8. Saving the CSV File
The export reflects exactly what is currently displayed, so make sure to refine the list using the category tabs (All / Gateways / Endpoints) or the search field before exporting.
Refreshing the Instance List
You can refresh the Zenarmor instances table on Global Deployments page at any time to retrieve the latest data from Zenconsole by using the Refresh button with a circular arrow icon at the end of the Management Bar.
After adding a new Gateway/Endpoint or when you expect status changes (e.g., Last Seen timestamps), you may click the Refresh button on the management bar to reload the Zenarmor instances table.
If the list still looks outdated after refreshing, make sure you are on the correct tenant and category tab, and check your network connection before trying again.
Using Global Actions
The Global Actions button is located on the far right side of the Management Bar. It allows you to perform organization-wide operations across all gateways and endpoints from a single place.
When you click the Global Actions button, a dropdown panel appears (as shown below), providing centralized controls for managing all gateways and endpoints, including instant actions, auto-update settings, and lockdown configurations.

Figure 9. Global Actions Panel
Instant Actions
The Instant Actions section allows you to trigger immediate operations across all instances without waiting for scheduled processes.

Figure 10. Instant Actions
The available actions in this section are outlined below.
Sync All Instances
This option triggers an immediate configuration synchronization for all gateways and endpoints, overriding the default sync interval.
To sync all instances, follow the steps below:
-
Navigate to the Global Deployments page on Zenconsole.
-
On the Management Bar, click Global Actions.
-
In the Instant Actions tab, click Sync Now. This will automatically update the settings for all Zenarmor instances in your organization.
-
Once the synchronization is triggered, a success notification appears at the bottom-right corner of the screen.

Figure 11. Sync Now
Update All Endpoints
This option forces all endpoints to check for updates and apply them immediately.
To perform this action, follow the steps below:
-
Navigate to the Global Deployments page on Zenconsole.
-
On the Management Bar, click Global Actions.
-
In the Instant Actions tab, click Update Now.

Figure 12. Update Now
-
A confirmation dialog titled Update All Endpoint Devices will appear.

Figure 13. Update All Endpoint Devices - Continue
-
Click Continue to start the update process.
-
Once the update process is initiated, a success notification appears at the bottom-right corner of the screen.

Figure 14. Success Notification
Use these actions after making global configuration or policy changes to ensure all instances are updated without delay.
The remote update feature is only supported on endpoint devices running version 2.3.3 or higher. Devices with older versions must be updated manually by the end user.
Auto-update Settings
The Auto-update Settings section allows you to control whether endpoints receive updates automatically, reducing the need for manual intervention.

Figure 15. Auto-update Settings
Auto Update All Endpoints
This option determines how updates are handled for endpoint devices:
- ON: Endpoints automatically check for updates and install them periodically.
- OFF: Updates must be triggered manually (for example, using Update all endpoints).
To configure this setting, follow the steps below:
-
Navigate to the Global Deployments page on Zenconsole.
-
On the Management Bar, click Global Actions.
-
Open the Auto-update Settings tab.
-
Toggle Auto update all endpoints:
- ON → Automatic updates enabled
- OFF → Manual updates only

Figure 16. Auto-update All Endpoints
-
Once the setting is applied, a success notification appears at the bottom-right corner.
-
(Optional) If you do not want to wait for the default synchronization interval (e.g., 15 minutes), click Sync Now from the notification prompt at the bottom-right corner to apply the changes immediately across all endpoints.
Enable this setting to ensure all endpoints remain up to date without manual intervention.
Lockdown Settings
The Lockdown Settings section provides advanced security controls to prevent users from modifying or disabling Zenarmor on endpoints.

Figure 17. Lockdown Settings
Lockdown All Endpoints
This option restricts user-level control over Zenarmor on all endpoints.
When enabled, users are not allowed to stop Zenarmor services, bypass the engine, or uninstall Zenarmor.
To configure this setting, follow the steps below:
-
Navigate to the Global Deployments page on Zenconsole.
-
On the Management Bar, click Global Actions.
-
Open the Lockdown Settings tab.
-
Toggle Lockdown all endpoints:
- ON → Lockdown enabled
- OFF → No restrictions

Figure 18. Lockdown All Endpoints
-
Once the setting is applied, a success notification appears at the bottom-right corner.
-
(Optional) If you do not want to wait for the default synchronization interval (e.g., 15 minutes), click Sync Now from the notification prompt at the bottom-right corner to apply the changes immediately across all endpoints.
Temporary Unlock Duration
This option defines how long an endpoint remains temporarily unlocked when an administrator disables lockdown for troubleshooting or maintenance purposes.
When a device is unlocked, the previously enforced lockdown restrictions are lifted for the selected duration. Once this period expires, lockdown is automatically re-enabled to restore protection.
To configure this setting, follow the steps below:
-
Navigate to the Global Deployments page on Zenconsole.
-
On the Management Bar, click Global Actions.
-
Open the Lockdown Settings tab.
-
Locate the Temporary unlock duration.
-
Select the desired duration from the dropdown menu (e.g., 1 hour).

Figure 19. Temporary Unlock Duration
-
Once the setting is applied, a success notification appears at the bottom-right corner.
-
(Optional) If you do not want to wait for the default synchronization interval (e.g., 15 minutes), click Sync Now from the notification prompt at the bottom-right corner to apply the changes immediately across all endpoints.
Lockdown mode is a powerful security feature. Enable it only when you want to prevent user-level modifications strictly.
Viewing the Instance List
The Zenarmor instance list on the Global Deployments page displays important details for each instance. Each row in the table represents a single instance. The following columns provide key details:
- Instance Name: Identifier of the instance(e.g., cp-1, Lab-OPNsense-VM).
- User Email: Linked account for that instance.
- Engine Version: Zenarmor software version running.
- Location: Geographical placement of the instance.
- Overlay Networks: Configured private secure networks (if any).
- Devices: Number of connected instances under a gateway.
- Lockdown Status: Indicates whether the endpoint is currently under lockdown restrictions (e.g., Locked or Unlocked)
- Last Seen: Time elapsed since the last detection of the Zenarmor instance.
- Actions: Quick actions you can perform on this instance (explained below).
Sorting Instance List
You can click any column header (for example, User Email or Location) to sort the list based on that property, either ascending or descending.

Figure 20. Instance List
Filtering Instance List
The Zenarmor Instance List on the Global Deployments page allows you to filter or exclude instances to narrow down the displayed results. This feature helps administrators quickly locate specific gateways or endpoints.
You can follow these steps to filter Zenarmor instances.
-
Navigate to the Global Deployments page on Zenconsole.
-
To apply a filter, click on the value inside one of the filterable columns. A small menu will appear with two options:
- Filter: Click this option to show only the rows that match the selected value.
- Exclude: Click this option to hide all rows that match the selected value.
tipFiltering is available for the following fields.
- User Email: Filter instances by the email address associated with the instance.
- Engine Version: Filter instances by the running software version.
- Location: Filter instances by the geographical location of the instance.
-
You can add additional filters from different fields (e.g., filter by Engine Version and then by Location). This helps narrow down results more precisely.

Figure 21. Filtering Instances
-
All applied filters and exclusions are displayed at the top of the Instance List. Each filter is shown as a tag, indicating whether it is an inclusion (
=) or exclusion (≠). To clear all filters at once, either manually remove each tag with the “×” icon or click the Refresh button on the top-right corner.
Figure 22. All Applied Filters
Actions
Each instance row includes a three-dot (...) menu under the Actions column. When clicked, this menu opens a context panel displaying actions that can be applied to the selected instance.

Figure 23. Actions for Endpoints
The following actions may be available depending on the instance type, current state, and enabled features.
- Sync Now → Triggers immediate synchronization (available for all instances)
- Manage Devices → Opens connected devices under the gateway (gateways only)
- Settings → Opens the configuration panel (gateways only)
- Edit Name → Updates the display name of the instance (gateways only)
- Edit Slug → Updates the unique identifier (available for all instances)
- Disable SSE Protection → Disables SSE protection (available only when SSE is enabled)
- Enable SSE Protection → Re-enables SSE protection (visible when SSE is disabled)
- Temporarily Unlock → Temporarily disables lockdown restrictions (visible when lockdown is active)
- Permanently Unlock → Removes lockdown restrictions (visible when lockdown is active)
- Permanently Re-lock → Re-applies lockdown restrictions (visible when the endpoint is unlocked)
- Offline Unlock Codes → Generates unlock codes for offline usage(visible when lockdown is enabled)
- Remove → Removes the instance from the organization (available for all instances)
Not all actions are visible for every instance. The Actions menu dynamically updates based on the instance type (Gateway or Endpoint), its current state, and enabled features.
Triggering Sync (All Instances)
This action triggers an immediate synchronization for the selected gateway or endpoint instance. Normally, Zenconsole applies updates periodically. This option ensures that any critical configuration or policy changes are applied immediately without waiting for the scheduled interval.
You can follow these steps to trigger synchronization:
-
Navigate to the Global Deployments page on Zenconsole.
-
Locate the instance you want to update in the instance list.
-
At the end of that row, find the Actions column.
-
Click the
…(Actions) button. -
Select Sync Now from the dropdown menu.

Figure 24. Sync Now
-
Once the request is sent, a success notification appears at the bottom-right corner indicating that synchronization has been initiated.
Use this feature after making important configuration or policy changes to ensure they are applied without delay.
Accessing Device Management (Gateways Only)
This action opens the Device Management view for the selected gateway.
It allows you to see all user devices connected through that gateway, monitor their status, and manage device identification settings.
You can follow these steps to access the device management.
-
Navigate to the Global Deployments page on Zenconsole.
-
Locate the gateway instance you want to manage in the instance list.
-
Click the (Actions) button with
…icon to open the context menu. -
Select Manage Devices from the dropdown menu.

Figure 25. Manage Devices
-
The Device Management page will open, listing all devices associated with the selected gateway.
For detailed information about how device identification works and how to configure it, see the official documentation: Device Identification Overview.
Accessing Gateway Settings (Gateways Only)
This action opens the Gateway Settings page for the selected gateway instance. It allows you to configure security policies, adjust filtering rules, and manage other gateway-related settings.
You can follow these steps to access the settings:
-
Navigate to the Global Deployments page on Zenconsole.
-
Locate the gateway instance you want to manage in the instance list.
-
Click the Actions button with the
…icon to open the context menu. -
Select Settings from the dropdown menu.

Figure 26. Settings
-
The Settings page will open, where you can review and update configurations.
Use this section whenever you need to change rules or security policies applied to a specific gateway.
Updating Gateway Name (Gateway Only)
This option allows you to change the display name of the selected gateway instance.
You can follow these steps to update the instance name:
-
Navigate to the Global Deployments page on Zenconsole.
-
Locate the gateway instance you want to manage in the instance list.
-
Click the Actions button with the
…icon to open the context menu. -
Select Edit Name from the dropdown menu.

Figure 27. Updating Gateway Name
-
Enter the new name in the pop-up window.
-
Click Change to apply the update.
Updating Slug
This option allows you to change the slug (unique identifier) of an instance.
Slugs are used to uniquely identify instances within the console and improve manageability.
You can follow these steps to update the slug:
-
Navigate to the Global Deployments page on Zenconsole.
-
Locate the instance you want to manage in the instance list.
-
Click the Actions button with the
…icon on the right side of that row. -
Select Edit Slug from the dropdown menu.

Figure 28. Edit Slug
-
In the Change Slug pop-up window, enter the new name/slug for the endpoint.

Figure 29. Change Slug Pop-up
-
Click Change to apply the update.
Use clear, descriptive slugs (e.g., cp-1, sales-laptop, branch-office) to make endpoints easier to track.
Disable SSE Protection (Endpoints Only)
This option disables SSE protection for the selected endpoint (if SSE is enabled).
You can follow these steps to disable SSE protection:
-
Navigate to the Global Deployments page on Zenconsole.
-
Locate the endpoint instance you want to manage in the instance list.
-
Click the Actions button with the
…icon on the right side of that row. -
Select Disable SSE Protection from the dropdown menu.

Figure 30. Disable SSE Protection
-
A confirmation dialog will appear, explaining that SSE protection will be disabled and only Secure Networks functionality will remain active.

Figure 30. Disable SSE Protection Pop-up
-
Click Disable to confirm.
-
Once the action is completed, a success notification appears at the bottom-right corner indicating that SSE protection has been disabled successfully.
SSE-related actions are state-dependent. When SSE protection is disabled, the Enable SSE Protection option becomes available. When it is enabled, the Disable SSE Protection option is shown instead.
Enabling SSE Protection (Endpoints Only)
This option re-enables Secure Service Edge (SSE) protection for an endpoint where it has been previously disabled.
To enable SSE protection, follow the steps below:
-
Navigate to the Global Deployments page on Zenconsole.
-
Locate the endpoint instance you want to manage in the instance list.
-
Click the Actions button with the
…icon on the right side of that row. -
Select Enable SSE Protection from the dropdown menu.

Figure 31. Enable SSE Protection
-
A confirmation dialog will appear explaining that SSE protection and internet traffic inspection will be re-enabled.
-
Click Enable to confirm.

Figure 32. Enable SSE Protection Pop-up
-
Once the action is completed, a success notification appears at the bottom-right corner indicating that SSE protection has been enabled successfully.
Permanently Unlocking an Instance
This option removes lockdown restrictions permanently from the selected instance.
To permanently unlock an endpoint, follow the steps below:
-
Navigate to the Global Deployments page on Zenconsole.
-
Locate the endpoint instance you want to manage in the instance list.
-
Click the Actions button with the
…icon on the right side of that row. -
Select Permanently Unlock from the dropdown menu.

Figure 33. Permanently Unlocking an Instance
Temporarily Unlocking an Instance
This option temporarily disables lockdown restrictions on the selected instance.
To temporarily unlock an endpoint, follow the steps below:
-
Navigate to the Global Deployments page on Zenconsole.
-
Locate the endpoint instance you want to manage in the instance list.
-
Click the Actions button with the
…icon on the right side of that row. -
Select Temporarily Unlock from the dropdown menu.

Figure 34. Temporarily Unlocking an Instance
-
A confirmation dialog will appear asking you to confirm the action and informing you that the endpoint will be unlocked for a limited duration.
-
Click Unlock to confirm.
-
Once confirmed, the endpoint will be temporarily unlocked.
The endpoint will remain unlocked for the configured duration (e.g., 15 minutes, 1 hour). After this period, lockdown restrictions will be automatically re-enabled.
You can configure the unlock duration from Global Deployments → Global Actions → Lockdown Settings → Temporary unlock duration.
Permanently Re-locking an Instance
When an endpoint is already unlocked, this option allows you to re-enable lockdown.
You can follow these steps to re-enable lockdown:
-
Navigate to the Global Deployments page on Zenconsole.
-
Locate the endpoint instance you want to manage in the instance list.
-
Click the Actions button with the
…icon on the right side of that row. -
Select Permanently Re-lock from the dropdown menu.

Figure 35. Permanently Re-locking an Instance
-
A confirmation dialog will appear asking you to confirm the action. Click Lock to confirm and apply the lockdown.
-
Once confirmed, the endpoint will be immediately locked, and restrictions will be enforced.
Re-locking an endpoint will immediately re-enable all lockdown restrictions, preventing users from modifying or disabling Zenarmor.
This option is available only when the instance is currently unlocked.
The available lockdown-related actions may vary depending on the current Lockdown Status of the endpoint.
- When an endpoint is locked, actions such as Temporarily Unlock and Permanently Unlock are available.
- When an endpoint is unlocked, the Permanently Re-lock option becomes available instead.
- Some actions may appear disabled based on the current state.
Make sure to check the Lockdown Status column to understand which actions are applicable.
Generating Offline Unlock Codes
This option generates unlock codes that can be used when the endpoint is offline.
You can follow these steps to generate unlock codes:
-
Navigate to the Global Deployments page on Zenconsole.
-
Locate the endpoint instance you want to manage in the instance list.
-
Click the Actions button with the
…icon on the right side of that row. -
Select Offline Unlock Codes from the dropdown menu.
-
Once selected, a panel will open displaying multiple unlock codes associated with the endpoint.

Figure 36. Generating Offline Unlock Codes
-
Each code can be copied individually using the copy icon next to it. These codes can then be used to unlock the endpoint manually, even when it is offline.
Offline unlock codes are especially useful in scenarios where the endpoint cannot communicate with Zenconsole but still requires administrative access.
Removing an Endpoint (Endpoints Only)
This option allows you to remove an endpoint instance from your organization. Once removed, the endpoint will no longer appear in the list or be managed by your tenant.
You can follow these steps to remove an endpoint.
-
Navigate to the Global Deployments page on Zenconsole.
-
Locate the endpoint instance you want to manage in the instance list.
-
Click the Actions button with the
…icon on the right side of that row. -
Select Remove from the dropdown menu.

Figure 37. Removing an Endpoint
-
In the Warning confirmation dialog, review the endpoint details.

Figure 38. Warning Pop-up
-
Click Remove to finalize the deletion.
Removing an endpoint cannot be undone. You will need to re-enroll the device if you want to add it back later.
Adding a New Gateway
Expanding your organization's network is simple with the Global Deployments. You can easily add new gateways from the dashboard, ensuring that the entire organization stays protected and manageable. This process requires only a few clicks and supports multiple platforms and operating systems.
Adding a new gateway. This is especially useful for branch offices, virtual environments, or cloud-based infrastructures. Follow the steps below to add a gateway.
-
Navigate to the Global Deployments page on Zenconsole.
-
Click + Add Gateway on the Global Deployments page.

Figure 39. Adding a Gateway
-
After clicking + Add Gateway, the Add a Gateway to Your Deployment panel opens. In this panel:
- You can select the target platform (e.g., Ubuntu, Docker, AWS, etc.).
- A one-time installation script is automatically generated.
- The script includes a countdown timer, indicating how long it remains valid.

Figure 40. One-time Installation Script
-
Copy the command and run it on the target device with administrator/root privileges.
-
The installer downloads the required components and completes registration. Within a few minutes, the device appears under Gateways in Zenconsole.
tipWith gateways, you extend your organization’s secure perimeter, ensuring that all traffic passes through trusted control points.
Adding a New Endpoint
Endpoints are user devices such as laptops, desktops, servers, or Android devices that require secure connectivity. By registering endpoints, you can ensure that every device is visible and protected within the deployment. This process is straightforward and supports multiple operating systems. To add an endpoint, follow the steps below.
-
Click
+ Add Endpoint.
Figure 41. Adding an Endpoint
-
Choose your operating system (Windows, macOS, or Linux, etc.).
-
Select one of the installation methods.

Figure 42. Adding an Endpoint to Your Deployment Page
-
After installing Zenarmor on your endpoint, the endpoint will automatically appear in the
Endpointstab.tipAdding endpoints guarantees that individual devices are securely connected and monitored, preventing gaps in visibility or protection.
Using the Map and Statistics Panel
On the right-hand side of the screen, you can find a Map and Statistics Panel that provides a quick overview of your global deployments.This panel visually shows the geographical distribution and the current online status of all your gateways and endpoints.
Zenarmor Global deployment map and statistics panel includes the following sections:
-
Map View: Displays the geographical location of gateways and endpoints.
- Blue circles represent gateways
- Purple circles represent endpoints
- Larger circles indicate multiple instances clustered in the same area.
-
Global Deployments Bar: Shows the total number of instances (both gateways and endpoints).
-
Online Gateways Bar: Shows how many gateways are currently active (blue bar)
-
Online Endpoints Bar: Shows how many endpoints are currently active (purple bar)

Figure 43. Map and Statistics Panel
Exploring the Map
The Zenarmor gateway and endpoint deployments associated with your organization are shown on a map in the global deployment overview pane. This feature enables you to interactively explore and obtain information about your Zenarmor deployments on the map. You have the ability to access specific details within a region. The total quantity of deployments for each region is represented by a purple circle. To observe the details, simply double-click on the circle that is situated in the respective region. You may easily navigate the global deployment map by performing the following operations:
-
Zoom-in: You may zoom in on the map by clicking on zoom-in button with
+icon at the top left of the map or by scrolling the mouse wheel. -
Zoom-out: You may zoom out on the map by clicking on zoom-out button with
-icon at the top left of the map or by scrolling the mouse wheel. -
Wider-view: You may click on the Fit to extent button with the refresh icon for a wider view.
-
Navigate: Drag and drop with your mouse to navigate on the map.
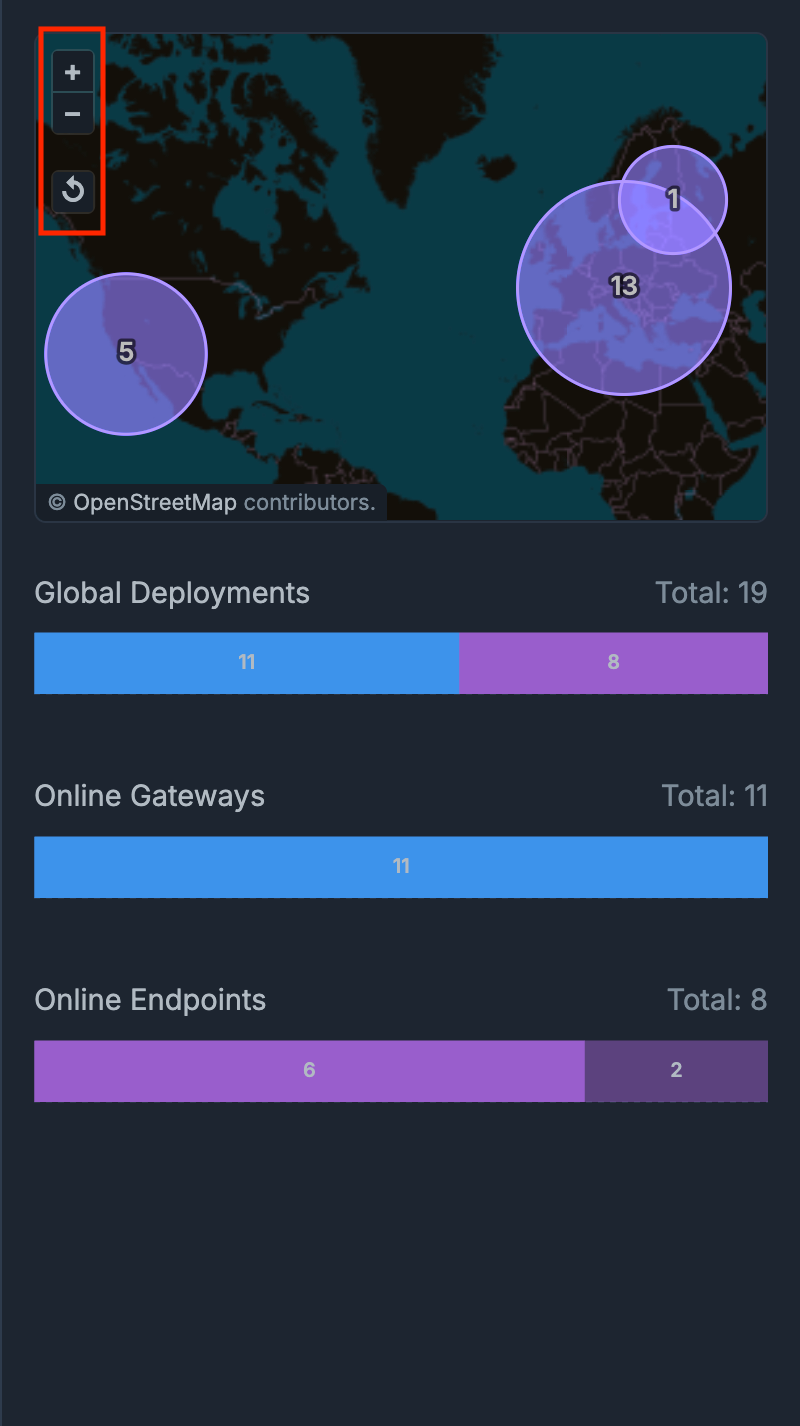
Figure 44. Exploring the Map
Viewing Instance Details
When you click on a specific deployment on the map or in the table, the Instance Details panel opens on the right side of the screen. This panel shows detailed information about the selected gateway or endpoint:
- Name: Instance name
- Slug: Internal unique identifier
- Platform: Operating system (e.g., OPNsense 25.1.1, Windows 10)
- Location: Country/city of the instance
- Added At: Registration date
- Last Seen: Time elapsed since last communication
- Type: Gateway or Endpoint
- Engine Status: Running / Stopped / Bypassed
- Engine Version: Installed Zenarmor engine version
- Overlay Networks: Any connected private secure networks
- Internet Security Policies: Policies currently applied
You can close the panel anytime by clicking the X icon at the top-right corner of the panel.
This panel is especially helpful for a quick “at a glance” check to see where your devices are located and which ones are online.
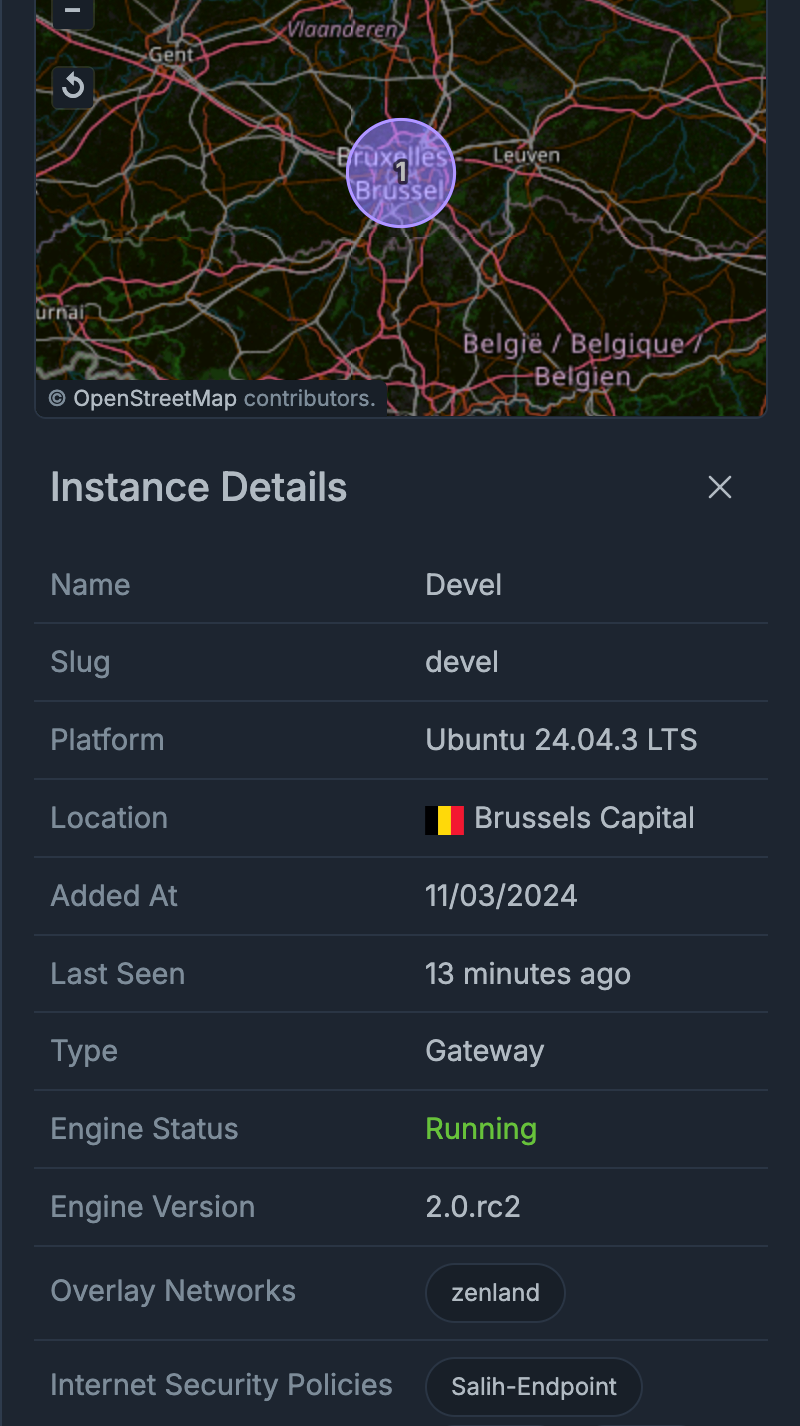
Figure 45. Instance Details
Exploring Devices on Gateways
The Devices on Gateways view allows you to see all end-user devices (laptops, mobiles, IoT, etc.) that are connected through each gateway in your organization. This section answers the question: “Which devices are behind my gateway, and are they currently connected?”.
You can follow these steps to access the Devices on Gateways menu.
-
From the left-hand sidebar, click Global Deployments to expand its menu.
-
Click on Devices on Gateways.
-
A list of your gateways will appear below the menu item.
-
Select a gateway from the list to open its device view.
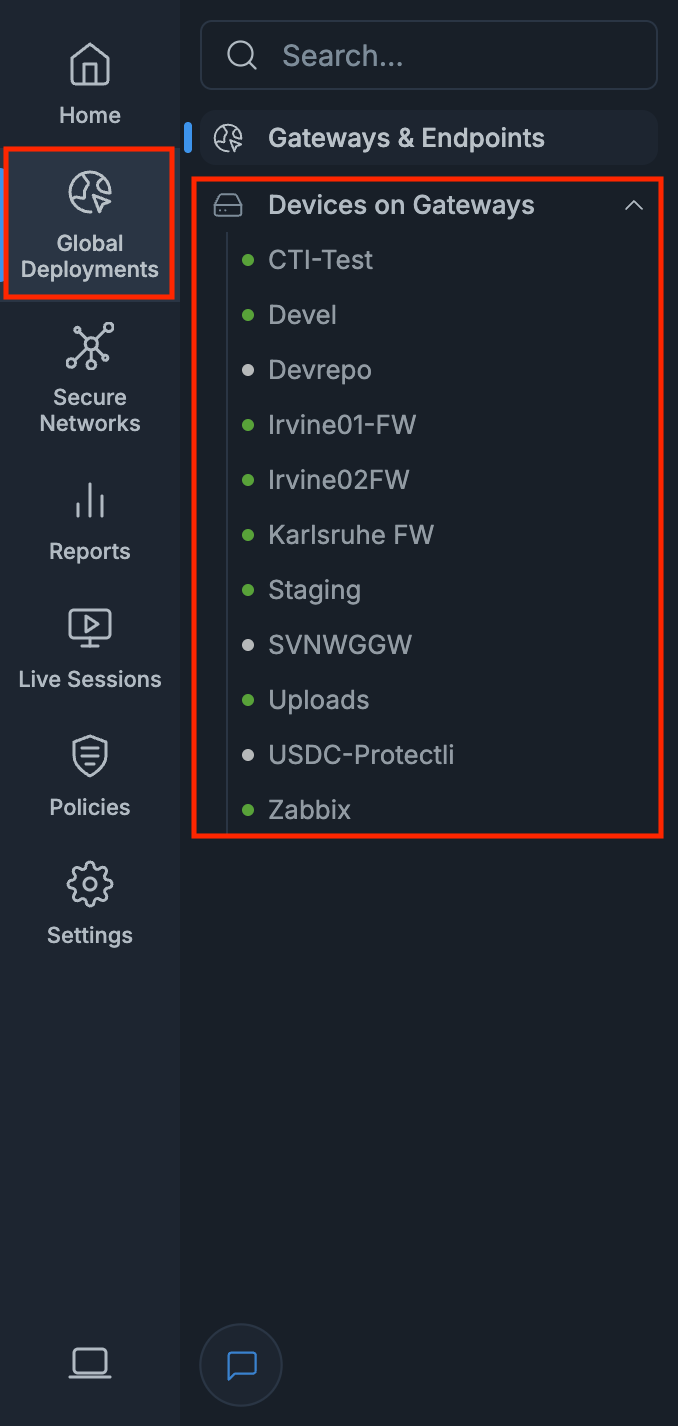
Figure 46. Devices on Gateways
Devices are shown in different categories (such as laptops, mobiles, servers, or IoT devices), making it easier to understand what types of clients are active. You can also check whether these devices are online, offline, or recently connected, giving you a quick overview of their status.
For detailed information about how device identification works and how to configure it, you may view the Device Identification Overview on Zenconsole.