Using Endpoint Application
Zenarmor endpoint applications are used to safeguard your end-user devices, such as desktop PCs, laptops, and even servers, which are classified as endpoints in your Zenconsole organization. With Zenarmor on your endpoint, you do not need a separate firewall appliance located in the perimeter of your LAN or the edge of your WAN connection to protect your device against cyber threats from the Internet.
In recent years, users have gained the ability to connect to the Internet and access their company's resources from virtually anywhere around the globe. However, many of these locations may be insecure and outside your control. With Zenarmor 1.18, you can effortlessly safeguard your remote users without the need to funnel their traffic back to your data center via VPN. This not only eliminates latency issues but also enhances user satisfaction by providing a seamless experience.
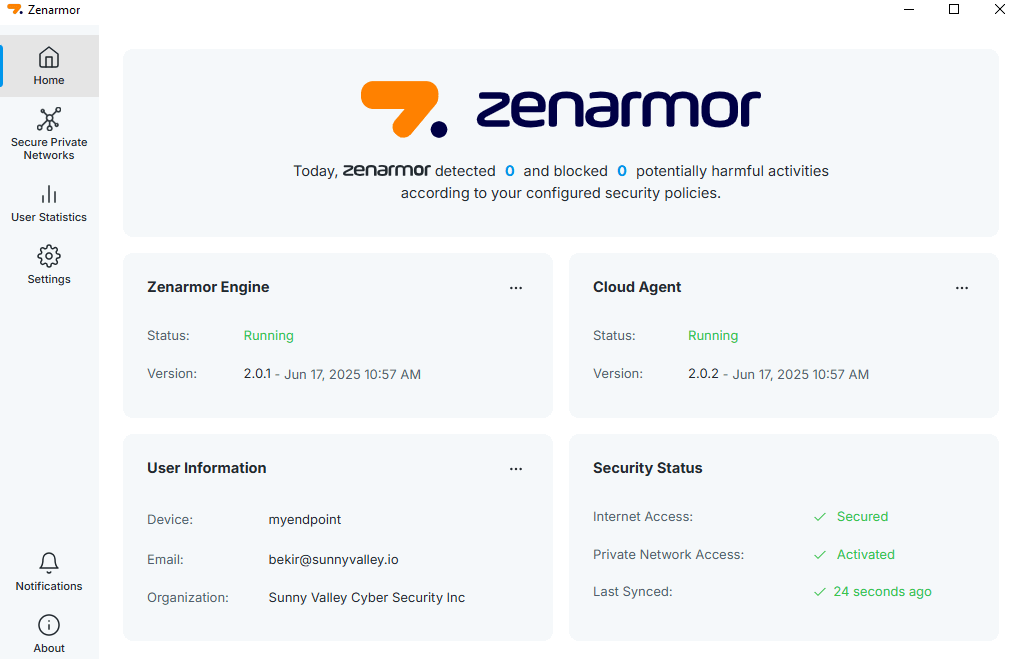
Figure 1. Zenarmor Endpoint Dashboard
To be able to protect your endpoints using Zenarmor, you need to register your endpoints to Zenconsole.
Before starting endpoint registration, you should have an organization set up with identity and access management configuration already completed on Zenconsole.
Organization features and endpoint support are only available on SSE and higher subscriptions.
Supported Platforms
Zenarmor endpoint application supports the following platforms. You may easily install the Zenarmor endpoint application on these platforms.
- Microsoft Windows 10
- Microsoft Windows 11
- Microsoft Server 2019
- Microsoft Server 2022
- macOS 11 and higher versions
- Linux Desktop Distributions (Ubuntu, Debian, Fedora, Linux Mint, Rocky Linux, AlmaLinux, etc.)
Downloading
You may download the Zenarmor endpoint application for your platform from the following pages.
Launching
After you complete the Zenarmor endpoint installation and registration, you should see the Zenarmor icon in the notification area on the taskbar.
To launch the application, you may follow these steps.
-
Right-click on the Zenarmor icon located on the taskbar. This will display a menu.
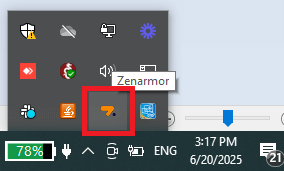
Figure 2. Zenarmor Endpoint Icon
-
Click Show to view and manage the Zenarmor endpoint application.
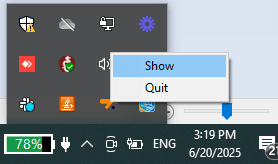
Figure 3. Showing Zenarmor Endpoint
Viewing Home Dashboard
The Home page is the first page of the Zenarmor Endpoint application. This page contains a dashboard that allows you to view the most critical network activity at a glance. You may view network-level information and manage your Zenarmor endpoint.
Threat Summary Pane
You can view the total number of detected and blocked network security threats on your endpoint device in the last 24 hours according to your policies.

Figure 4. Threat Summary Pane
Zenarmor Engine Pane
In this pane, you can view and manage the core packet engine, which does all the heavy lifting and packet processing. It provides Start/Stop and Restart buttons for the engine as well as Bypass Mode control.
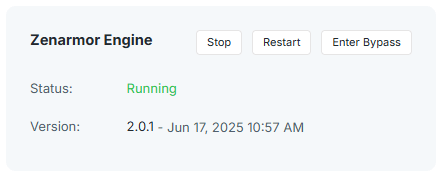
Figure 5. Engine Status Pane
This pane provides details about.
- Status of the engine (Running/Stopped)
- Installed engine version and installation time
Cloud Agent Pane
The cloud agent pane provides a Restart button and the following details.
-
Status of the cloud agent (Running/Stopped)
-
Installed agent version and installation time
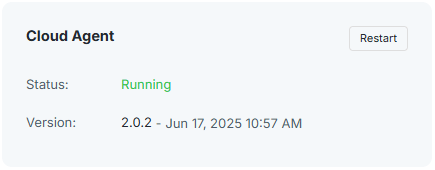
Figure 6. Cloud Agent Pane
User Information Pane
The user information pane provides the following details about the endpoint.
-
Device: Hostname of the endpoint device is displayed.
-
Email: Email address of the user who logs in to the organization using the endpoint application.
-
Organization: Organization name to which the endpoint is registered.
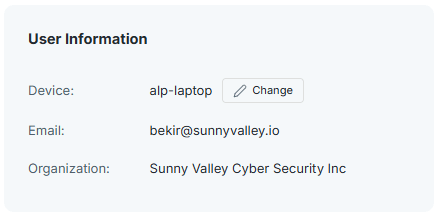
Figure 7. User Information Pane
You may also restart the Zenarmor Cloud Agent service via Services pane on the Settings page.
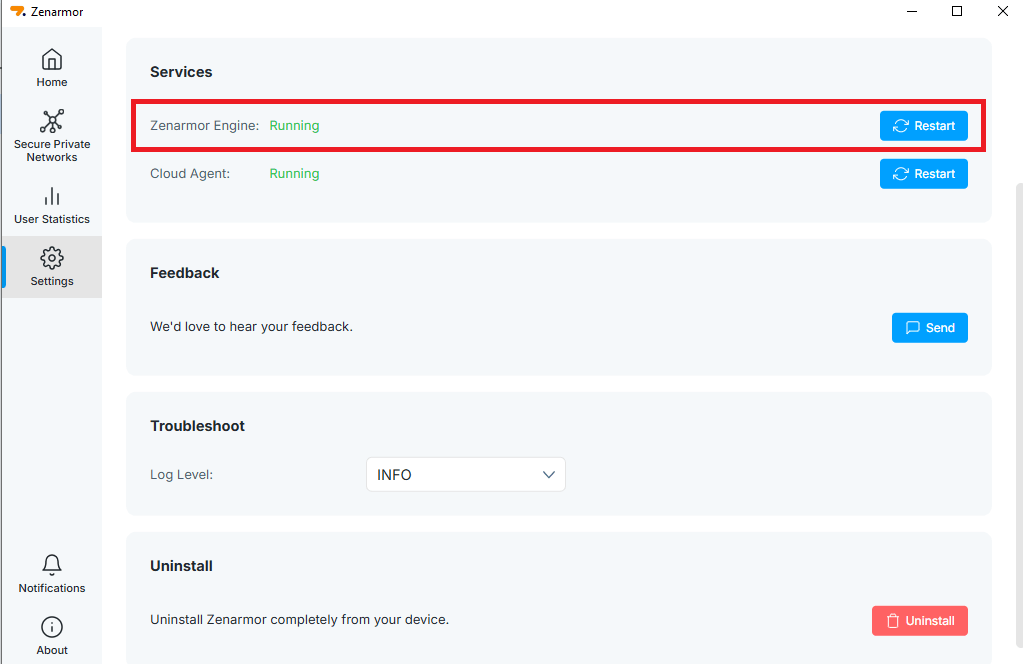
Figure 8. Restart Engine via Settings on Endpoint
Security Status Pane
Security status pane display the following information.
-
Internet Access: When you define an internet access policy within your organization matching this endpoint, *Internet Access status is set to Secured.
-
Private Network Access: When you define a secure private network within your organization and add the endpoint to the private network, this field is set to Activated.
-
Last Synced: Time elapsed since the last communication between the endpoint device and Zenconsole. Zenarmor instances running on endpoints synchronize their states with Zenconsole periodically, every 15 min.
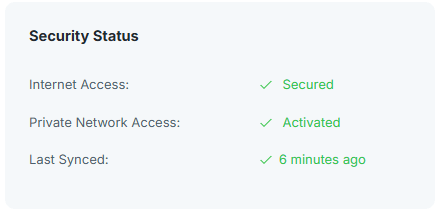
Figure 9. Security Status Pane
Changing Endpoint Device Name
You may change the device name by following the next steps.
-
Hover your mouse over the User Information pane. This will display a Change button.
-
Click on the Change button. This will display a dialog box.
-
Type a name into the Device Name field.
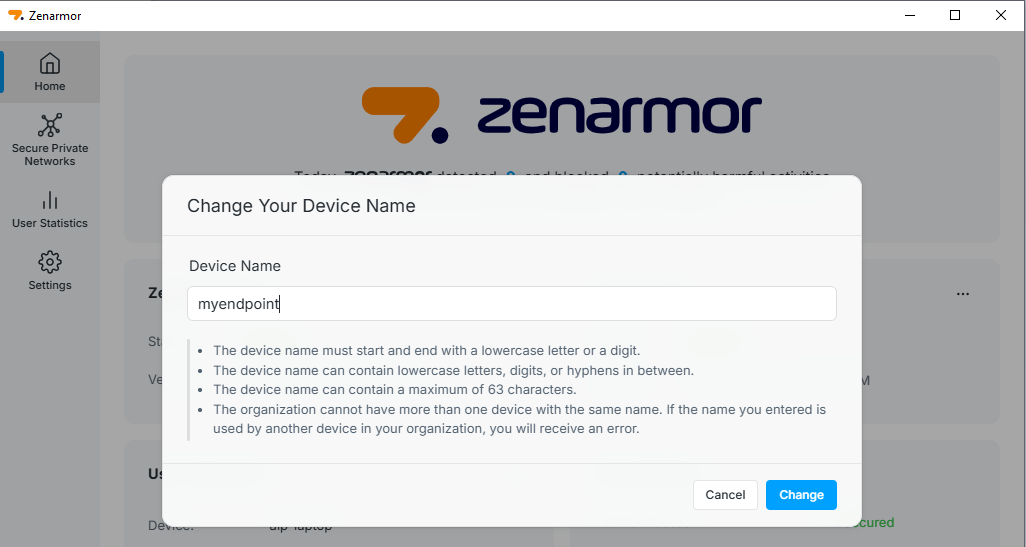
Figure 10. Changing Endpoint Device Name
-
Click the Change button to update the device name.
Enabling Bypass Mode for Packet Engine
For troubleshooting purposes, the packet engine may be run in Bypass Mode. In this mode, the engine does not apply any security controls for traffic and simply passes it through on the protected interfaces. In bypass mode, Zenarmor operates like a dummy L2 bridge.
This feature is useful when investigating incompatible network driver(s), troubleshooting a problem with the packet engine, or resolving issues with other system components. If the problem still exists in bypass mode, that means the problem is not related to the packet engine. Rather, it may be an OS problem.
To enable Bypass mode, hover your mouse over the Zenarmor Engine Pane. This will display engine management buttons on the pane. Click the Enter Bypass button.
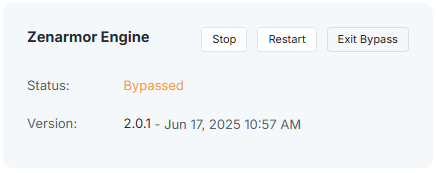
Figure 11. Enabling Bypass Mode for Packet Engine
To exit Bypass mode, click the Exit Bypass button after hovering your mouse over the Zenarmor Engine pane.
Start/Stop/Restart of Zenarmor Engine
You can start/stop/restart the Zenarmor engine service on the dashboard by following the next steps:
- Hover your mouse over the Zenarmor engine pane.
- To stop/start one of the services, click the Stop or Start button in the service pane.
- To restart one of the services, click the Restart button in the engine service pane.
You may also restart the Zenarmor Engine service via Services pane on the Settings page.
Figure 12. Restart of Zenarmor Engine
Viewing Secure Private Networks
By navigating to the Secure Private Networks tab on the Zenarmor endpoint application, you can view your endpoint's secure private network connection status. The following details are available on the Secure Private Networks page.
-
Coordinator Server
-
Relay Server
-
Overlay Networks
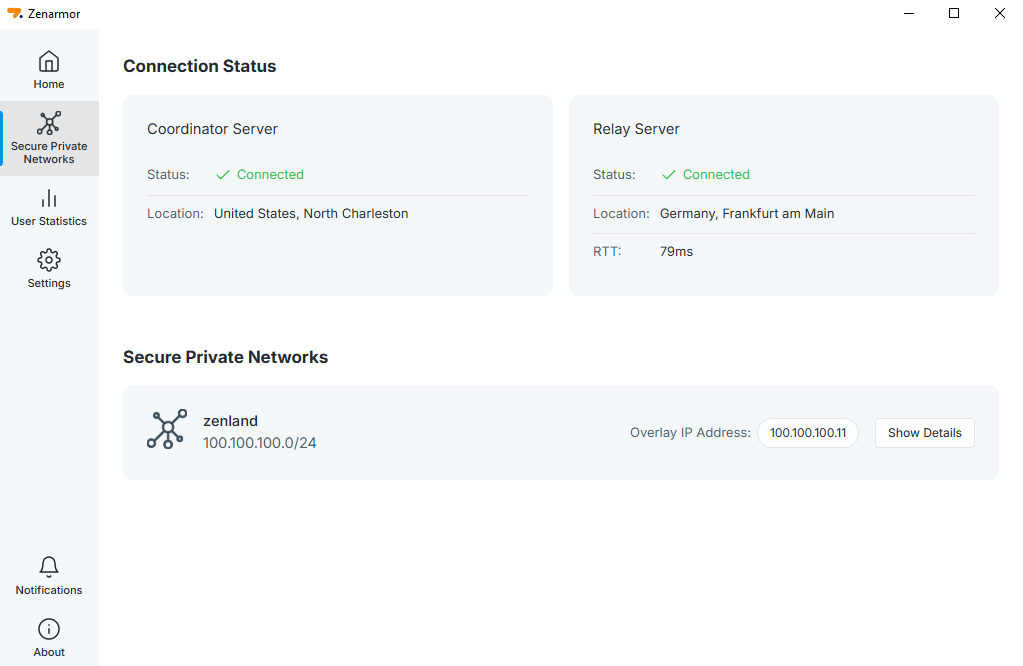
Figure 13. Viewing Secure Private Networks
Viewing Coordinator Server
Zenarmor's coordinator server initiates connections between peers in secure private networks. The details can be viewed in the Coordinator Server pane.
-
Status: This field shows the connection status between your endpoint and the coordinator server. When your endpoint is successfully connected to a secure network, this Status field will display as Connected. If your endpoint fails to connect to the secure private network, it will show as Not Connected.
-
Location: This field displays the location of the Coordinator Server. The Zenarmor coordinator server is located in North Charleston, United States.
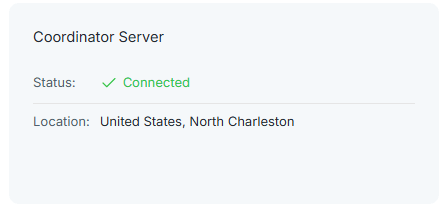
Figure 14. Viewing Coordinator Server
Viewing Relay Server
The Zenarmor relay server behaves as a proxy server between the peers when they cannot communicate with each other directly. In such cases, secure private network peers connect through the nearest Zenarmor relay server. The details can be viewed in the Relay Server pane.
-
Status: This field shows the connection status between your endpoint and the relay server. When your endpoint is successfully connected to a secure network, this Status field will display as Connected. If your endpoint fails to connect to the secure private network, it will show as Not Connected.
-
Location: This field displays the location of the Relay Server. Zenarmor provides 5 relay servers located in different regions of the world, like the United States, Europe, and Asia. Peers should connect to the nearest relay server.
-
RTT: The time the endpoint takes to get a response from the relay server after initiating a network request.
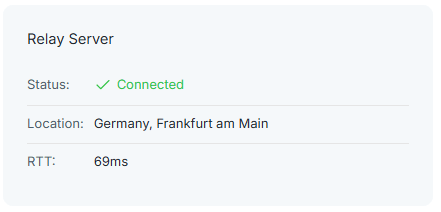
Figure 15. Viewing Relay Server
Viewing Secure Private Networks
You may view the list of secure private networks that your endpoint connected to and their details on the Secure Private Networks pane. Secure Private Networks pane displays the following details.
- Secure Private Network Name: The name of the secure private network is displayed.
- Secure Private Network IP Range: The IP address range used for the overlay network is displayed under the name of the overlay network.
- Overlay IP Address: The secure private network IP address of the endpoint is displayed.
Viewing Secure Private Networks Details
Secure Private Networks page allows you to view the status of the connections between your endpoint and other peers in a secure private network. You may view the secure private network details by following the next steps.
- Navigate to Secure Private Networks page of Zenarmor endpoint application..
- Click on the Show Details button next to the secure private network. This will display all peers in the secure network along with their connection status to your endpoint. Listed peer details are as follows.
- Peer: This field displays the name of the peer.
- Connection Status: This field displays the status of the connection between your endpoint and the peer. When they are connected, the duration of the active connection appears.
- RTT (Round Trip Time): The time endpoint takes to get a response from the peer initiating a network request.
- Connection Type: Connection type between the peers. Available transport types are as follows.
- Relay: Peers communicate with each other via a relay server hosted by Zenarmor.
- P2P: Peers directly communicate with each other over an encrypted tunnel.
- Local: Peers have a LAN connection between each other and communicate via this local network
-
Location: Geo IP location of the peer.
-
IP Address: Overlay IP address of the peer.
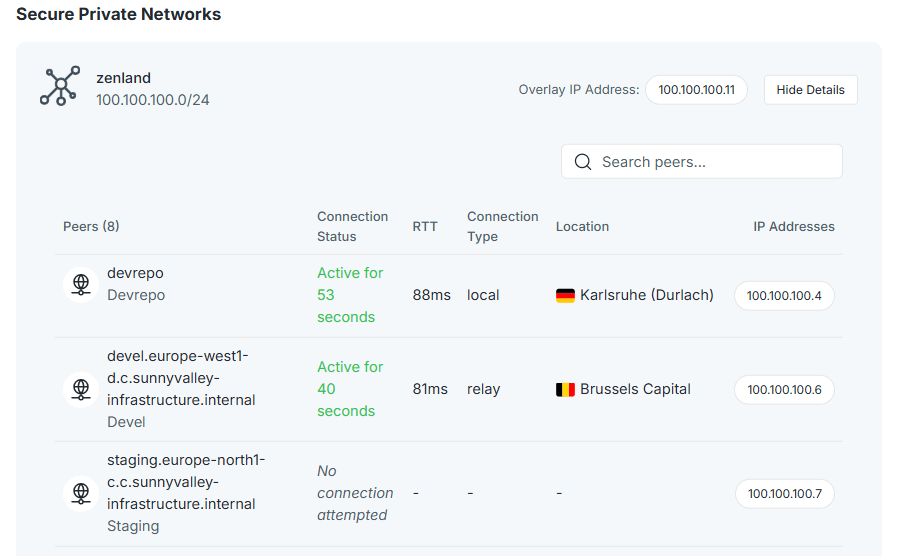
Figure 16. Viewing Secure Private Networks Details
Viewing User Statistics
The Zenarmor endpoint application allows you to view the statistics about the network connections of your endpoint device.
By navigating to the User Statistics tab on the Zenarmor endpoint application, you can view the following charts.
-
Your Most Used Apps
-
Top Remote Hosts
-
Top Detected Threats
-
Top Blocked & Reasons
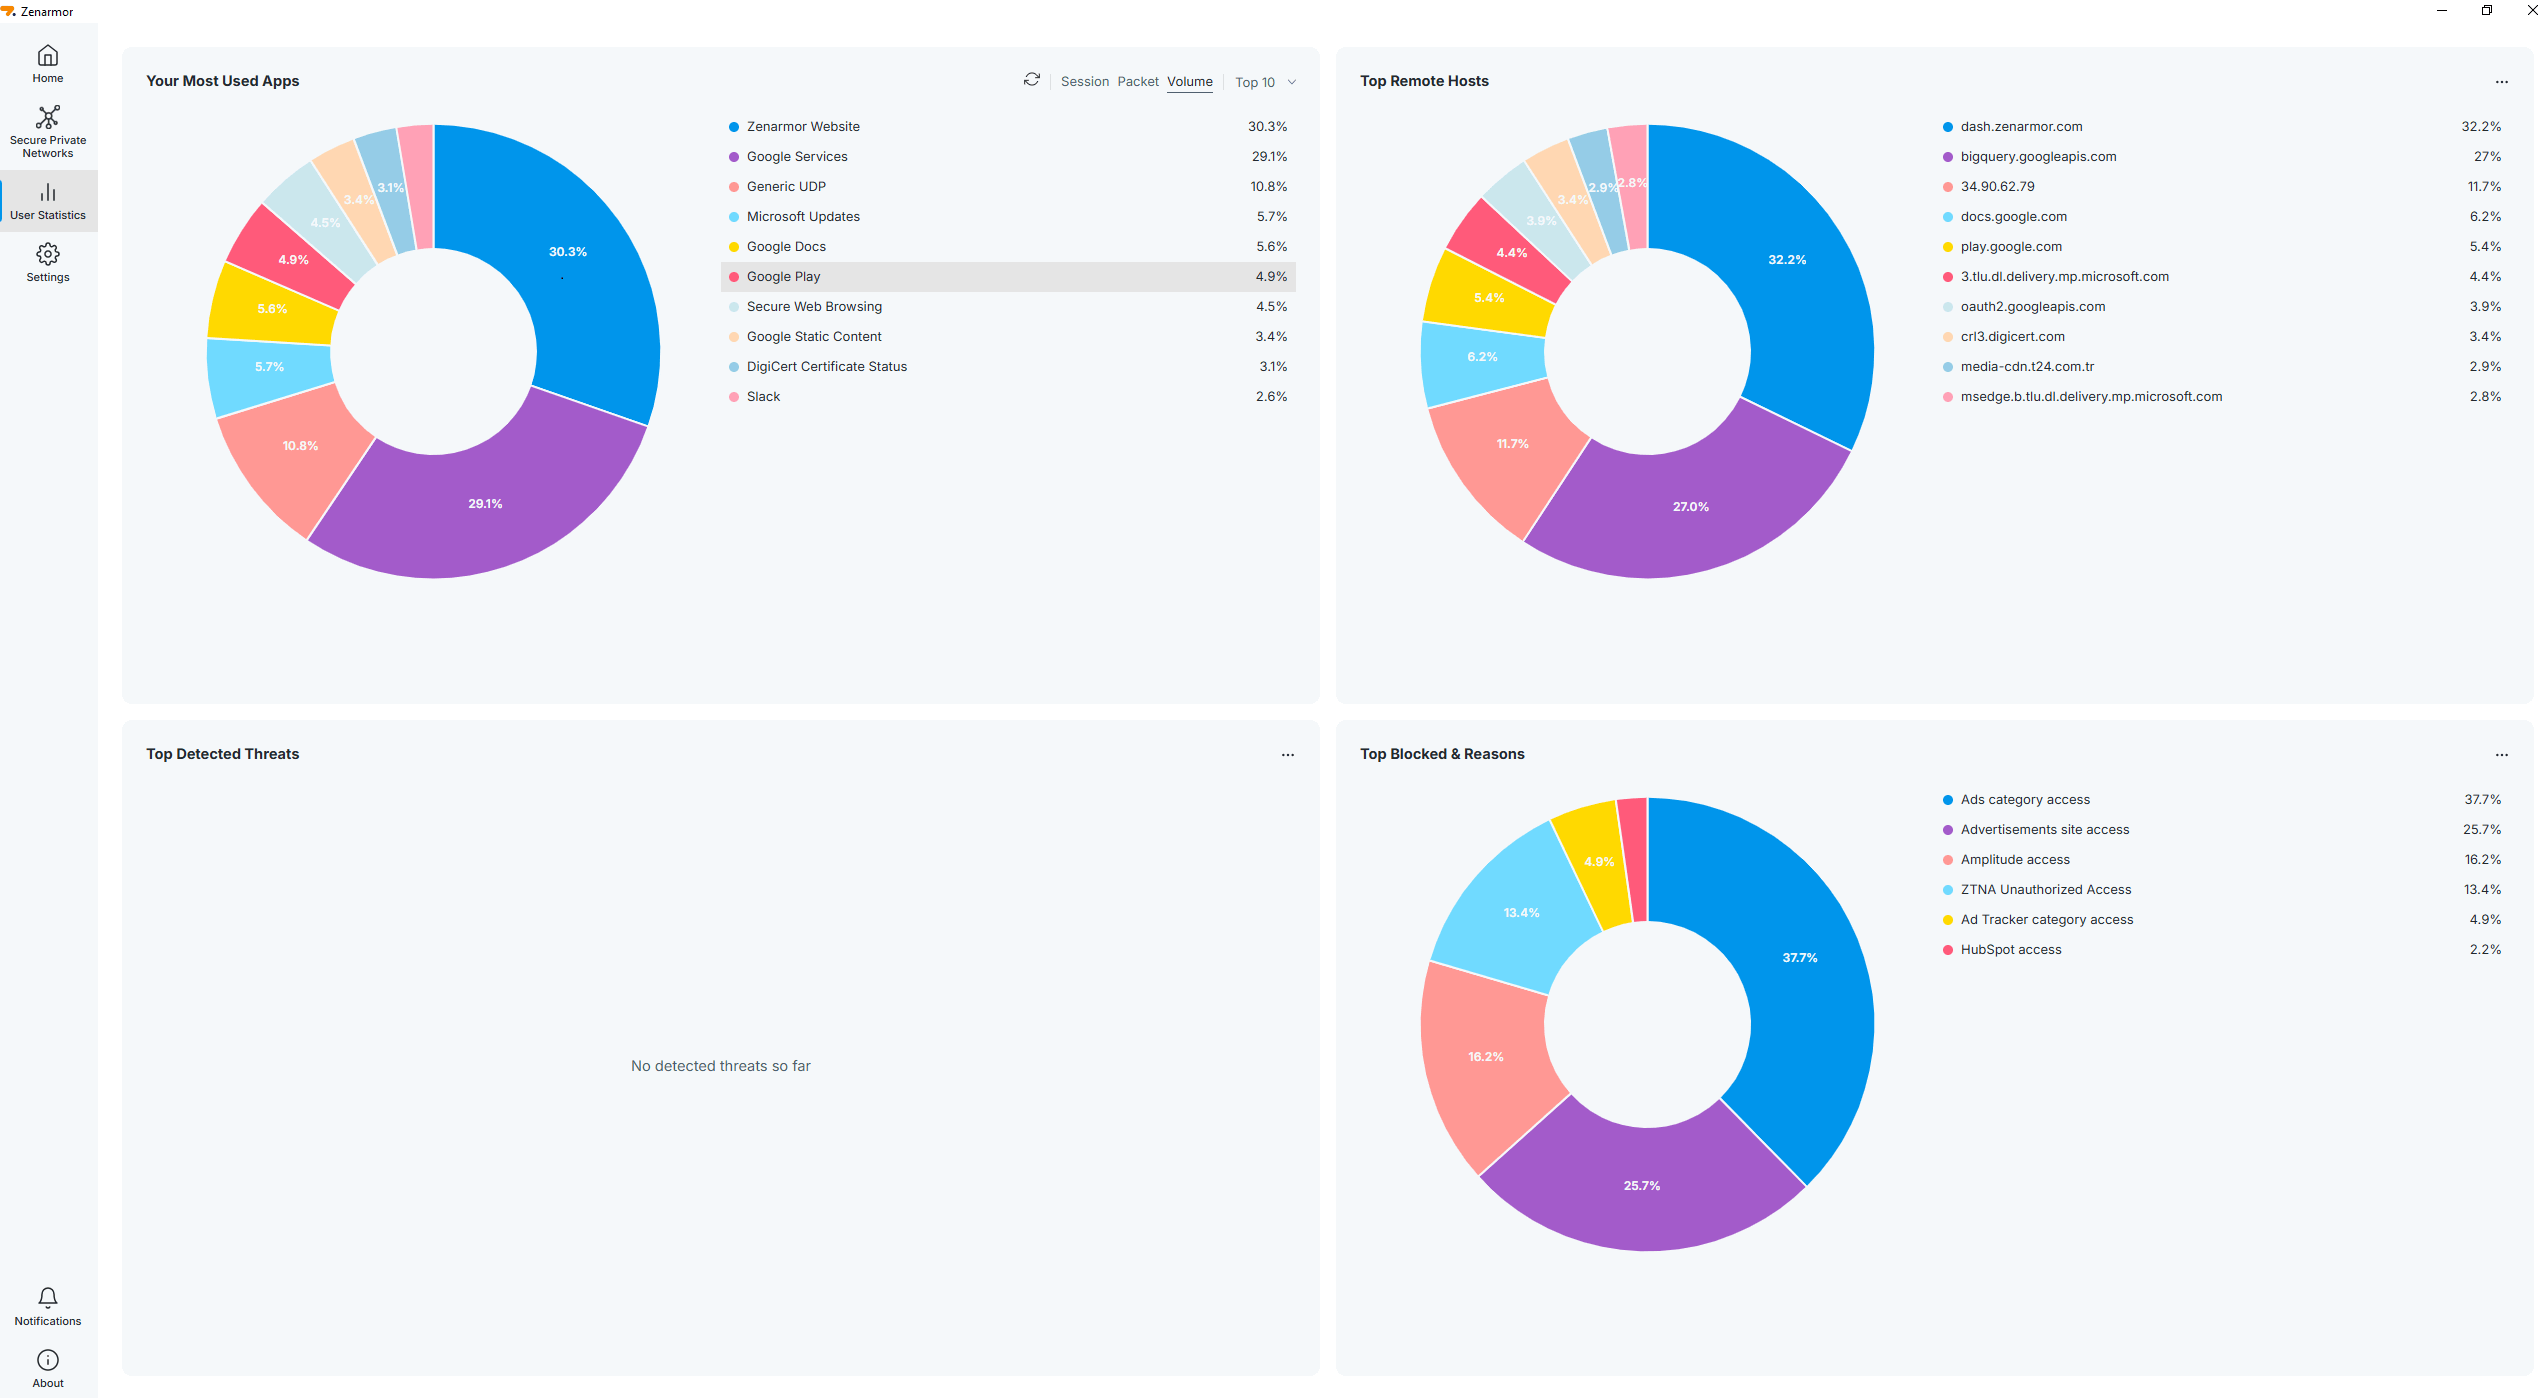
Figure 17. Viewing User Statistics
Refreshing Charts
You may manually refresh the charts on the User Statistics page of the Zenarmor endpoint application by following the next steps.
-
Hover your mouse over the chart that you want to refresh. This will display a configuration bar at the top right of the chart.
-
Click on the Refresh button. This will automatically reload the user statistics of your endpoint.
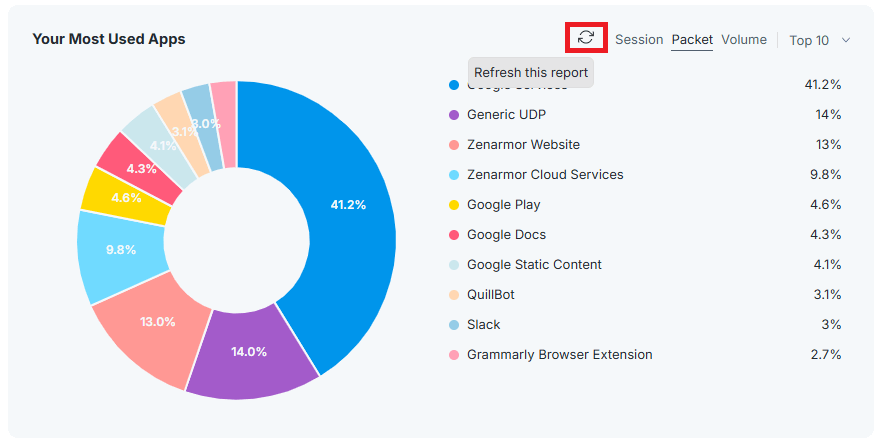
Figure 18. Refreshing Charts
Selecting Reporting Metric
You can choose the metrics used to generate the reports. Would you like to see the total number of sessions created, the number of packets transmitted, or the volume of bytes transferred? The available reporting metrics are as follows:
- Sessions: Total number of connections/transactions
- Packets: Total number of packets
- Volume: Total number of bytes
To customize your reports, select the reporting criteria in the top right-hand corner. Follow the next steps to choose the specific information you want to view.
-
Hover your mouse over the chart that you want to update. This will display a configuration bar at the top right of the chart.
-
Click on the reporting criteria that you want to view, such as Packet. This will automatically reload the user statistics of your endpoint.
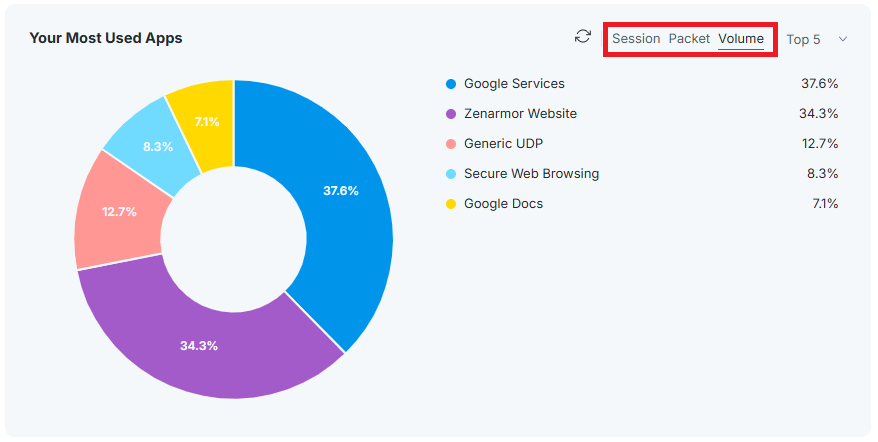
Figure 19. Selecting Reporting Metric
Selecting Record Size
You may specify the record size of the reports by following the next steps.
-
Hover your mouse over the chart that you want to update. This will display a configuration bar at the top right of the chart.
-
Selecting available options in the Record Size drop-down menu at the top of the page.
- Top 5
- Top 10
- Top 25
- Top 50
- Top 100
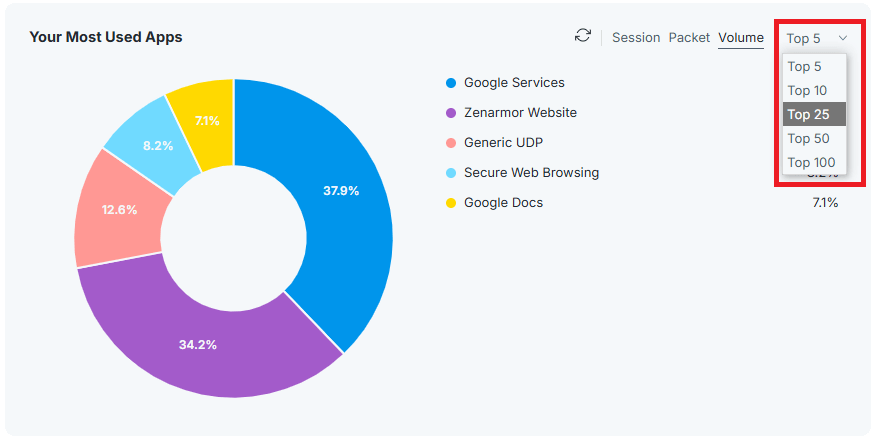
Figure 20. Selecting Record Size
Viewing Notifications
By navigating to the Notifications page on the Zenarmor endpoint application, you may view the following details about the event logs.
-
Date: Time of the event that occurs.
-
Title: Gives a comprehensive description of the event.
-
Message: Details of the event log.
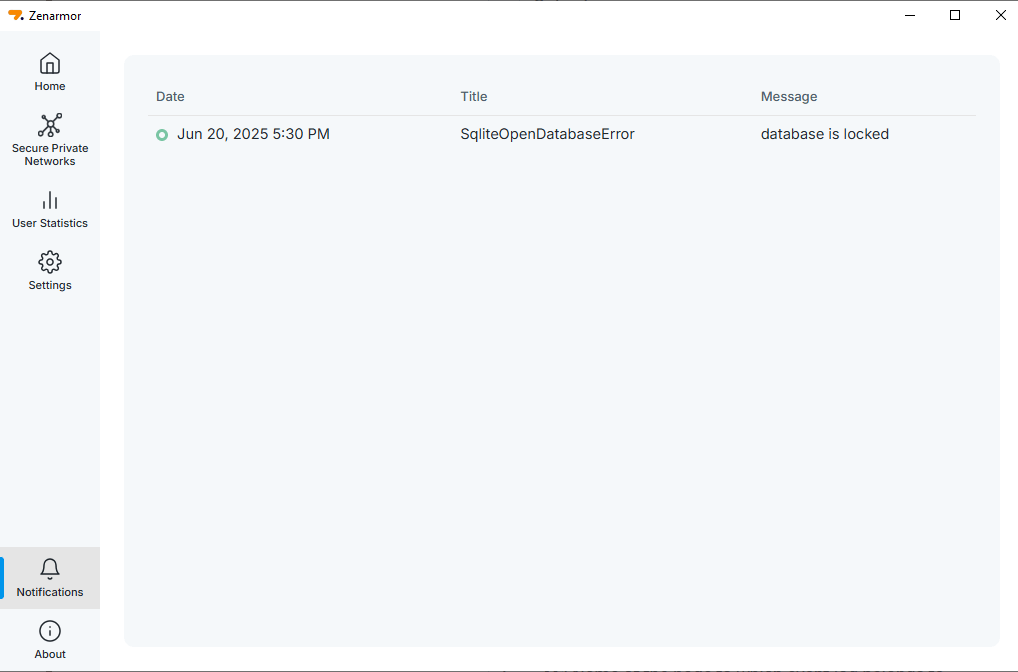
Figure 21. Viewing Notifications
Viewing & Updating Version
You may easily view and update your Zenarmor endpoint application by navigating to the About page. You will see the Application Version at the top left of the page.
To update the Zenarmor endpoint application, click the Check Update button at the top right of the About page. A dialog box will appear if a new version of the application is available. Click OK to update your endpoint application.
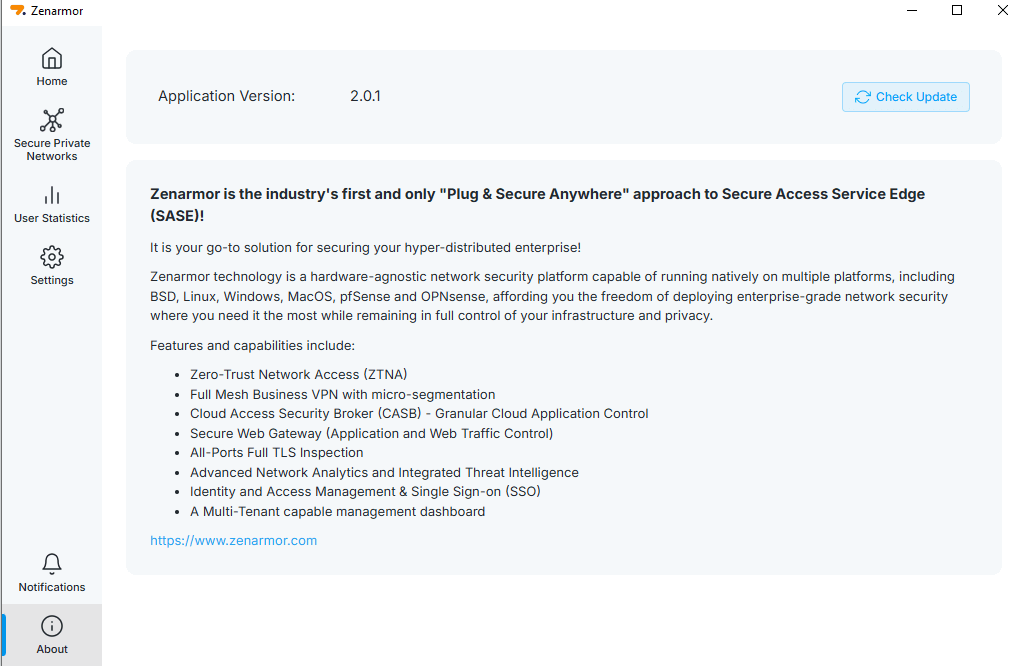
Figure 22. Viewing & Updating Version
Logging out
You may easily sign out of your endpoint application from your organization by following the next steps.
-
Go to the Settings page in the Zenarmor endpoint application. In the User Credentials pane, you will see the Email address of the user who has already logged into the organization, as well as the Organization name associated with the endpoint.
-
Click the Logout button. A dialog box appears for confirmation.
-
Click Logout to remove the endpoint from the associated organization.
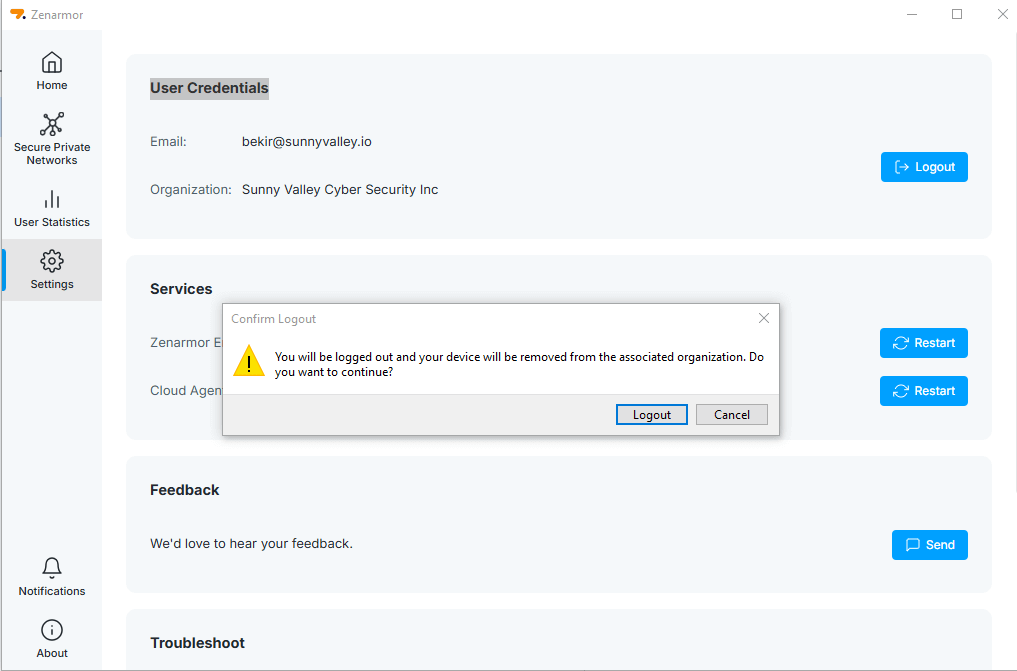
Figure 23. Logging out
Troubleshooting
For troubleshooting purposes, you may set the logging level on the Zenarmor endpoint application by following the next steps.
-
Navigate to the Settings page in the Zenarmor endpoint application.
-
Select the Log Level depending on your requirement from the Log Level drop-down menu. The default level is Info.
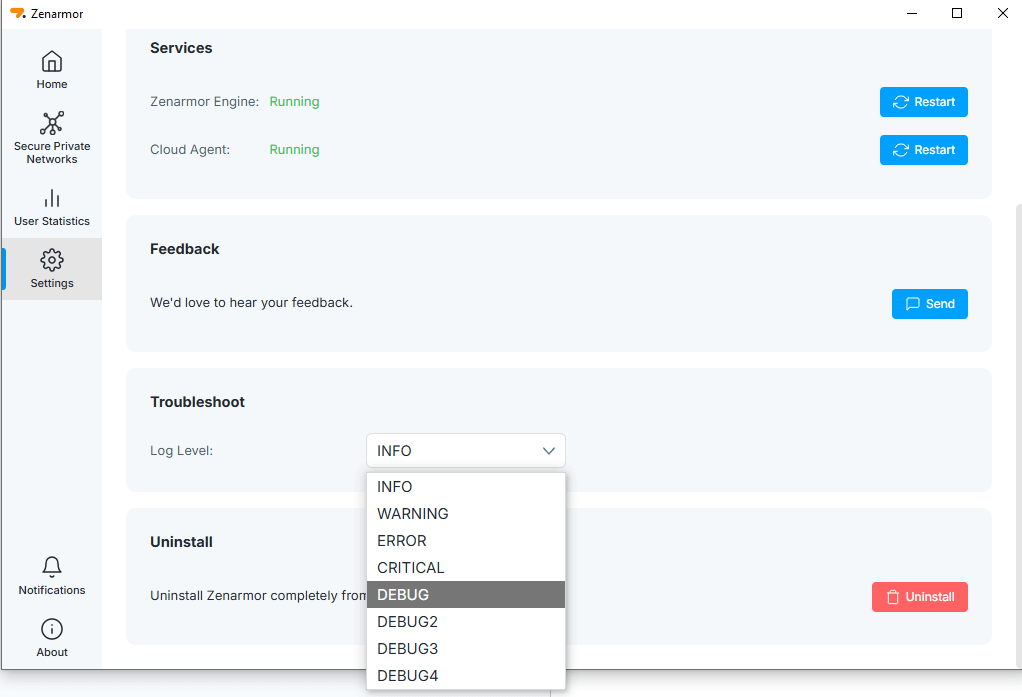
Figure 24. Setting Log Level on Endpoint
This will update logging settings on your endpoint application.
-
Click OK to close the notification window.
Log Levels
There are 5 types of Log levels on the Zenarmor endpoint application. These log levels are listed below.
-
INFO: the standard log level indicating that something happened, the application entered a certain state.
-
CRITICAL: tells that the application encountered an event or entered a state in which one of the crucial business functionality is no longer working.
-
ERROR: tells that the application hits an issue preventing one or more functionalities from properly functioning.
-
WARNING: indicates that something unexpected happened in the application, a problem, or a situation that might disturb one of the processes. But that doesn't mean that the application failed.
-
DEBUG: DEBUG log level should be used for information that may be needed for diagnosing issues and troubleshooting. There are 4 levels available for debugging purposes:
- DEBUG
- DEBUG2
- DEBUG3
- DEBUG4
Uninstalling
You may easily uninstall Zenarmor endpoint application from your device by following the next steps.
-
Navigate to the Settings page in the Zenarmor endpoint application.
-
Click Uninstall button on the Uninstall pane.
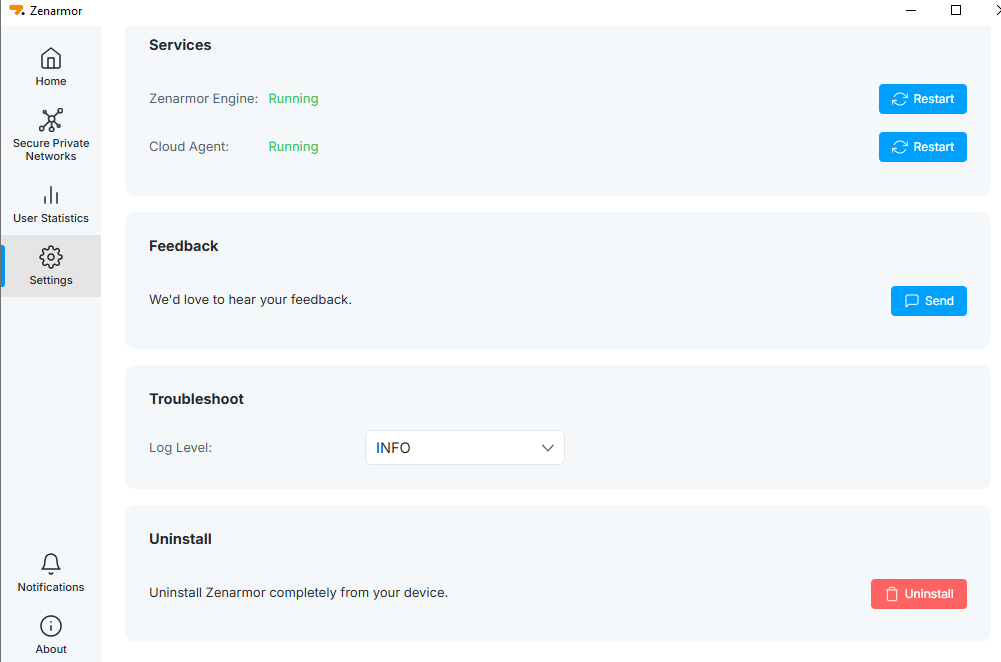
Figure 25. Uninstalling Endpoint