Accessing Organization Dashboard
The Organization Dashboard provides a bird’s-eye view of all your connected firewalls and endpoints in an organization, displaying a global threats overview, detected and blocked threats, top detected devices and users, and the top bandwidth consumer hosts and users.
You may access your organization's dashboard and begin managing it using the steps below.
-
Login to Zenconsole. Once logged in, you will see the default organization displayed at the top navigation bar.
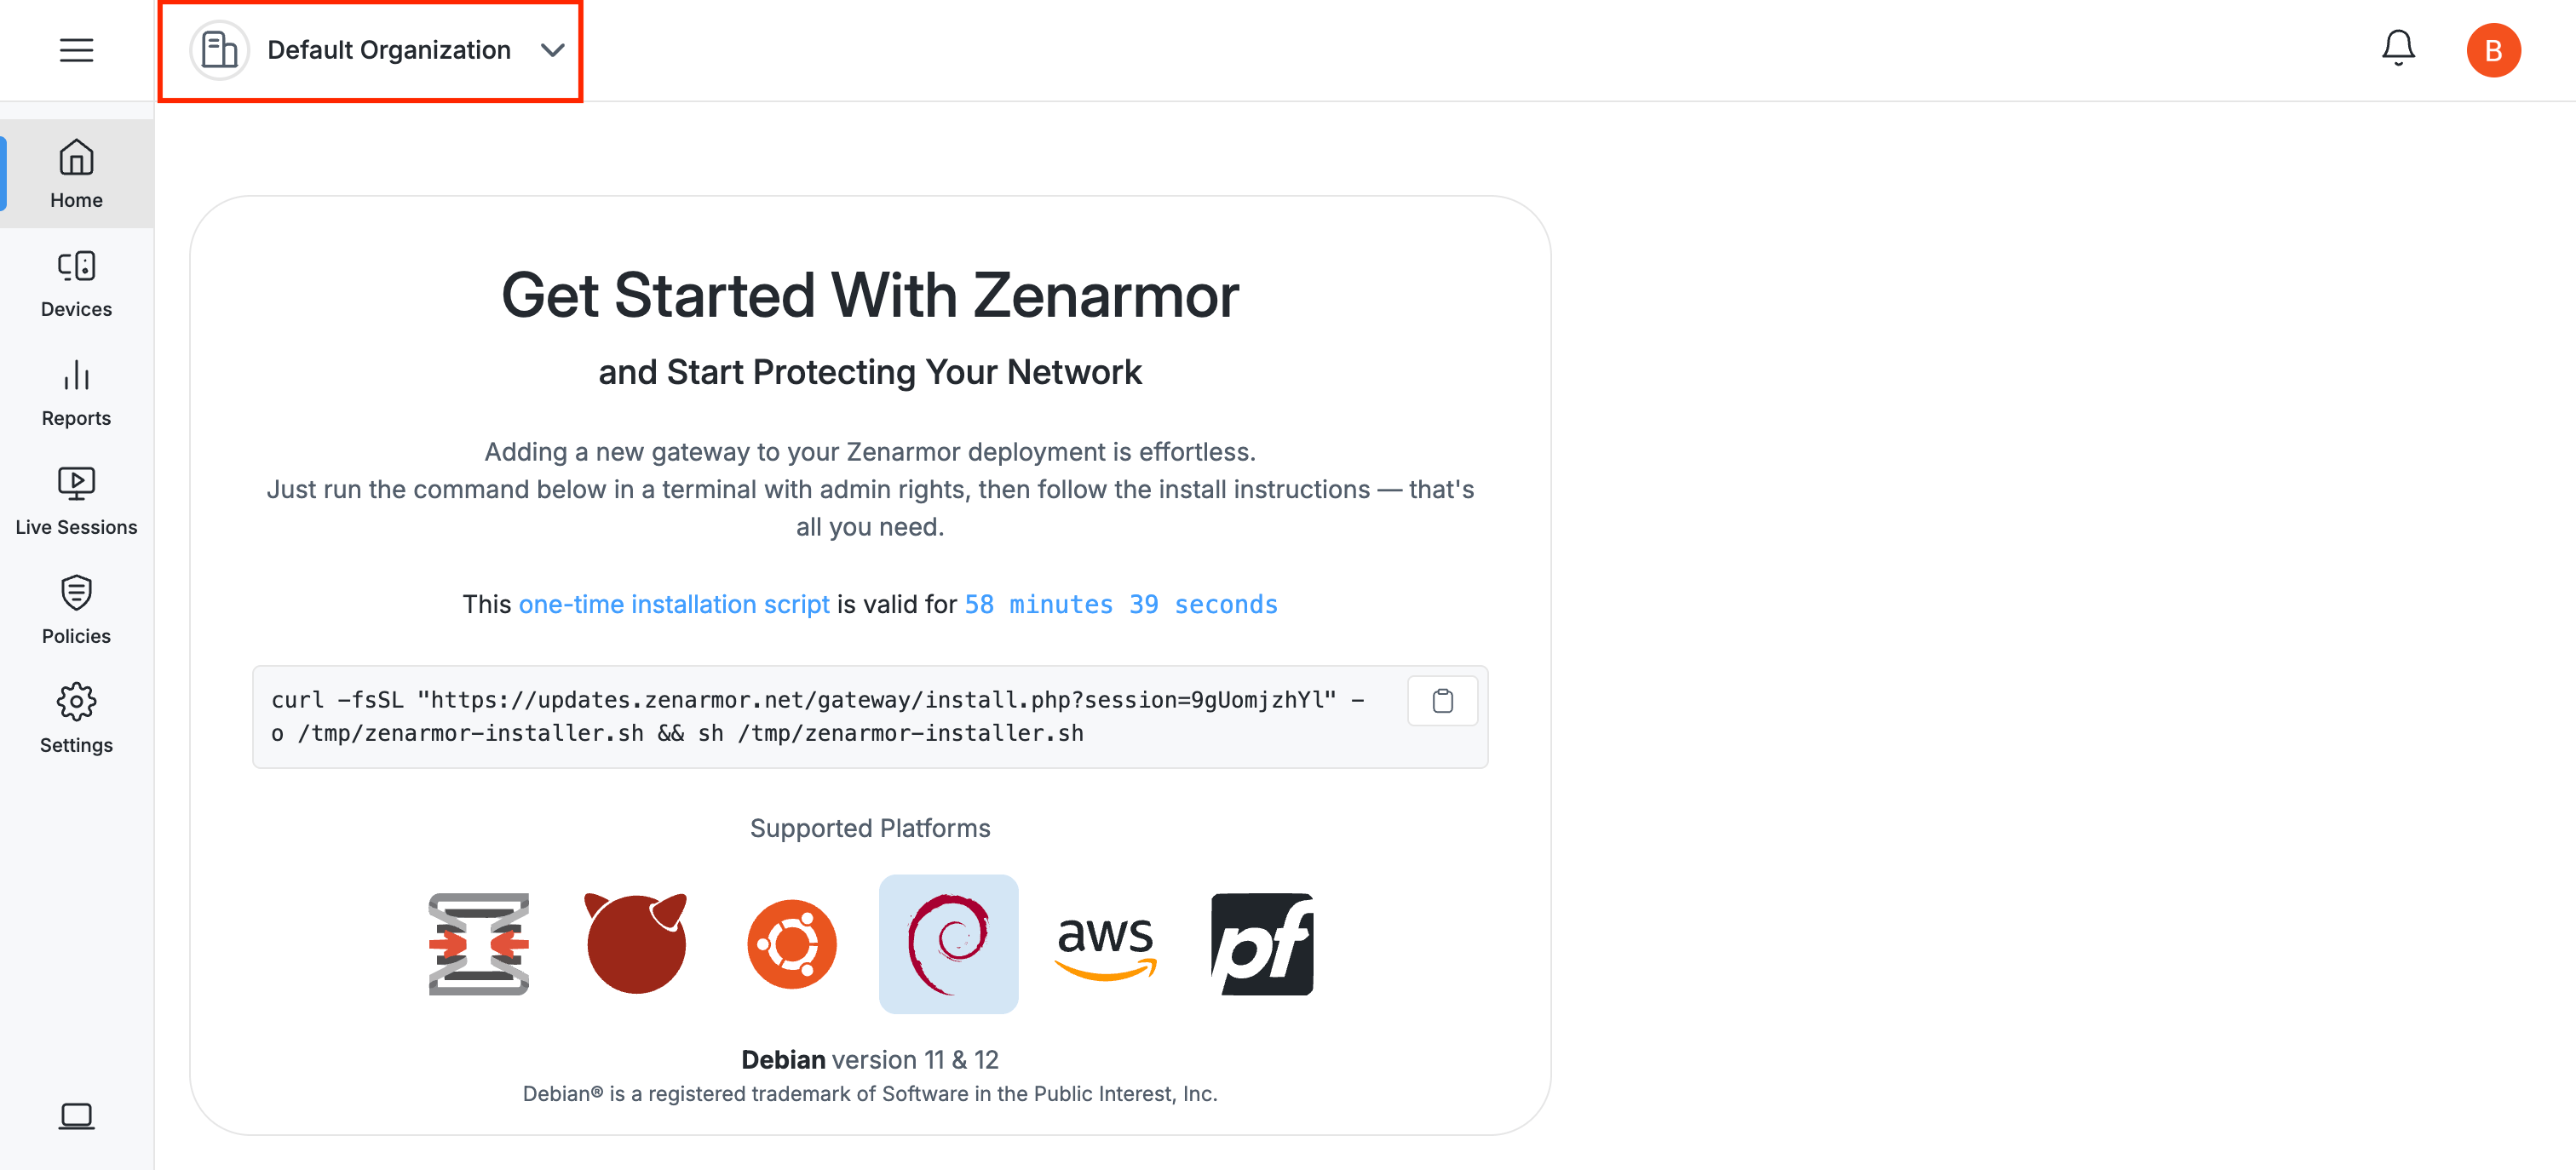
Figure 1. Default Organization
-
Switch between organizations: Click on the organization name at the top bar. A drop-down list of all available organizations linked to your account will appear.
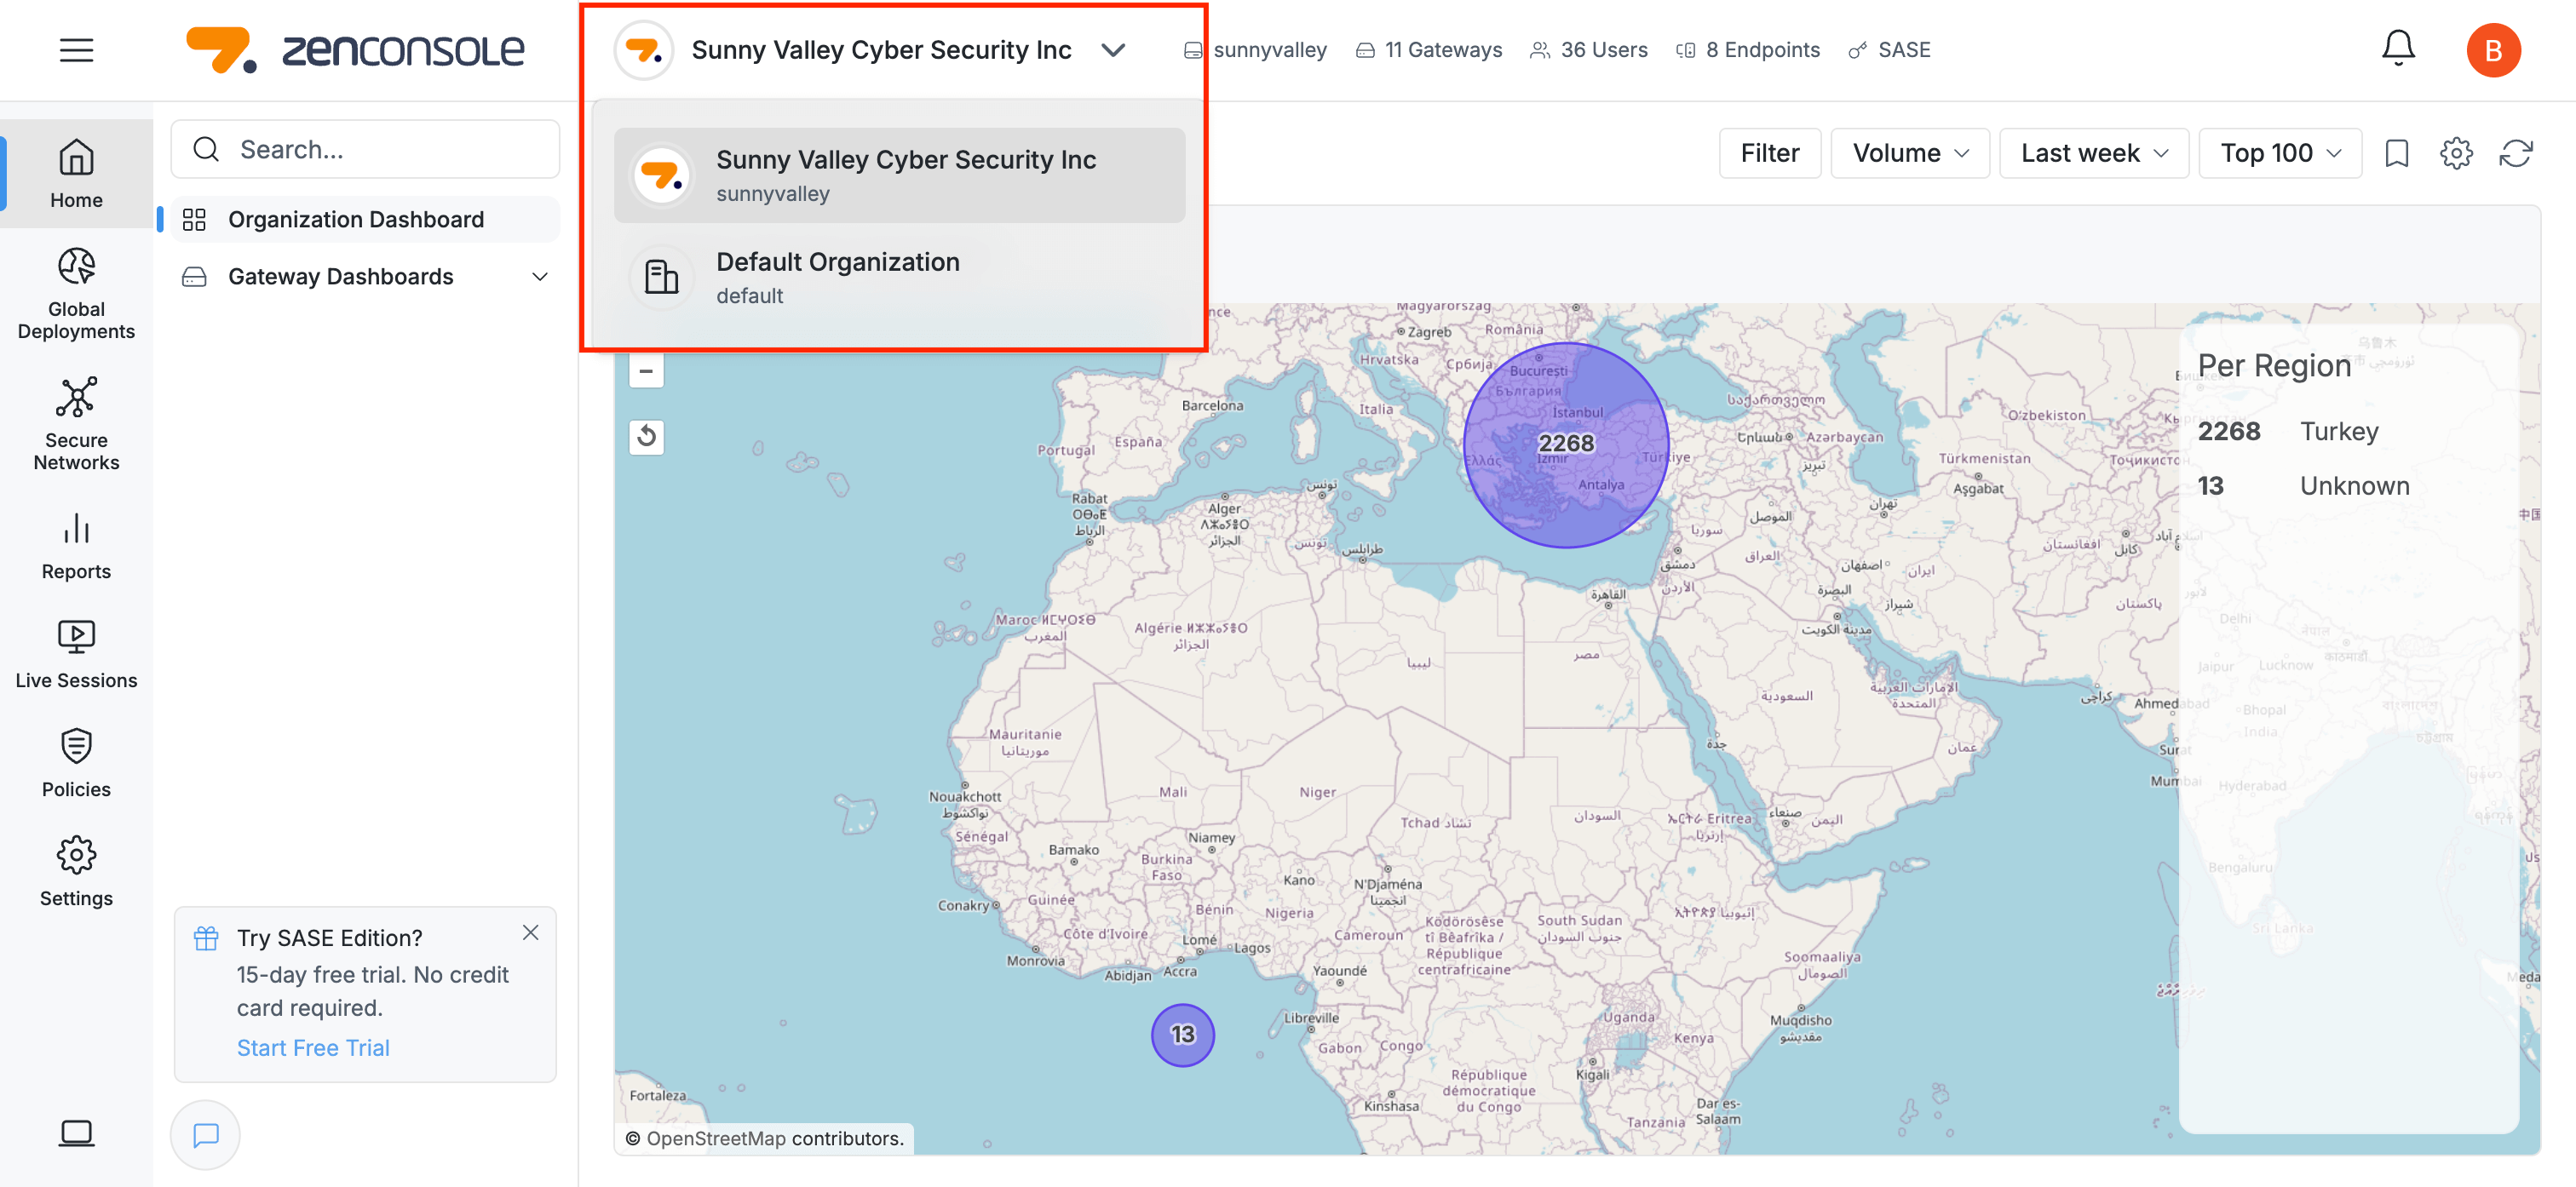
Figure 2. Accessing Organization Dashboard
-
Select the organization you want to manage. By clicking on the desired organization from the drop-down list, the dashboard will reload and display the selected organization’s data.
-
(Optional)If the Organization Dashboard does not open automatically, or if you need to return to it later, navigate to
Home→Organization Dashboardfrom the left sidebar.
The default organization displays all Zenarmor nodes that are not associated with any specific organization.
Organization Dashboard Components
The Organization Dashboard consists of the following areas:
-
Organization Information Bar
-
Reporting Configuration Bar
-
Global Threats Overview
-
Top Pie Charts
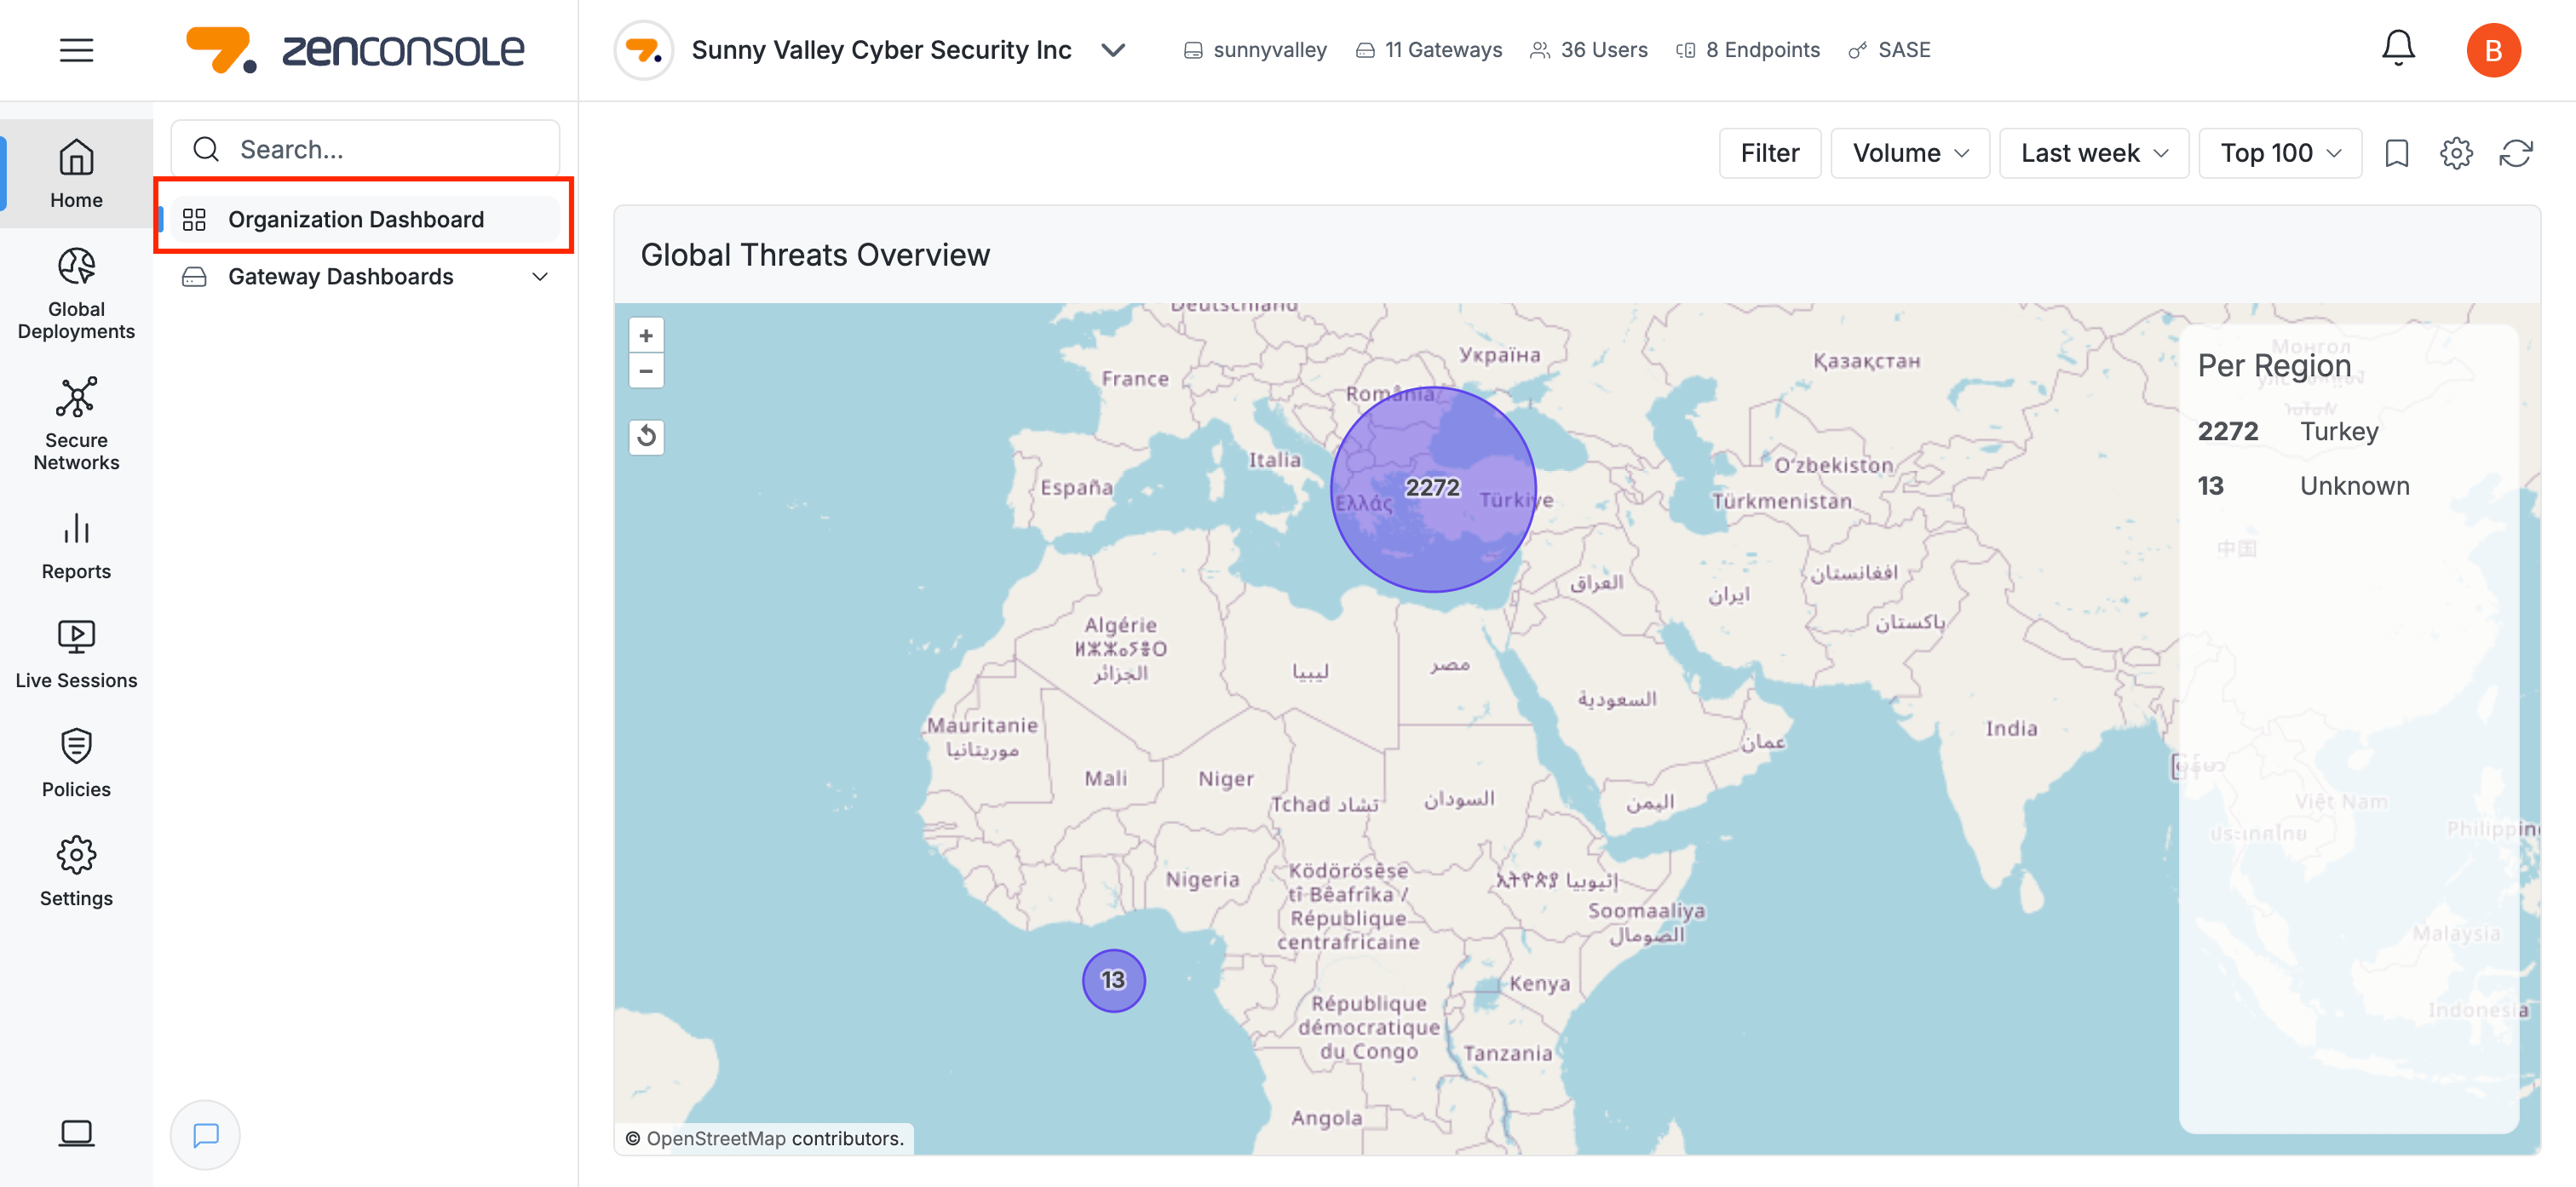
Figure 3. Organization Dashboard
Organization Information Bar
The Organization Information Bar located at the top of the organization page on Zenconsole, displays the following details:
-
Organization Name(e.g., Sunny Valley Cyber Security Inc)
-
Organization Domain (e.g., Sunny Valley Cyber Security Inc)
-
Number of Gateways registered to the organization
-
Number of Users added to the organization
-
Number of Endpointsregistered to the organization
-
Subscription Type (e.g., SASE)

Figure 4. Organization Information Bar
Reporting Configuration Bar
You can configure the Organization Dashboard reports by using the Reporting Configuration Bar located at the top right of the dashboard. This bar allows you to filter and customize the displayed data according to your needs.
The following options are available:
-
Filter: Opens the filter panel where you can hide/show specific types of connections, include/exclude inbound or outbound traffic, and add custom filters.
-
Volume: Select how threats or traffic data will be measured (e.g., by volume).
-
Time Range: Choose the time interval for reporting (e.g., last 6 hours, last 24 hours).
-
Top N: Limit the results to the top 10, top 20, etc.
-
Saved Filters: The feature allows you to save your current filter configuration and reuse it later for quicker access.
-
Setting: Switch between 12-hour and 24-hour time formats (timezone is displayed but cannot be changed)
-
Refreshing the View: Manually reload the data displayed on the Global Threats Overview map.

Figure 5. Reporting Configuration Bar
You may find more information about available reporting criteria and how you can view or configure reporting criteria on Report View Configuration page.
Global Threats Overview
The Global Threats Overview pane displays the Zenarmor-detected threats associated with your organization on a map. This feature allows you to interactively explore and obtain information about detected threats across different regions. The total number of detected threats for each region is displayed in a purple circle. You can see the total number of detected threats per region at a glance, and use the tools at the top of the pane to filter or adjust the displayed data.
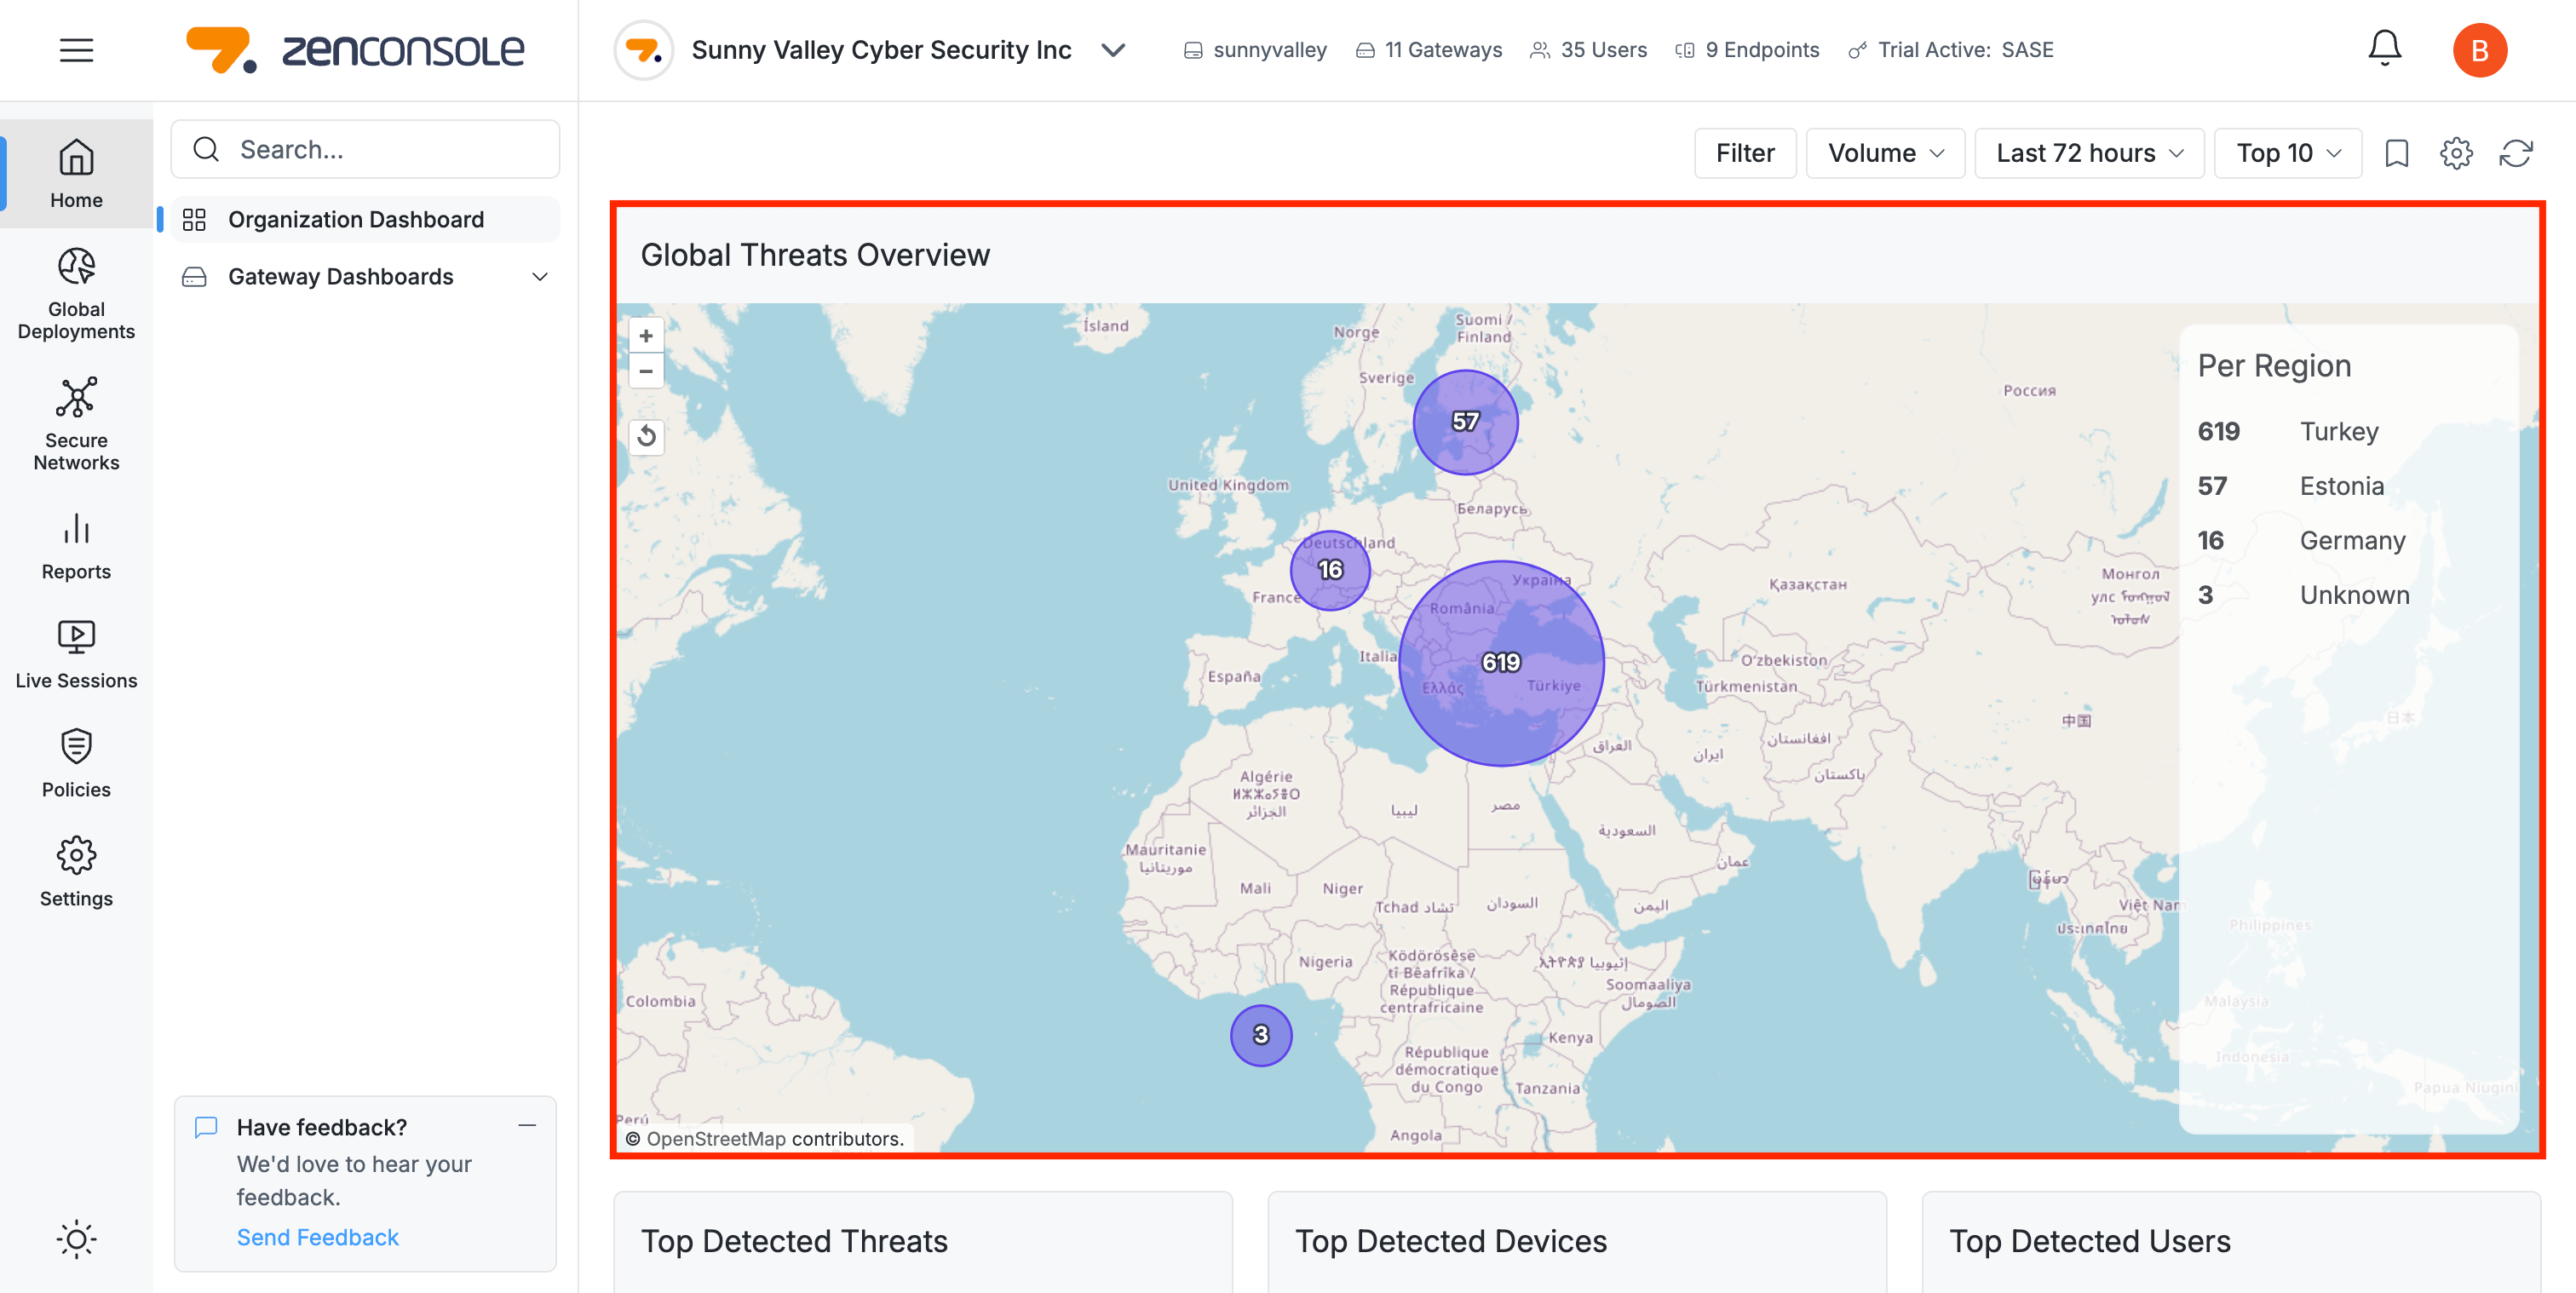
Figure 6. Global Threats Overview
You may perform the following tasks on the Global Threats Overview map:
-
Exploring the map
-
Viewing Threat Clusters
-
Viewing Threats Per Region
Exploring the Map
You may easily navigate on the Global Threats Overview map by performing the following operations:
-
Zoom-in: Zoom in on the map by clicking the zoom-in button with the
+icon at the top left of the map or by scrolling the mouse wheel. -
Zoom-out: Zoom out on the map by clicking the zoom-out button with the
-icon at the top left of the map or by scrolling the mouse wheel. -
Wider-view: Click the Fit to extent button with the refresh icon for a wider view.
-
Navigate: Drag and drop with your mouse to move around the map.
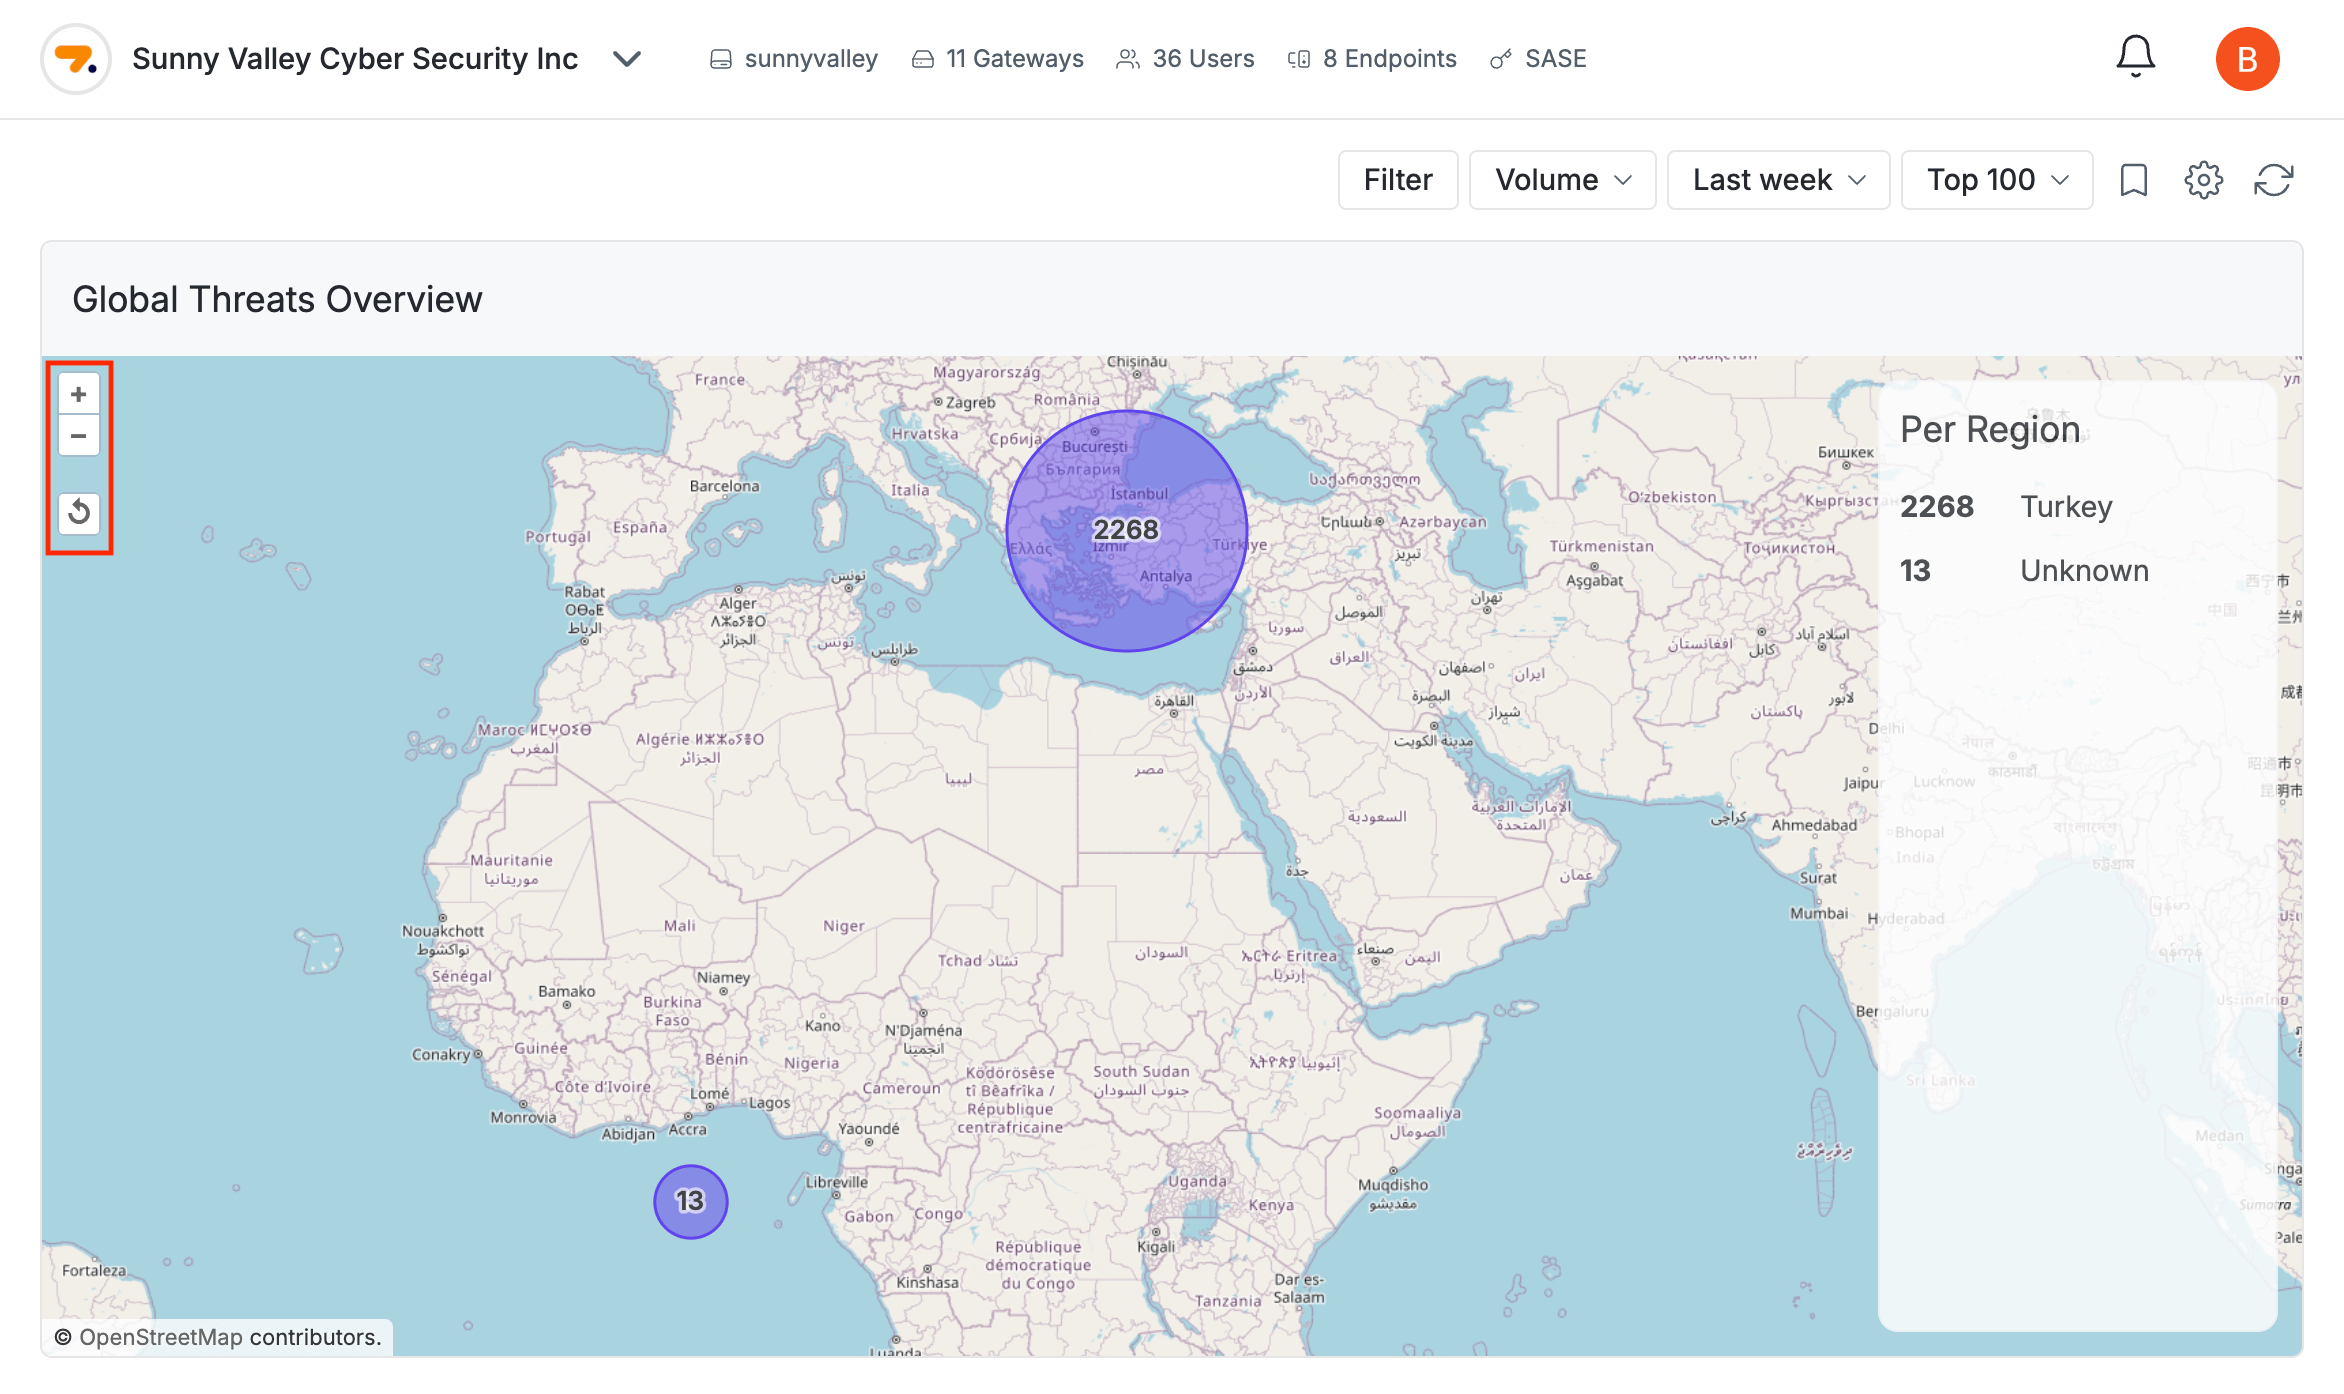
Figure 7. Exploring Global Threats Overview Map
Viewing Threat Clusters
As you zoom in on the Global Threats Overview map, the purple threat clusters automatically break down into smaller clusters or individual points. This allows you to explore more detailed threat data within specific geographic regions.
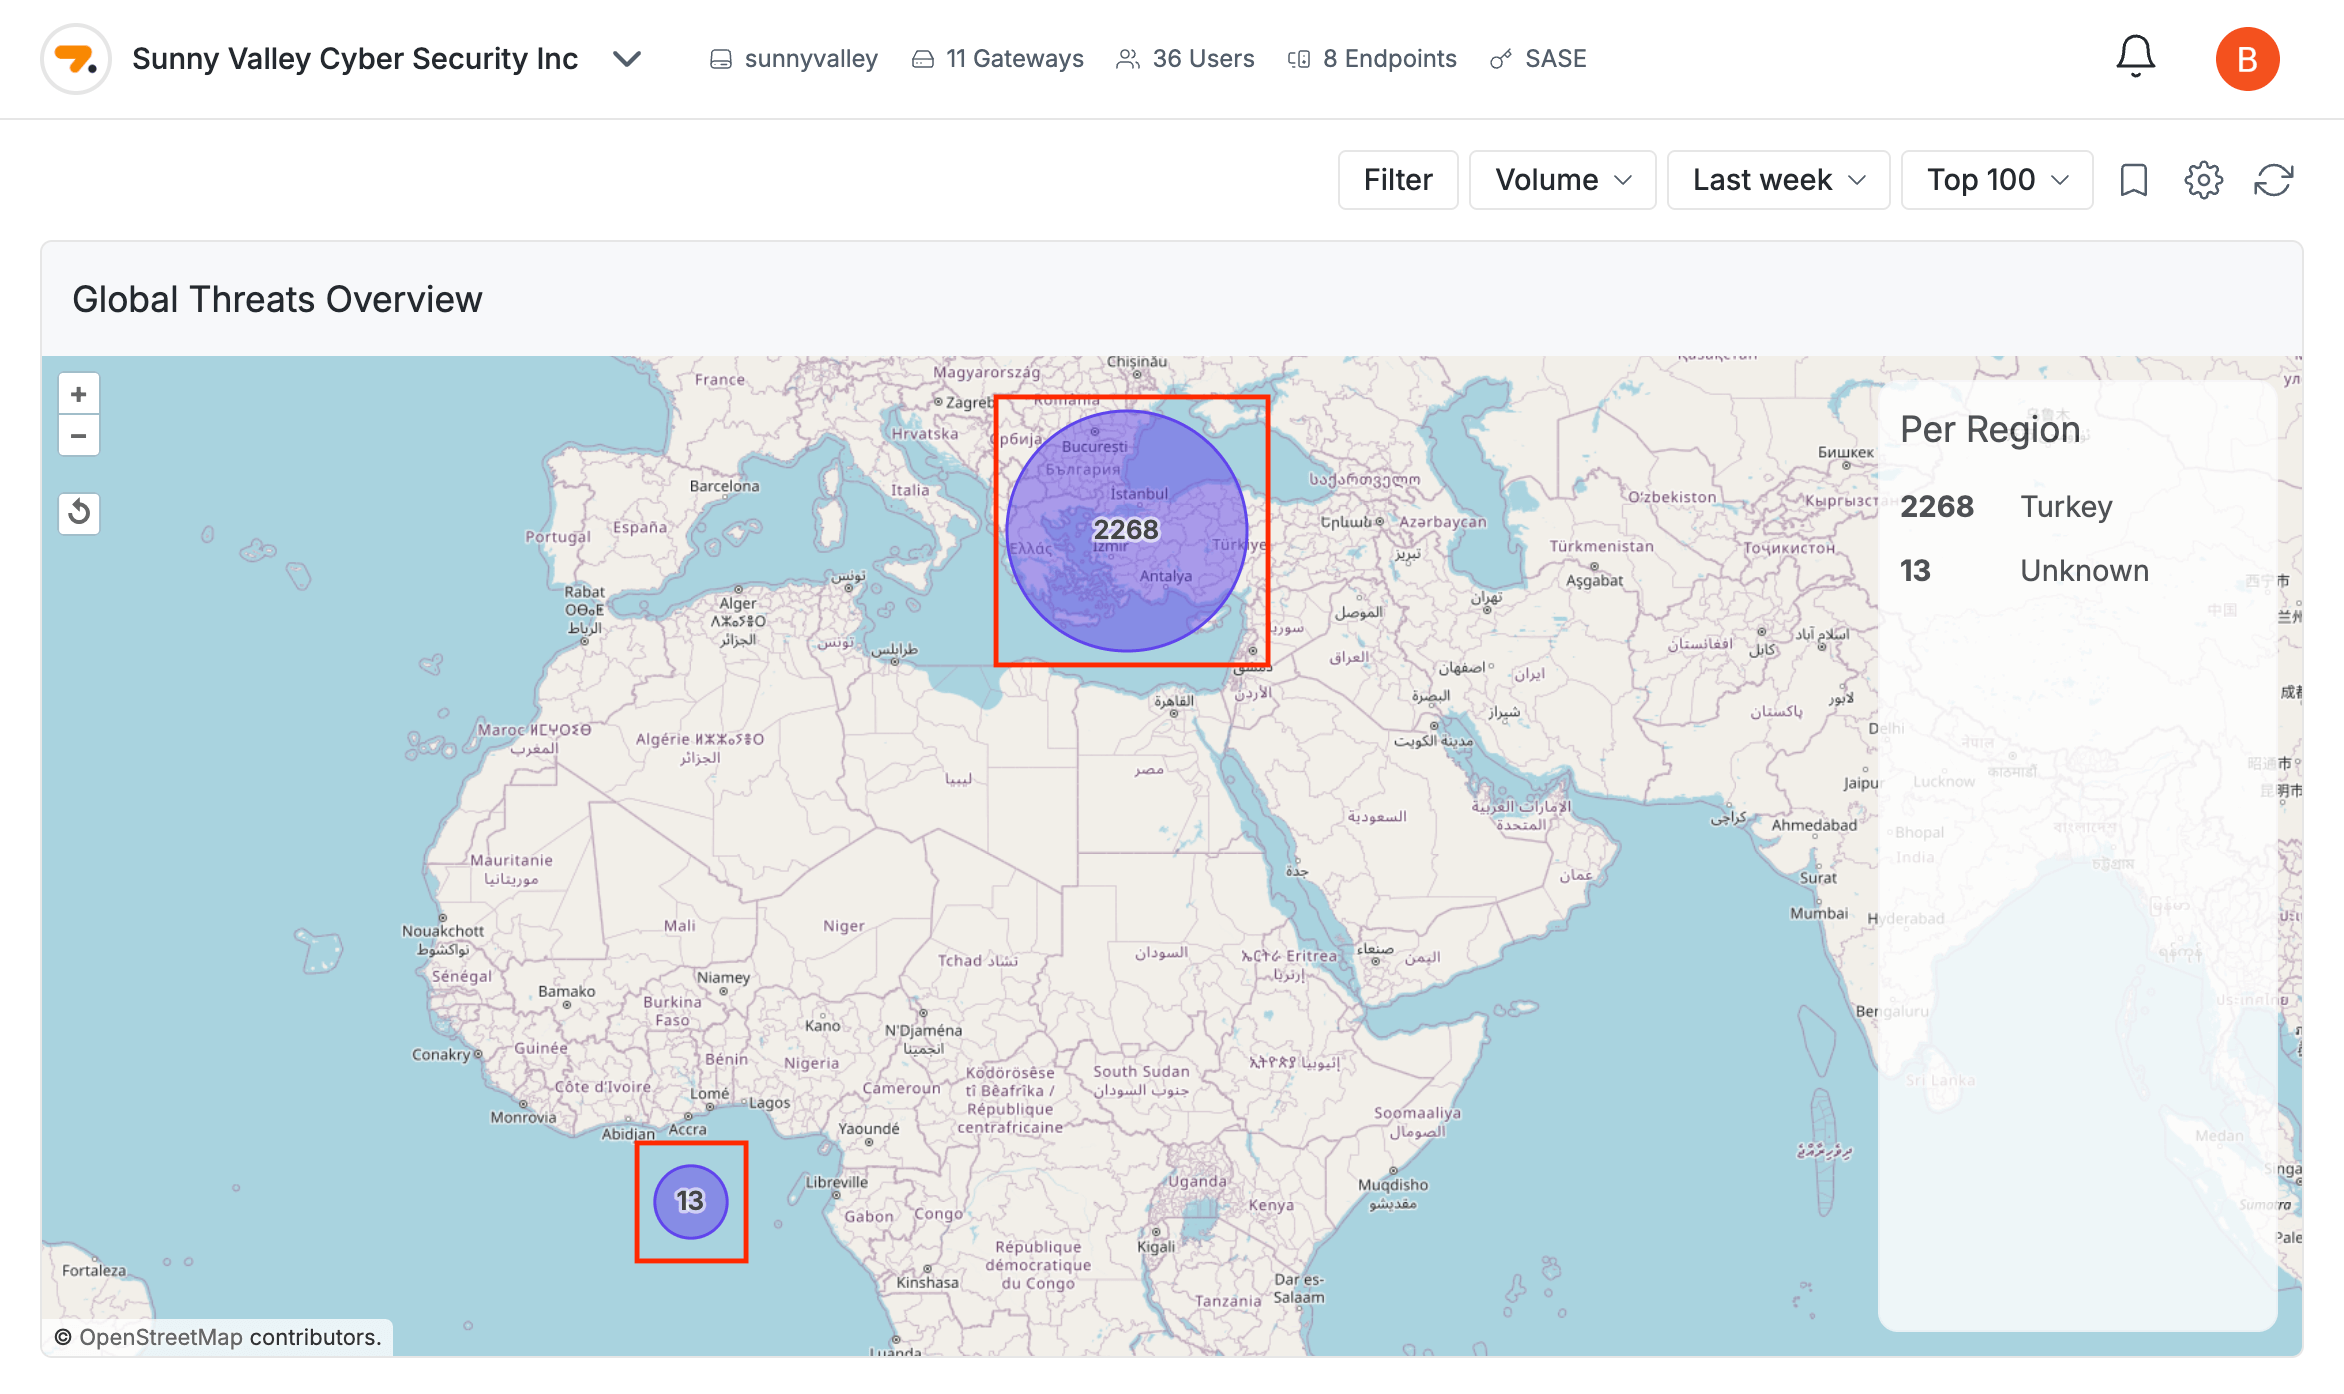
Figure 8. Viewing Global Threats Clusters
Viewing Threats Per Region
As you zoom in on the Global Threats Overview map, detected threats are grouped and displayed as circles positioned over the corresponding regions. The number inside each circle represents the total number of detected threats in that region.
When a region is selected, the Per Region panel appears on the right side of the map. This panel lists the following details:
-
Region Name: The geographic region (e.g., Turkey, Germany, Unknown).
-
Threat Count: The total number of detected threats in that region.
This view allows you to quickly compare the threat distribution across different regions at a glance.
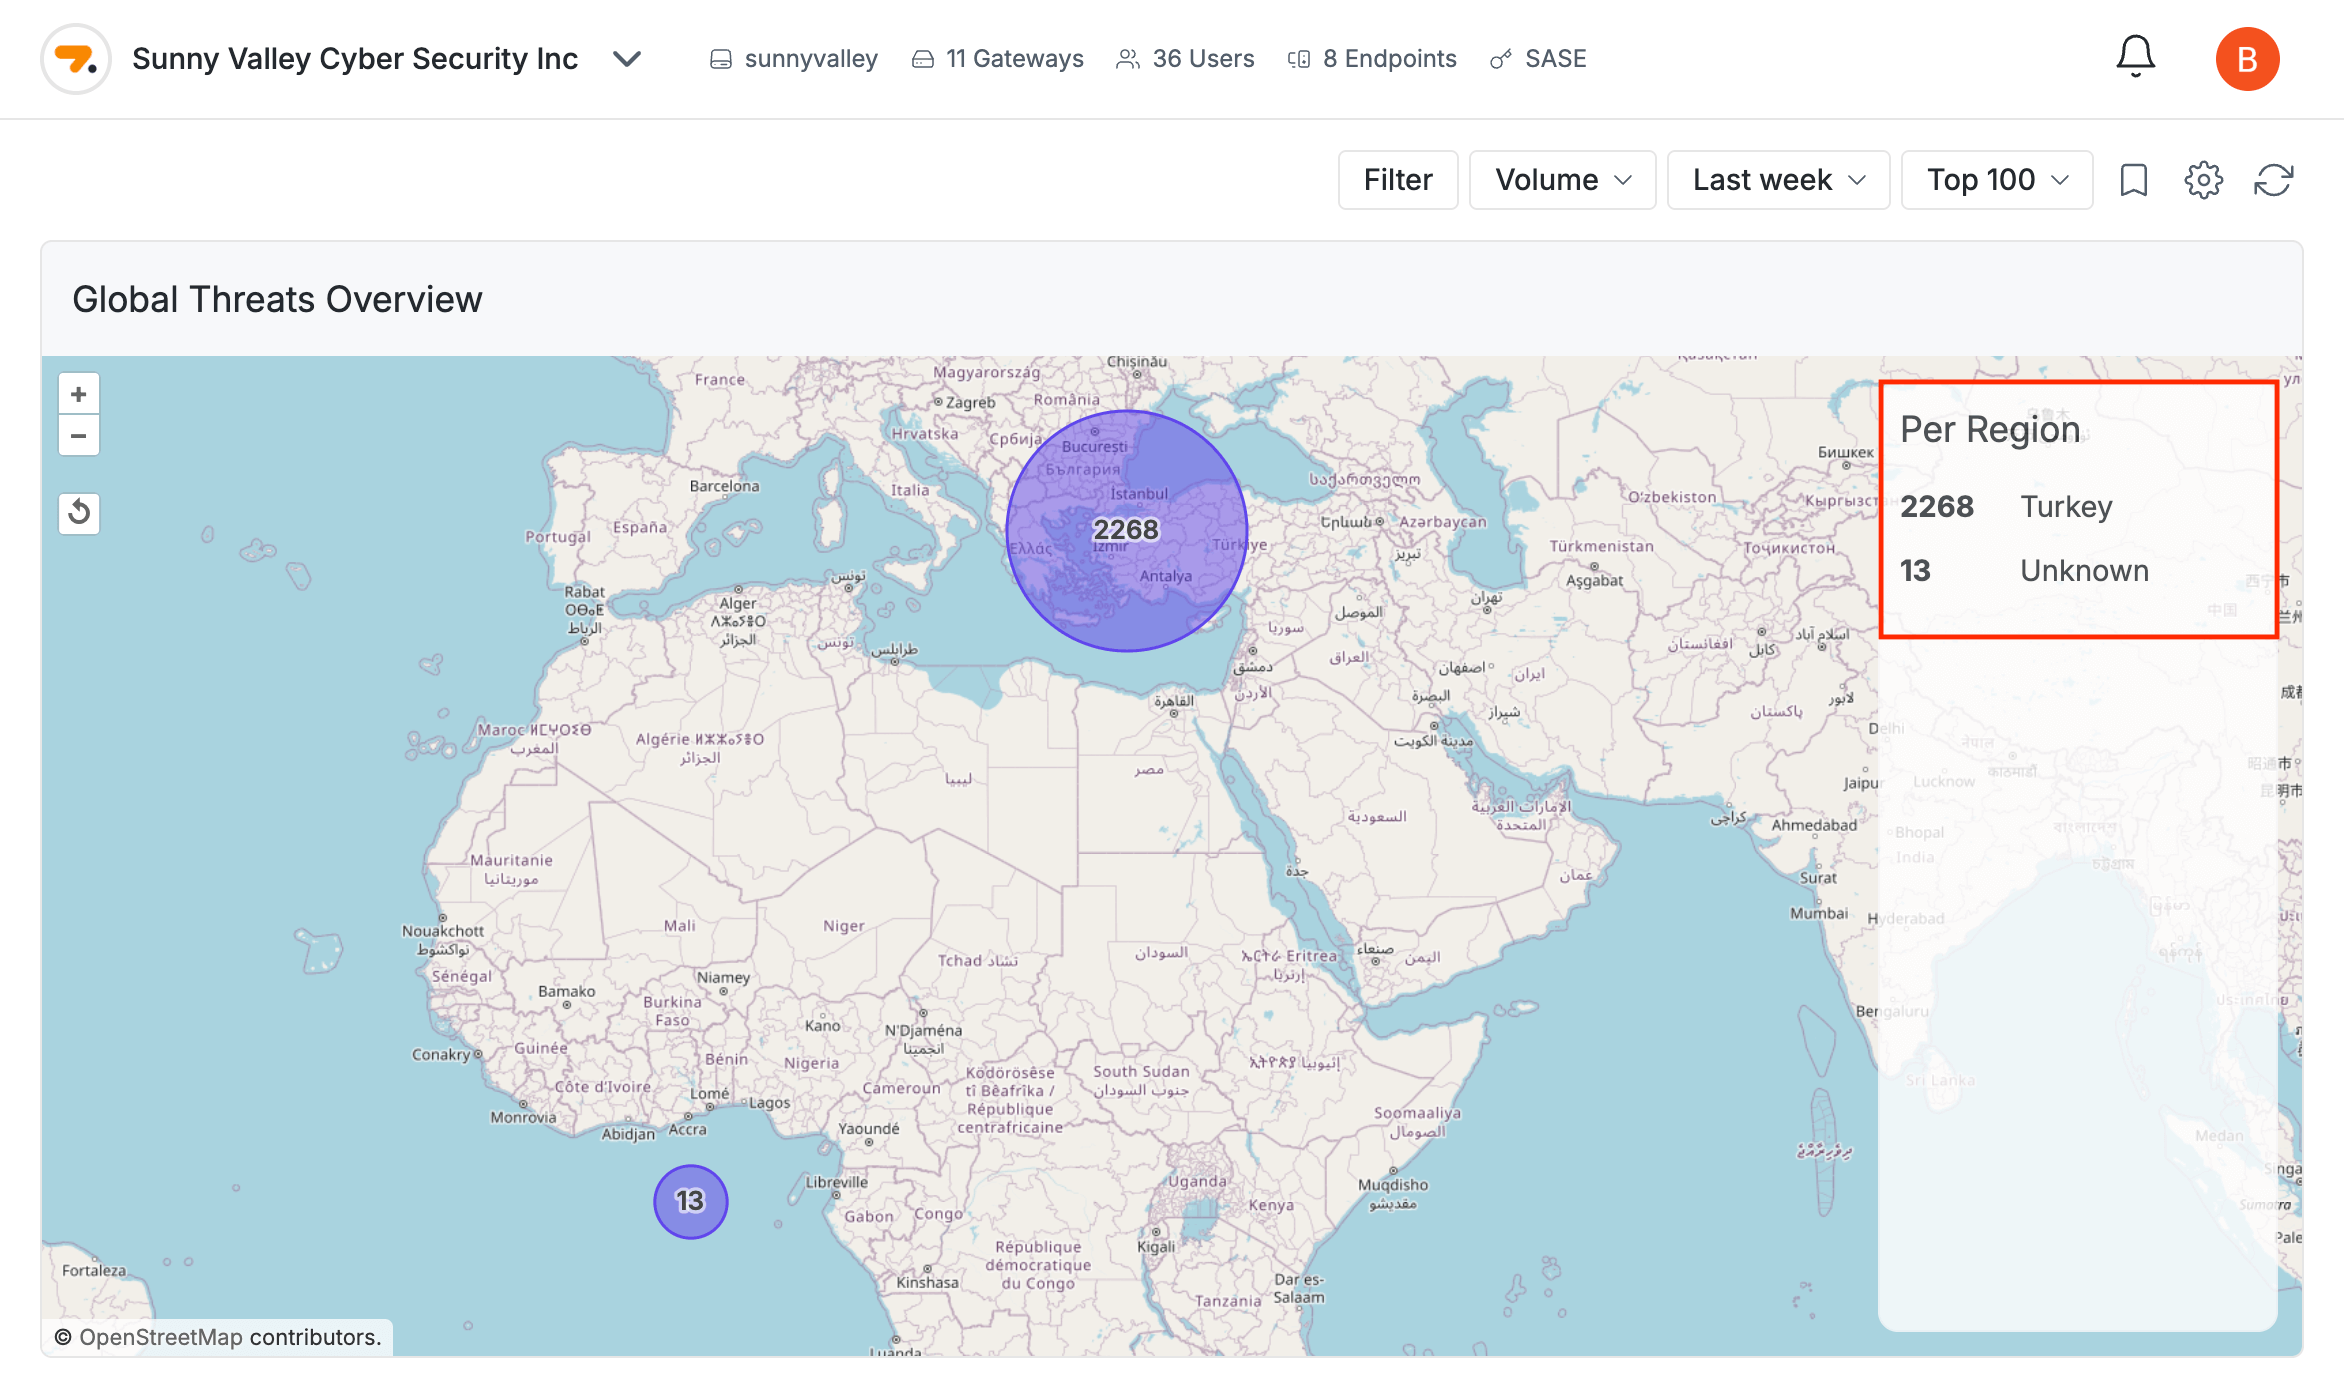
Figure 9. Viewing Global Threats Clusters Per Region
Top Pie Charts
The Top Pie Charts section, located under the Global Threats Overview, provides a visual summary of the most significant threats and network activity within your organization. These charts help you easily identify the top detected threats, devices, users, applications, and web categories.
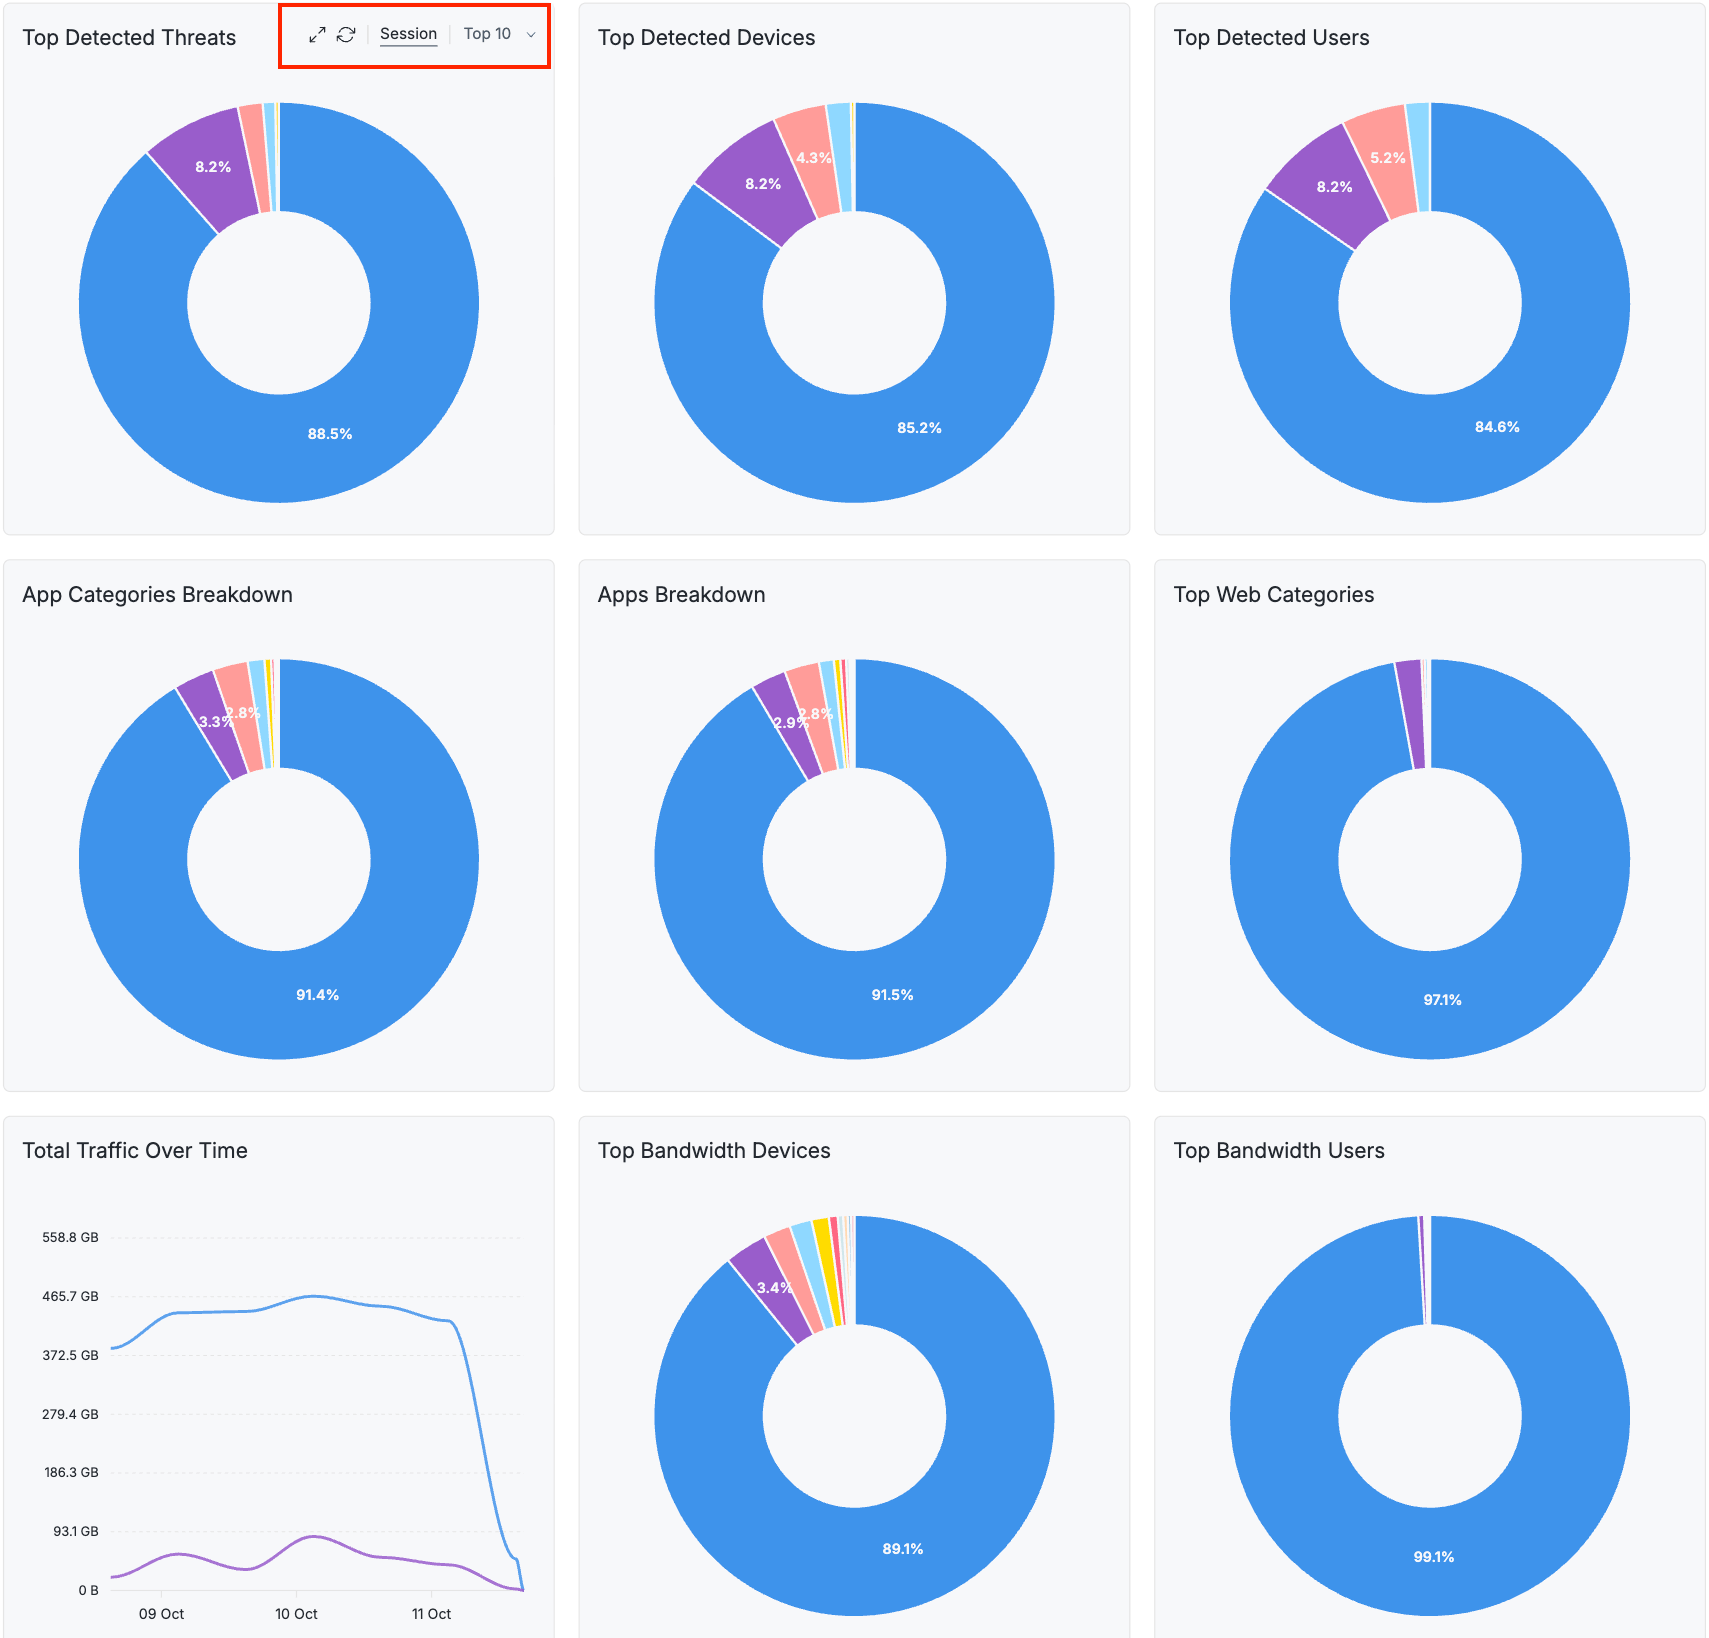
Figure 10. Top Pie Charts
You can view the following the Top Pie Charts under the Global Threats Overview:
-
Top Detected Threats: Top detected security threats on your network for the selected time interval. You can view the details of these threats by hovering your mouse over the pie chart.
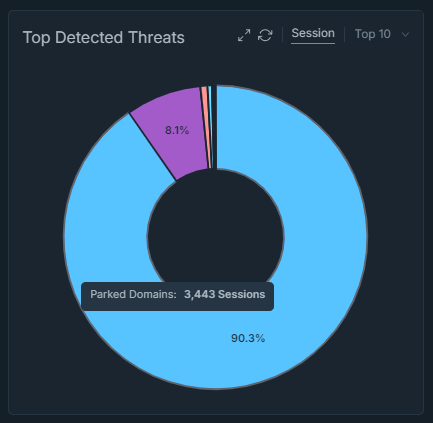
Figure 11. Top Detected Threats
-
Top Detected Devices: Top detected devices on your network for the selected time interval. You can view the details of these devices by hovering your mouse over the pie chart.
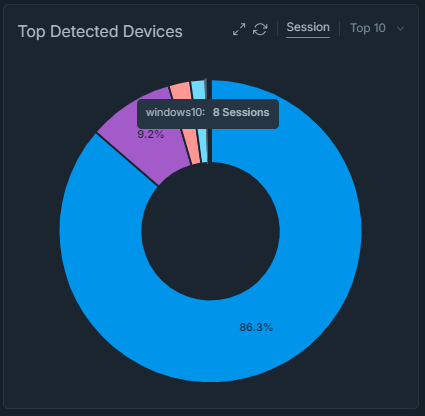
Figure 12. Top Detected Devices
-
Top Detected Users: Top detected users on your network for the selected time interval. You can view the details of these users by hovering your mouse over the pie chart.
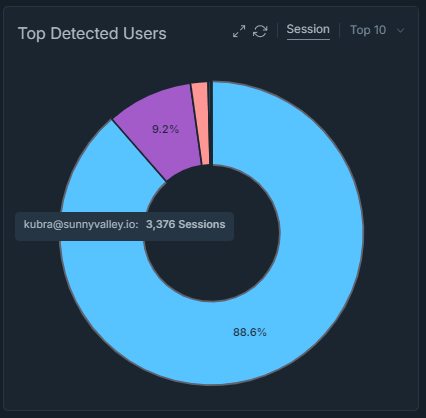
Figure 13. Top Detected Users
-
App Categories Breakdown: Top detected app categories on your network for the selected time interval. You can view the details of these app categories by hovering your mouse over the pie chart.
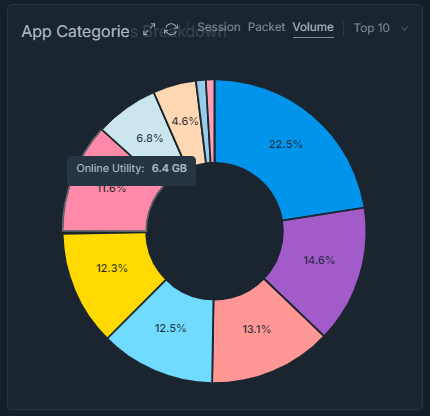
Figure 14. App Categories Breakdown
-
Apps Breakdown: Top detected apps on your network for the selected time interval. You can view the details of these apps by hovering your mouse over the pie chart.
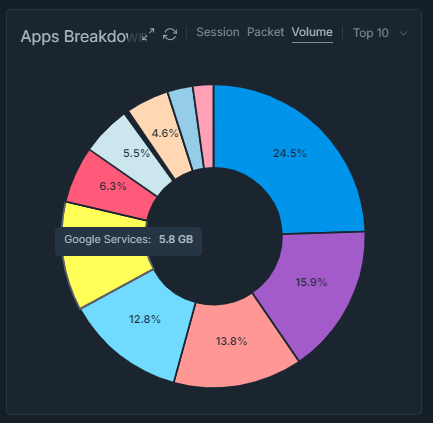
Figure 15. Apps Breakdown
-
Top Web Categories: Top detected web categories on your network for the selected time interval. You can view the details of these app categories by hovering your mouse over the pie chart.
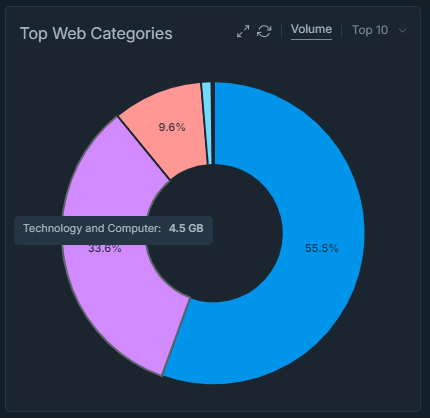
Figure 16. Top Web Categories
-
Total Traffic Over Time: Total amount of upload and download traffic on your network for the last seven days. You can view the details of these users by hovering your mouse over the pie chart.
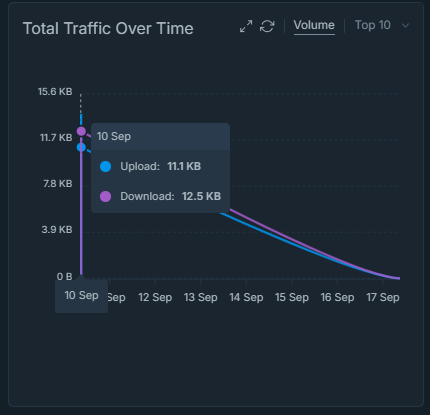
Figure 17. Total Traffic Over Time
-
Top Bandwith Devices: Top bandwith consuming devices on your network for the selected time interval. You can view the details of these devices by hovering your mouse over the pie chart.
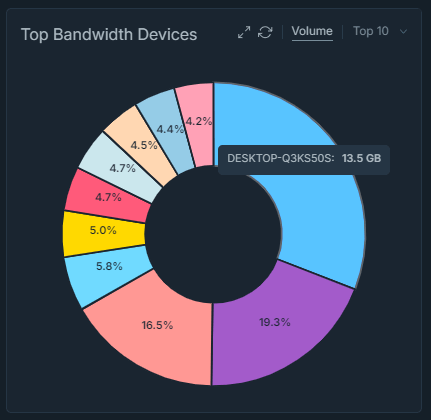
Figure 18. Top Bandwith Devices
-
Top Bandwidth Users: Top bandwidth-consuming users on your network for the selected time interval. You can view the details of these users by hovering your mouse over the pie chart.
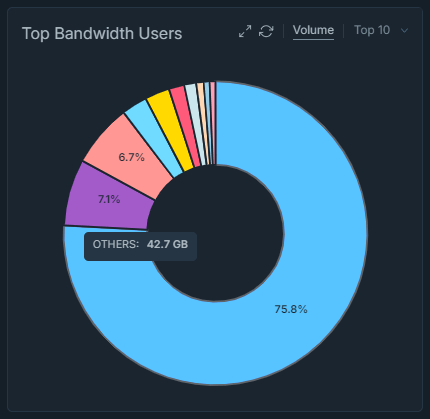
Figure 19. Top Bandwidth Users
By clicking on a pie, you have the option to drill down the traffic details. You may conveniently apply a filter and access Live Sessions.
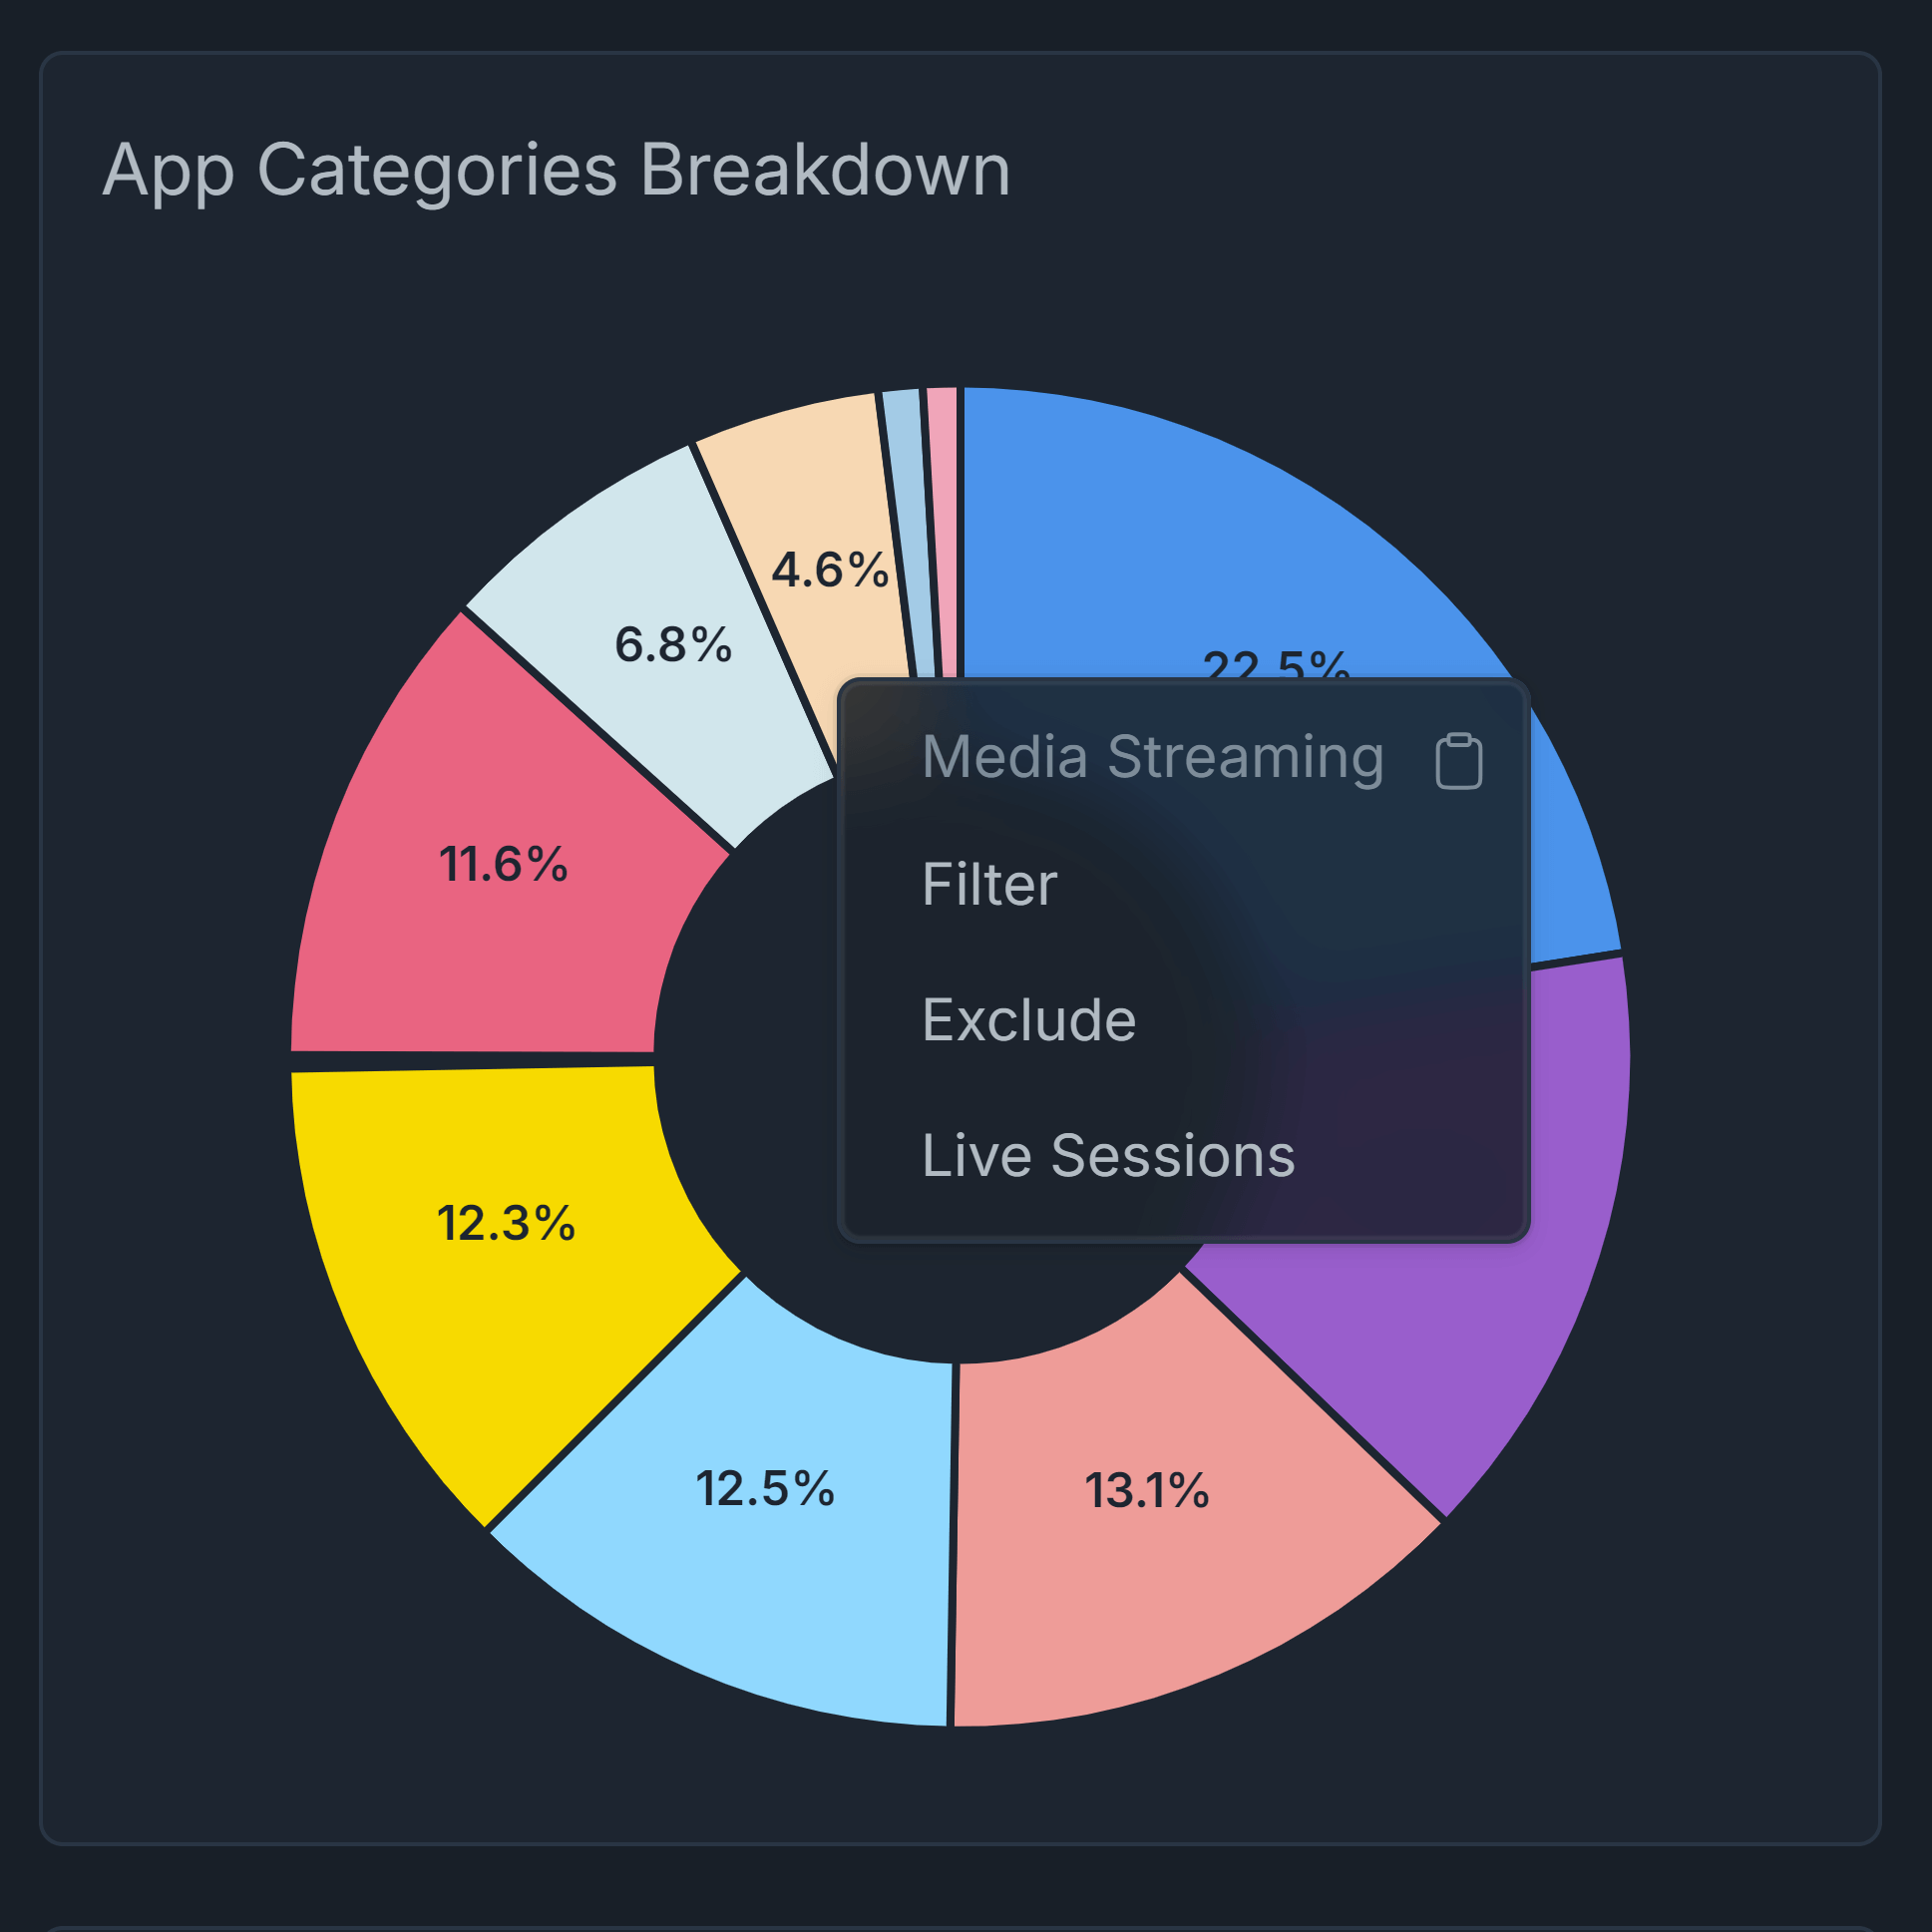
Figure 20. Drill down the traffic details