Viewing Gateway Dashboard
The Gateway Dashboard serves as a central monitoring panel that provides real-time visibility into the operational and security status of each gateway registered under your organization.
It enables users to track network performance, analyze traffic, review detected threats, and verify the health of system components, all in one unified view. This dashboard is essential for maintaining network reliability and ensuring that Zenarmor’s protection mechanisms are actively running on each gateway.
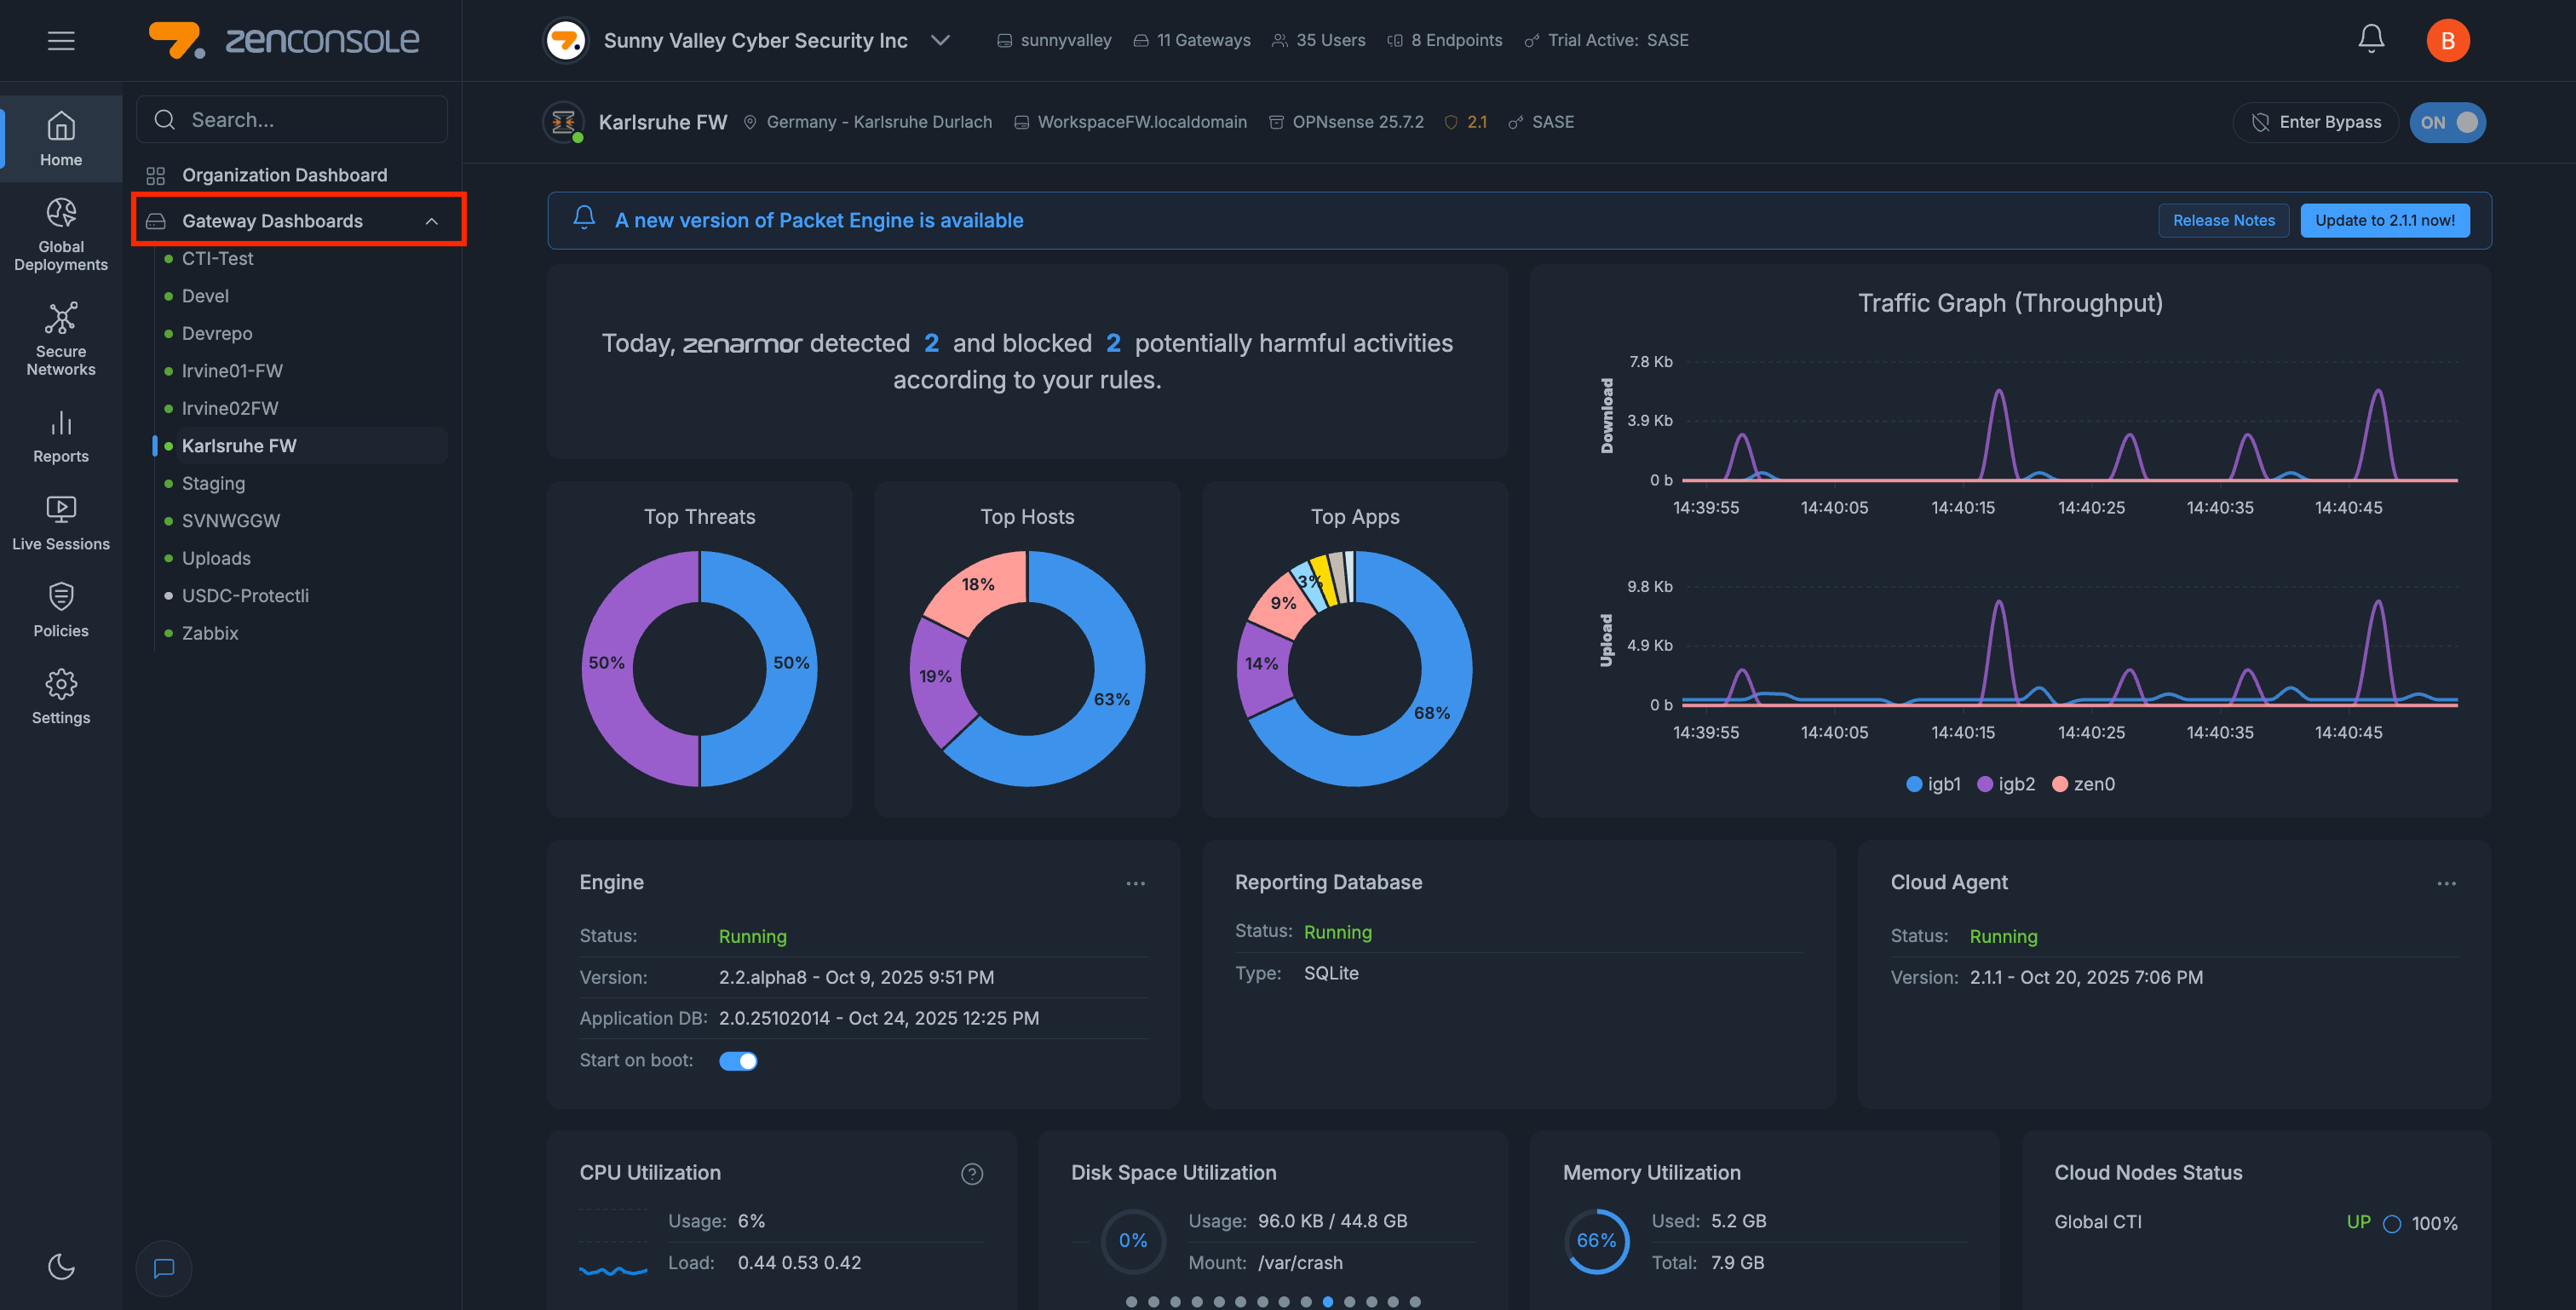
Figure 1. Gateway Dashboard Overview
Accessing Gateway Dashboard
You can access the Gateway Dashboard from the Home menu on the left navigation panel. To view all gateways registered under your account or organization, click the expand (arrow) icon next to Gateway Dashboards. This will reveal a list of gateways.
Selecting any gateway from this list opens its dedicated Gateway Dashboard view, displaying detailed real-time metrics, traffic analytics, and Zenarmor engine information for that specific gateway.
If your gateway is healthy, a solid green circle appears both next to the gateway name in the gateway list and on the gateway information bar. If the gateway becomes unhealthy, these indicators turn solid red instead.
When you click an unhealthy gateway, the Gateway Dashboard displays a “Node Not Connected” message, indicating that the cloud agent service is not running on your firewall.
You can use Troubleshooting for Cloud Agent Guide to learn how to resolve connectivity issues.
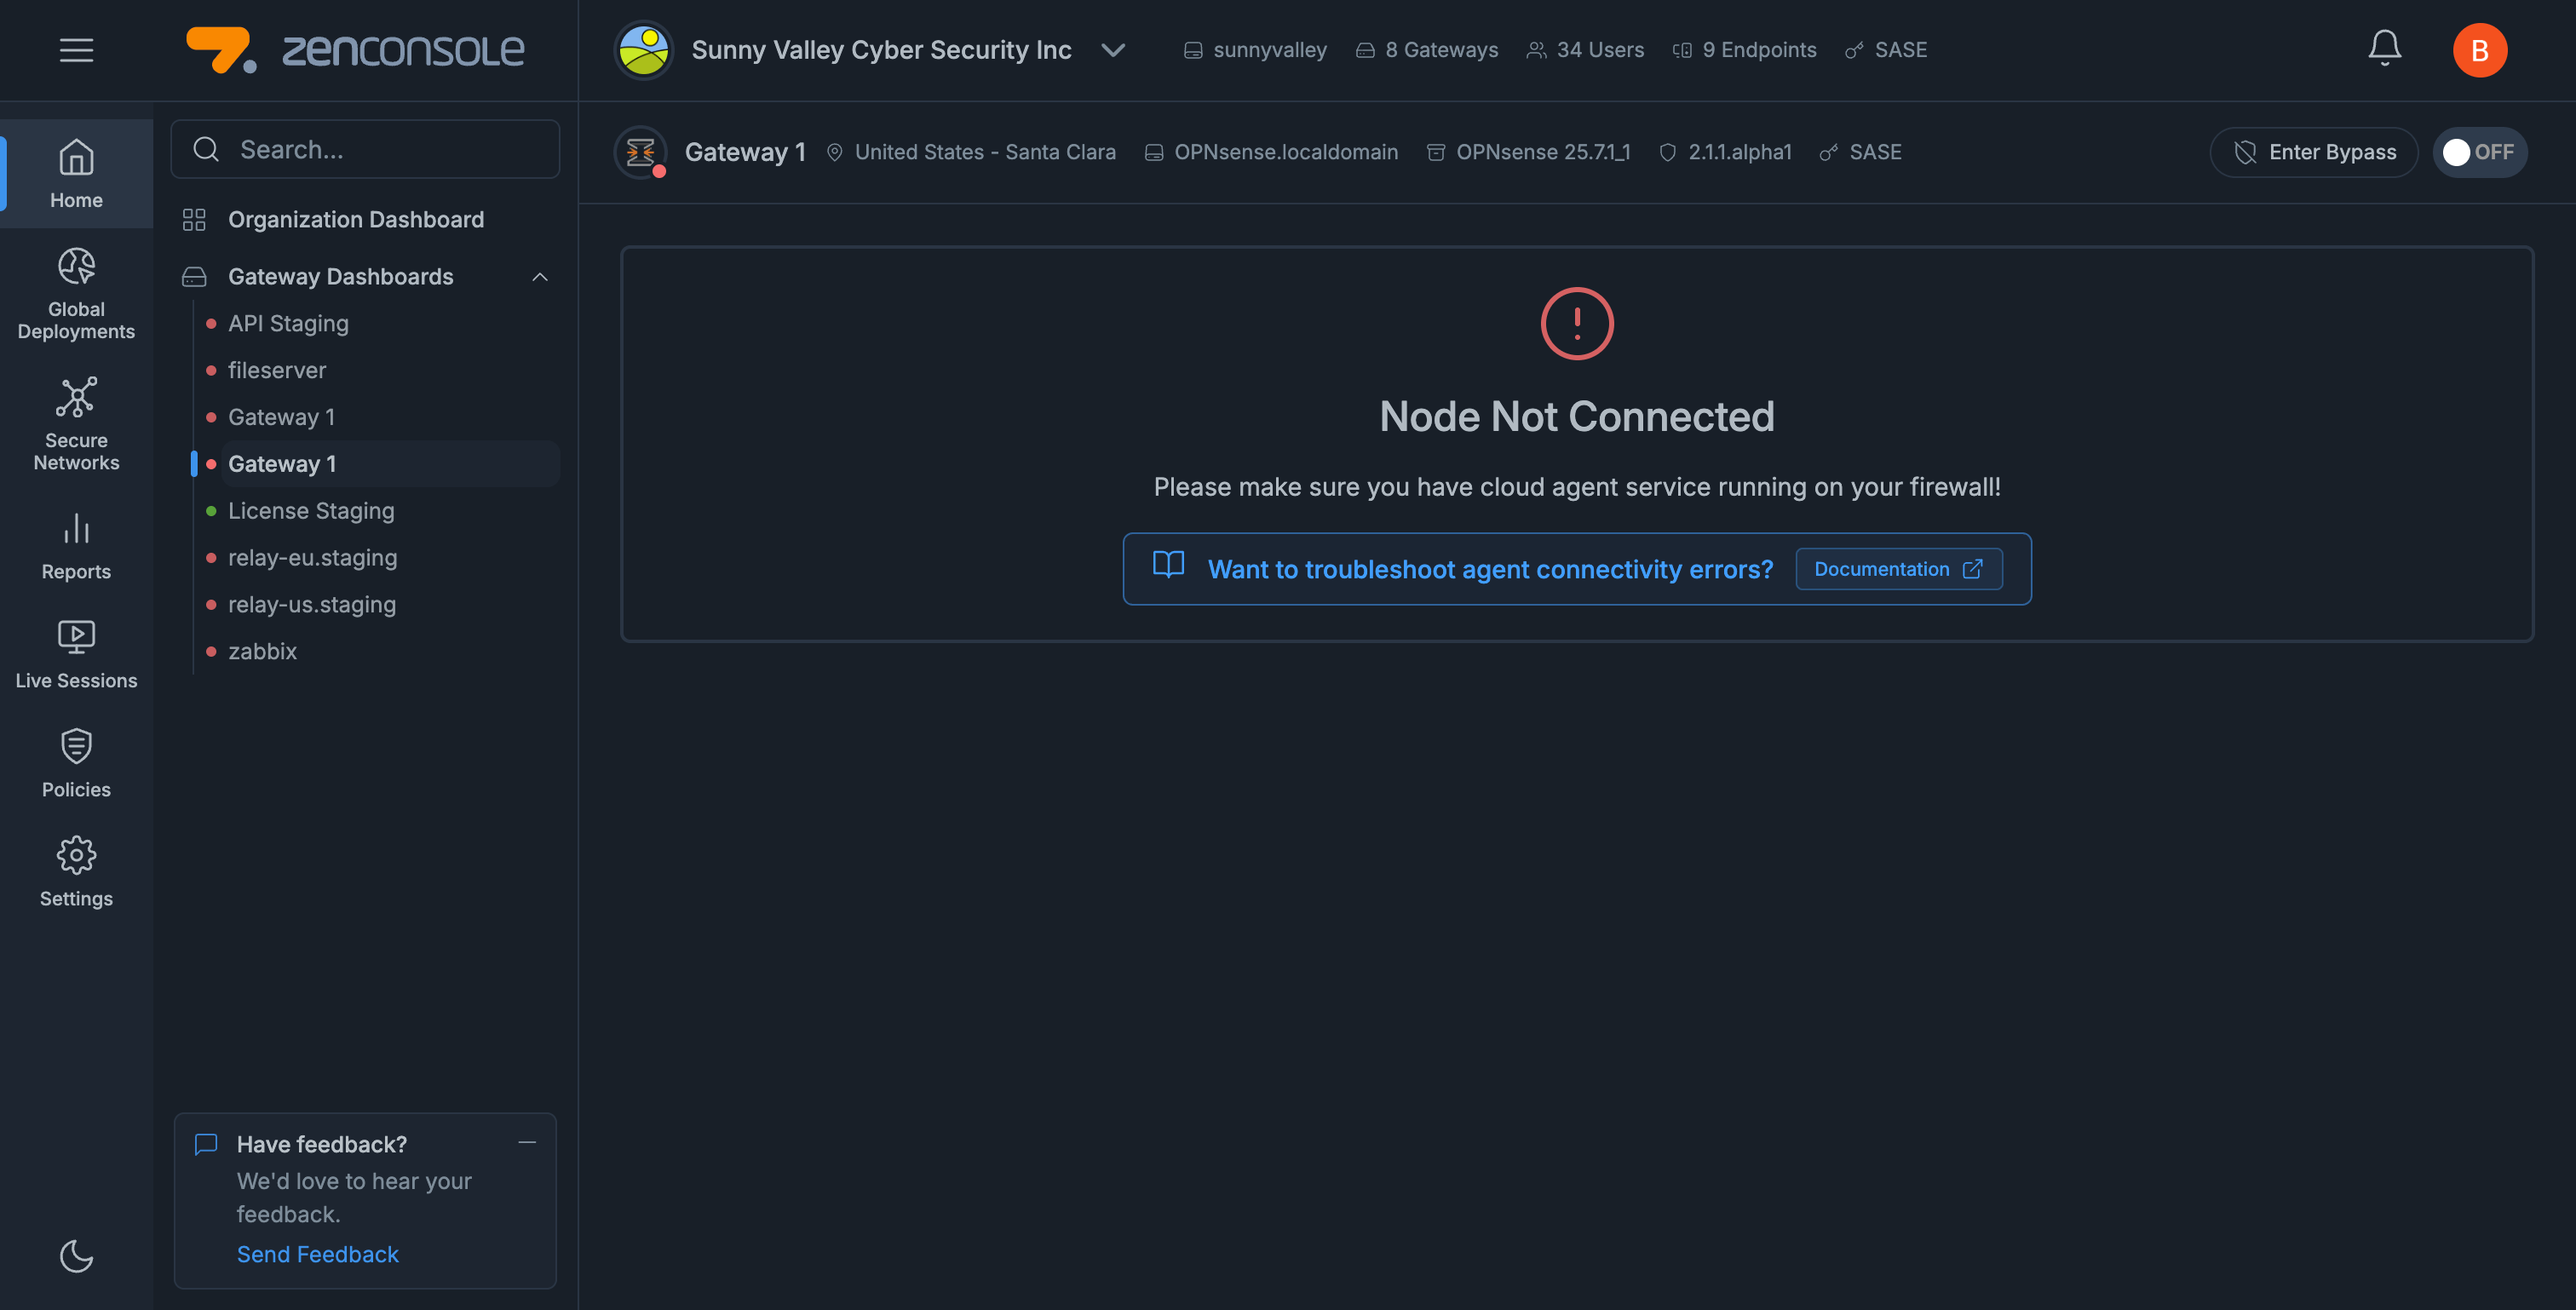
Figure 2. Dashboard of an Unhealthy Gateway
To maximize the view of the dashboard, you may collapse the Dashboard list bar by clicking on the hamburger menu icon at the top left corner of the page.
Gateway Dashboard Components
The dashboard consists of the following areas:
1. Gateway Information Bar
At the top of the Gateway Dashboard, the information bar displays key details about the selected gateway. The Gateway information bar displays the following details.
-
Gateway Name (provided during the initial configuration of the node)
-
Status: There are 4 status icon colors:
- Green: Connected
- Red: Error (not connected, backend error etc)
- Orange: Engine bypass mode
- Gray: Engine stopped
-
Location (e.g., Germany – Karlsruhe Durlach)
-
Hostname (e.g., OPNsense.localdomain)
-
Platform (e.g., OPNsense 25.1.1)
-
Zenarmor Engine Version (e.g., 2.0.8)
-
Subscription Type (e.g., SASE)
This enables administrators to identify the gateway and its software environment quickly.

Figure 3. Gateway Information Bar
Accessing Subscription Settings
You can quickly access Zenarmor subscription details by clicking the subscription type label (for example, SASE) displayed on the gateway information bar of the Gateway Dashboard.

Figure 4. Accessing Subscription Settings
This shortcut takes you directly to the Subscription page under the selected gateway’s settings, where you can review key details such as the activation key, renewal date, and the number of active devices.
For additional options such as managing your subscriptions, purchasing a new plan, or comparing Zenarmor editions, visit the Managing Zenarmor Subscriptions Guide.
2. Gateway Controls
The Gateway Controls section provides users with essential tools to manage the operational state of each gateway in real time. These controls are located on the right side of the gateway information bar and allow you to quickly change how the Zenarmor engine interacts with your network traffic.

Figure 5. Gateway Controls
Enter/Exit Bypass Mode
The Enter Bypass option provides a quick way to temporarily disable Zenarmor’s traffic inspection. This mode is primarily designed for network troubleshooting, performance testing, or emergency maintenance, allowing traffic to flow without security filtering. It ensures administrators can validate configurations or isolate issues without impacting overall connectivity.
-
Temporarily puts the gateway into Bypass Mode.
-
Zenarmor allows traffic to flow transparently without applying security policies.
-
Common use cases: troubleshooting, diagnostic testing, or emergency operations.
-
A confirmation dialog appears before activation: “You are about to enter bypass mode. Do you want to continue?”
Bypass Mode is temporary and transparent; Zenarmor continues running, but inspection and filtering are paused until the mode is disabled.
Packet Engine ON/OFF Switch
The ON/OFF switch directly manages the Zenarmor Packet Engine, the core component responsible for real-time traffic inspection and protection. This control is crucial for administrators who need to temporarily stop or restart packet analysis during planned downtime or specific testing scenarios.
-
Controls the Zenarmor Packet Engine.
-
ON: Engine is running, analyzing, and protecting traffic.
-
OFF: Engine is fully stopped, Zenarmor protection is disabled.
-
Before stopping, a confirmation warning is displayed: “You are about to stop the Packet Engine. Do you want to continue?”
-
Bypass Mode = Zenarmor is running, but inspection is temporarily skipped.
-
Engine OFF = Zenarmor services are completely stopped until manually re-enabled.
3. Notifications Bar
When the application database is updated automatically or an update is available for the engine or subscription status is changed, notifications are displayed on the bar.

Figure 6. Notifications Bar
Update Zenarmor Engine
When a new Zenarmor engine version is available, you will see a notification on the bar. You can view the Release Notes for the latest version by clicking on the Release Notes link.
To update your engine just click on the Update to link on the notification bar.
4. Threat Summary Pane
You can view the total number of detected and blocked network security threats on your network on the last 24 hours according to your policies.

Figure 7. Threat Summary Pane
A Threats Lives session explorer, which exhibits all identified and blocked threats, can be accessed by tapping on the numerical values in this pane.
5. Traffic Throughput Graph
The Home page provides you with an easy to read and interactive network usage graph. You can monitor network traffic throughput of protected interfaces in real-time. Throughput is displayed for both incoming and outgoing traffic. The last 20 throughput values retrieved from the node are displayed.

Figure 8. Traffic Throughput Graph
Viewing Network Throughput at a Specific Point in Time
To view the network throughput at any point of time, hover your mouse over the line on the graph as shown in figure 10.

Figure 9. Viewing traffic throughput at a specific point in time
Interface Filtering on the Traffic Throughput Graph
If you have more than one protected interface on your node, you will see the network throughputs of multiple interfaces simultaneously.
However, you may want to focus on the throughput of one/some of the interfaces.
To view the throughput of a single interface, hover your mouse over the interface name at the bottom of the graph. This will display the selected interface's throughput for several seconds on the graph.
")
Figure 10. Filtering an Interface (igb1_vlan100 interface filtered on OUT)
You may also exclude one or more of the interfaces by clicking on the interface name(s) at the bottom of the graph. This will remove the selected interface line from the graph.
")
Figure 11. Excluding Interface (igb1_vlan100 and lagg0_vlan20 interface are excluded)
6. Top Pie Charts
You can view the following 3 Top Pie Charts:
-
Top Threats: Top (Top 5 and others) blocked security threats on your network for the current day. You can view the details of these threats by hovering your mouse over the pie chart.

Figure 12. Top Threats Chart (8 Parked Domains sessions are blocked, for example)
-
Top Hosts: Top (Top 5 and others) hosts which have the highest network bandwidth usage for the current day. You can view the details of these hosts(hostname/IP and its total bandwidth usage) by hovering your mouse over the pie chart.

Figure 13. Top Hosts Chart
-
Top Apps: Top (Top 5 and others) applications that have the highest network bandwidth usage for the current day. You can view the details of these applications(Application Category and its total bandwidth usage) by hovering your mouse over the pie chart.

Figure 14. Top Apps Chart
7. Services Status
You can view the status of the Zenarmor-related services on the dashboard. It provides all critical system-level information you need to manage your node. The following services are listed here:
-
Engine
-
Reporting Database
-
Cloud Agent
-
Cloud Nodes
")
Figure 15. Services Status(Engine, Reporting DB, Cloud Agent)
")
Figure 16. Services Status(Cloud Node Status)
You can check whether one of the services is running or not by viewing the related pane on the dashboard.
Also, you can start, stop and restart the Zenarmor-related services by clicking the management buttons on these panes.
For more information, please refer to Status.
8. System Utilization
You can view the following system (node) level information on the dashboard:
-
CPU Utilization: The real-time CPU usage is displayed on this pane. You can view CPU usage percentage and CPU load.
-
Disk Space Utilization: Zenconsole displays disk utilization seperately for each partition on the platform. Utilization of each partition is automatically displayed in a slide-show. You may also navigate between the partition utilizations by clicking on the sliding icons at the bottom of the pane. You can view the following information:
-
Total disk usage of each disk partition
-
Total size of each disk partition
-
Usage percentage of each disk partition
-
Mount point of each disk partition, such as
/,/tmp, or/usr/local.
-
-
Memory Utilization: Real-time memory usage is displayed. You can view the following information:
-
Total memory of the system
-
Amount of Used memory
-
Usage percentage of the memory

Figure 17. System Utilization
-