Diagnose Your Network Like a Pro: Mastering pfSense Diagnostic Tools
pfSense software is a powerful open-source firewall and router platform. But like any complex system, troubleshooting network issues on pfSense software can be challenging. This guide equips you with the knowledge to become a pfSense diagnostic pro, mastering the built-in tools and techniques to pinpoint and resolve network problems efficiently. This article examines the following key areas:
- Understanding pfSense Diagnostic Tools: We'll explore the essential diagnostic tools readily available within the pfSense web interface.
- Troubleshooting pfSense with Confidence: Learn how to leverage these tools for various network scenarios, including connectivity issues, firewall problems, performance bottlenecks, and routing errors.
By the end of this guide, you'll be well-equipped to diagnose and resolve a wide range of network issues on your pfSense system, ensuring a smooth and secure network for your devices.
Why are Diagnostic Tools Important for pfSense?
pfSense offers a robust set of diagnostic tools to help you troubleshoot and maintain your network effectively. These tools provide valuable information and functionalities for various network management tasks.
Key functionalities of pfSense diagnostic tools are as follows:
- Network Visibility: Tools like ping and packet capture allow you to inspect network traffic flow. This helps identify potential bottlenecks or slowdowns before they cause disruptions.
- Troubleshooting Efficiency: Tools like traceroute assist in pinpointing the root cause of connectivity issues. For example, if a website loads slowly, traceroute can help identify the specific hop on the route causing the delay.
- Enhanced Security: pfSense logs function as a security monitoring system. They record suspicious activity attempts, allowing you to identify and address potential vulnerabilities before they become exploited.
- Simplified Maintenance: Backup and restore functionalities within the diagnostic tools streamline configuration management and system resets, ensuring smooth network operation.
- Performance Optimization: Tools like traffic graphs and interface statistics provide insights into network performance. You can use this information to identify bottlenecks and fine-tune settings to optimize network speed. By leveraging these diagnostic tools, you gain a deeper understanding of your network's health and performance. This empowers you to proactively address problems, maintain a secure network environment, and ensure optimal network performance.
What are the pfSense Diagnostic Tools?
This guide will equip you with a comprehensive understanding of the following pfSense diagnostic tools:
Network Connectivity Diagnostic Tools
pfSense offers a comprehensive set of network connectivity tools to help you diagnose and troubleshoot communication issues on your network. These tools provide valuable data and functionalities for analyzing and resolving connectivity problems.
Here's a breakdown of some key pfSense network connectivity tools:
ARP Table
The ARP (Address Resolution Protocol) table in pfSense is a crucial tool for managing your network. It functions like a directory, showing the relationship between a device's IP address (its online identification) and its MAC address (unique hardware identifier). This information is essential for understanding how devices on your network communicate with each other.
The ARP table essentially translates IP addresses, which are easier for humans to remember, into MAC addresses, which are used by network devices for actual data transmission.
Here's how you can leverage the ARP table for diagnostics:
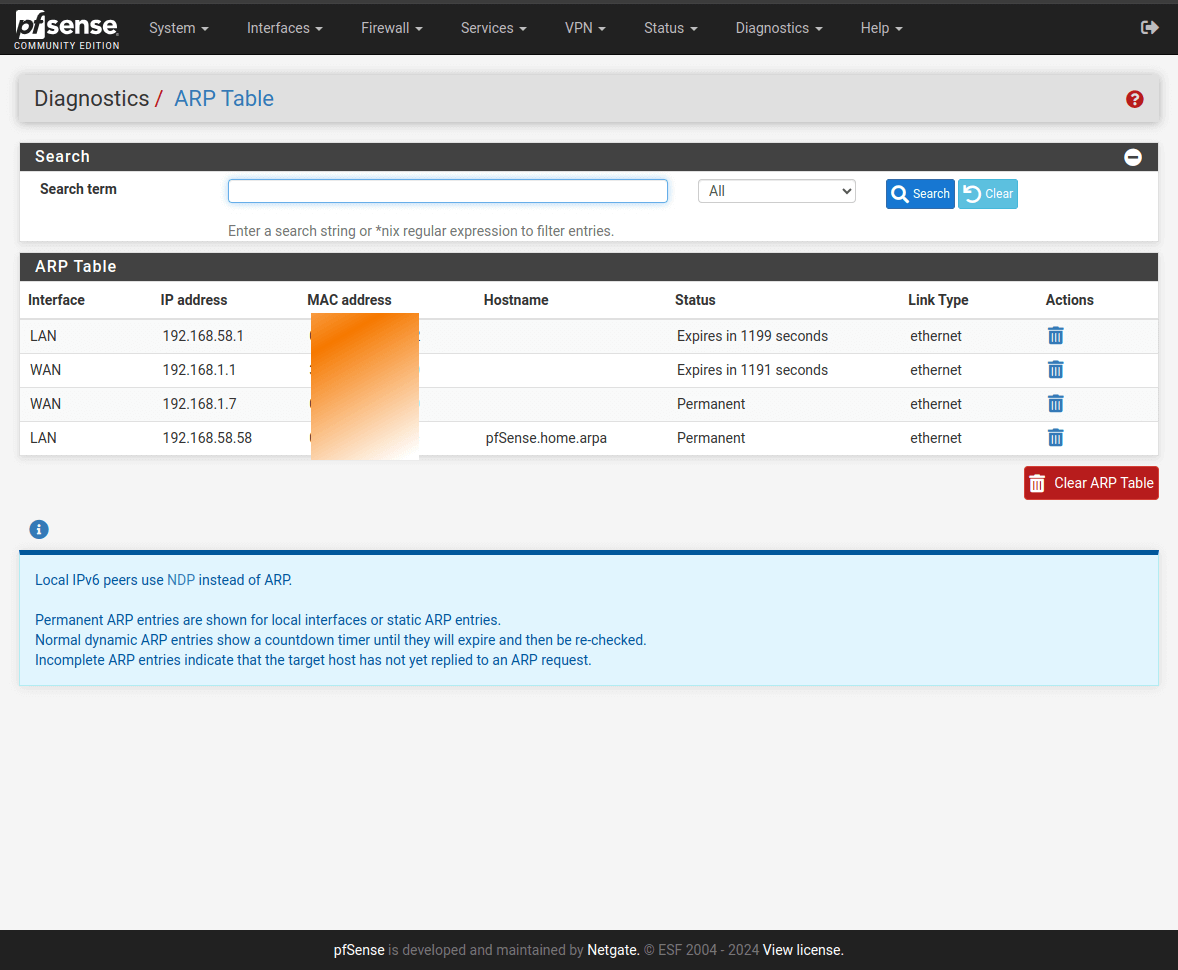
Figure 1. pfSense Diagnostics > ARP Table
- IPv4 Focus: This table specifically deals with IPv4 addresses, the most common addressing scheme on networks.
- Dynamic vs. Static Entries: The table displays both dynamic and static entries. Dynamic entries are automatically generated based on recent communication and expire after a period of inactivity. Static entries are manually configured for specific devices and persist even without ongoing communication.
- Information at Your Fingertips: For each entry, you'll see:
- Interface: The network interface (e.g., LAN, WAN) where the device was discovered.
- IP Address: The device's numerical IP address.
- MAC Address: The unique hardware address of the device. An incomplete MAC address indicates the firewall is still waiting for a response.
- Hostname: If available, the device's hostname for easier identification.
- Status: Whether the entry is permanent (static) or dynamic (expires after a set time).
- Link Type: The type of network connection used (e.g., Ethernet).
- Taking Action: The arp table on pfSense allows you to:
- Remove Individual Entries: This can nudge the firewall to rediscover a device's MAC address if it changes.
- Clear the Entire Table: While not always necessary, this can be helpful if multiple devices have changed MAC addresses and the firewall is using outdated information.
Diagnosing Connectivity Issues with ARP Table
If a device seems unreachable on your network, check the ARP table. If the device's IP address is missing or has a stale age, it could indicate an issue with IP address assignment, physical connectivity (e.g., cable problem), or the device itself is offline. Duplicate IP addresses on your network can cause connectivity problems. The ARP table can help identify duplicate entries, suggesting a configuration error where multiple devices are assigned the same IP address.
Monitoring Network Security with ARP Table
While less common, the ARP table can be used for basic security monitoring. Look for suspicious entries with unknown MAC addresses. These could potentially indicate unauthorized devices attempting to access your network. However, this method alone is not a foolproof security measure, and additional security practices are recommended.
In essence, the ARP table provides a real-time snapshot of the devices communicating on your network and their corresponding addresses. This information is crucial for troubleshooting connectivity issues and ensuring smooth network operation.
DNS Lookup
The DNS Lookup tool in pfSense is your bridge between the human-readable world of website names (like zenarmor.com) and the numerical world of IP addresses (like 172.67.69.62). It acts like a translator, letting you see if pfSense can properly find the internet addresses for the websites you're trying to reach.
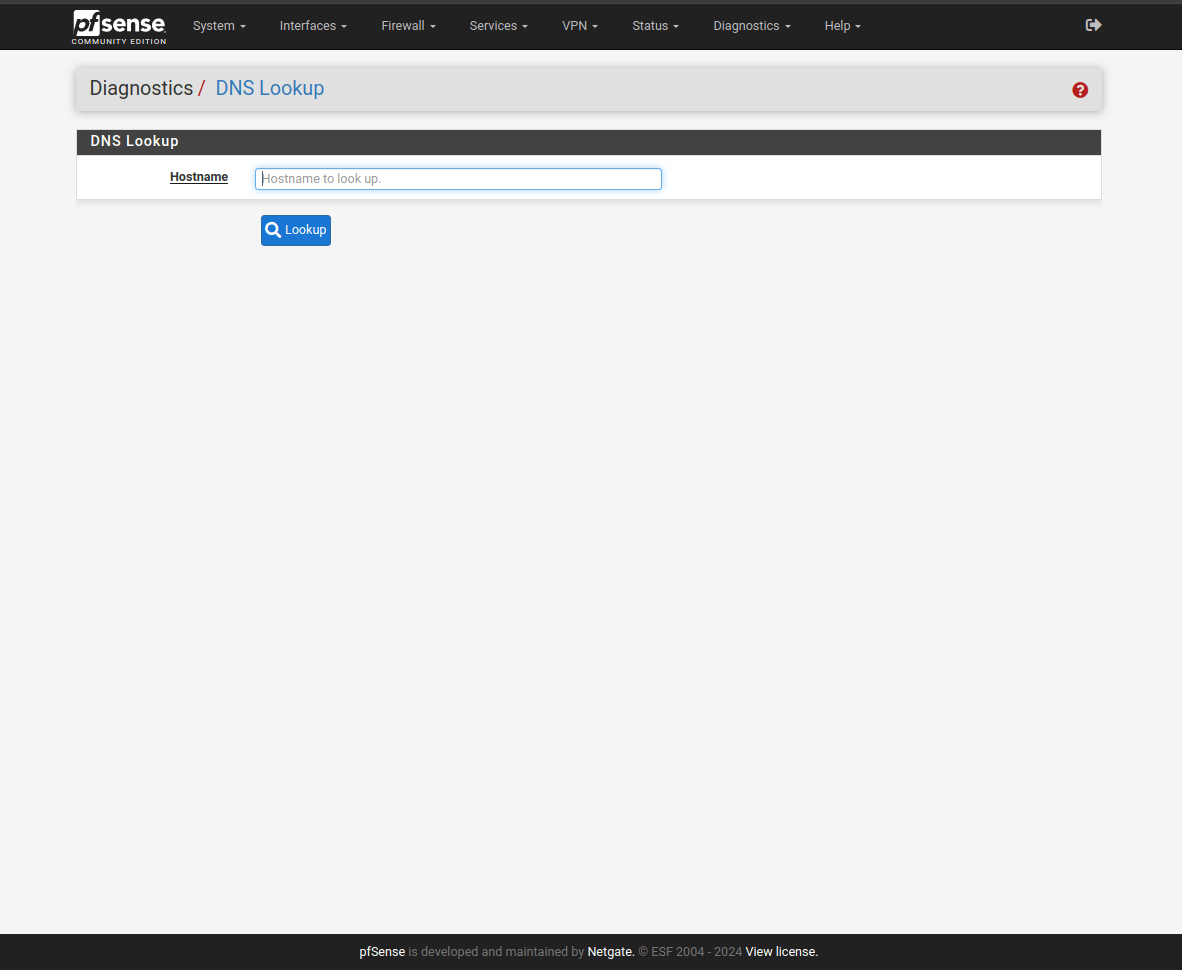
Figure 2. pfSense Diagnostics > DNS Lookup
Here's a breakdown of what you can do with DNS Lookup:
-
Look Up Websites: Enter a website name (hostname) or an IP address and click "Lookup." pfSense will query its configured DNS servers and tell you:
- The corresponding IP address for a hostname (if successful).
- The hostname associated with an IP address (reverse lookup).
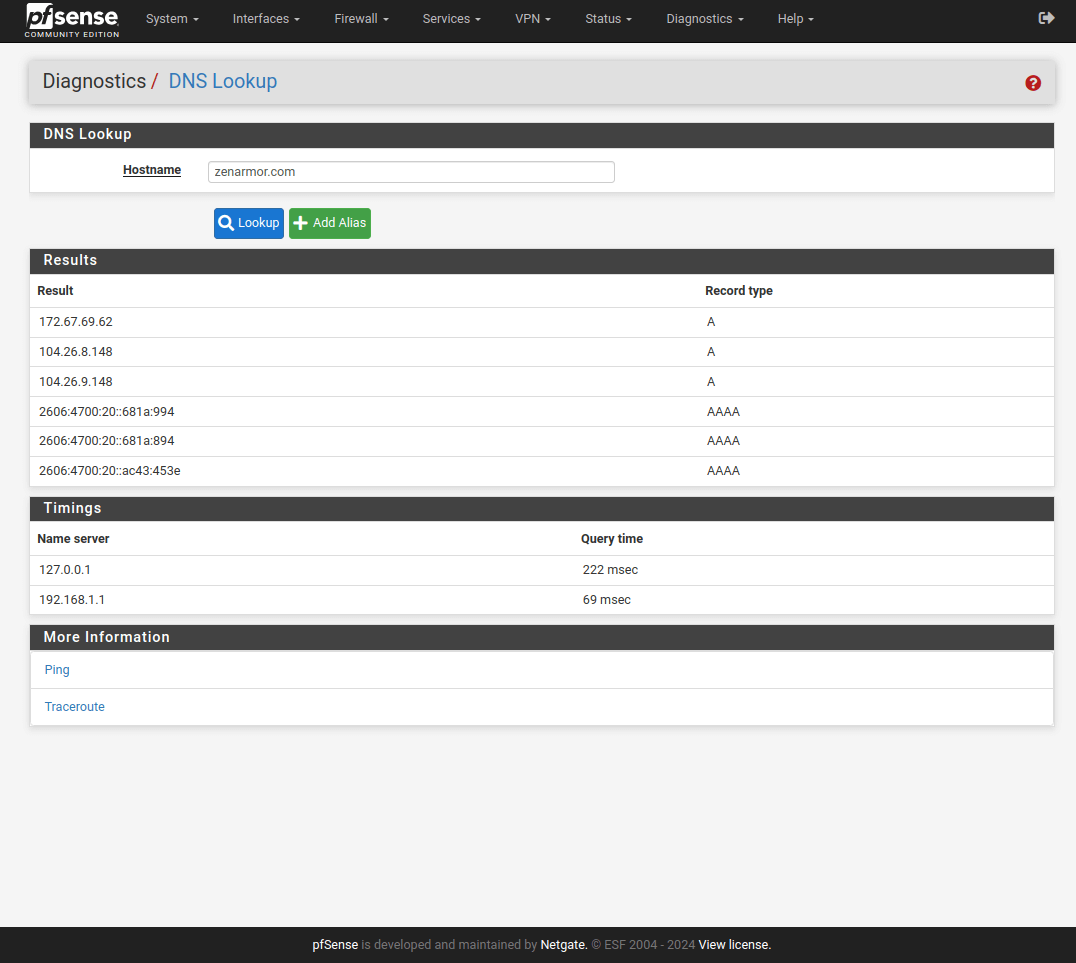
Figure 3. pfSense Diagnostics > DNS Lookup Test
-
Test Your DNS Servers: The tool automatically tests the various DNS servers pfSense is configured to use, ensuring they function properly.
-
See Response Times: You'll get a breakdown of how long each DNS server took to respond to your query, helping you identify any slow or unresponsive servers.
-
Create Firewall Aliases (Optional): With a click, you can create firewall aliases based on your lookup results. Aliases are like nicknames for IP addresses or hostnames, simplifying firewall rule creation.
The following are some examples of diagnostic applications for DNS lookup:
- Verifying DNS Configuration: Confirming your pfSense firewall is correctly configured to use the desired DNS servers.
- Troubleshooting Internet Connectivity: Identifying if DNS resolution issues are preventing Internet access.
- Diagnosing Specific Website Issues: Checking if a website is unreachable due to a DNS problem or an issue with the website itself.
- Investigating Unknown IP Addresses: Determining the hostname associated with a suspicious IP address, potentially aiding in security analysis.
In a nutshell, the DNS Lookup tool is your one-stop shop for verifying pfSense's DNS configuration and troubleshooting website connectivity issues.
Ping
Ping is a network diagnostic tool that uses ICMP echo requests to check connectivity between your pfSense firewall and another device on the network. It sends packets to the target and measures how long it takes for them to return, indicating network latency.
pfSense offers two ways to perform ping test:
- Via GUI (Graphical User Interface)
- Via Console
You may perform a ping test via GUI by following the next steps:
-
Go to Diagnostics > Ping.
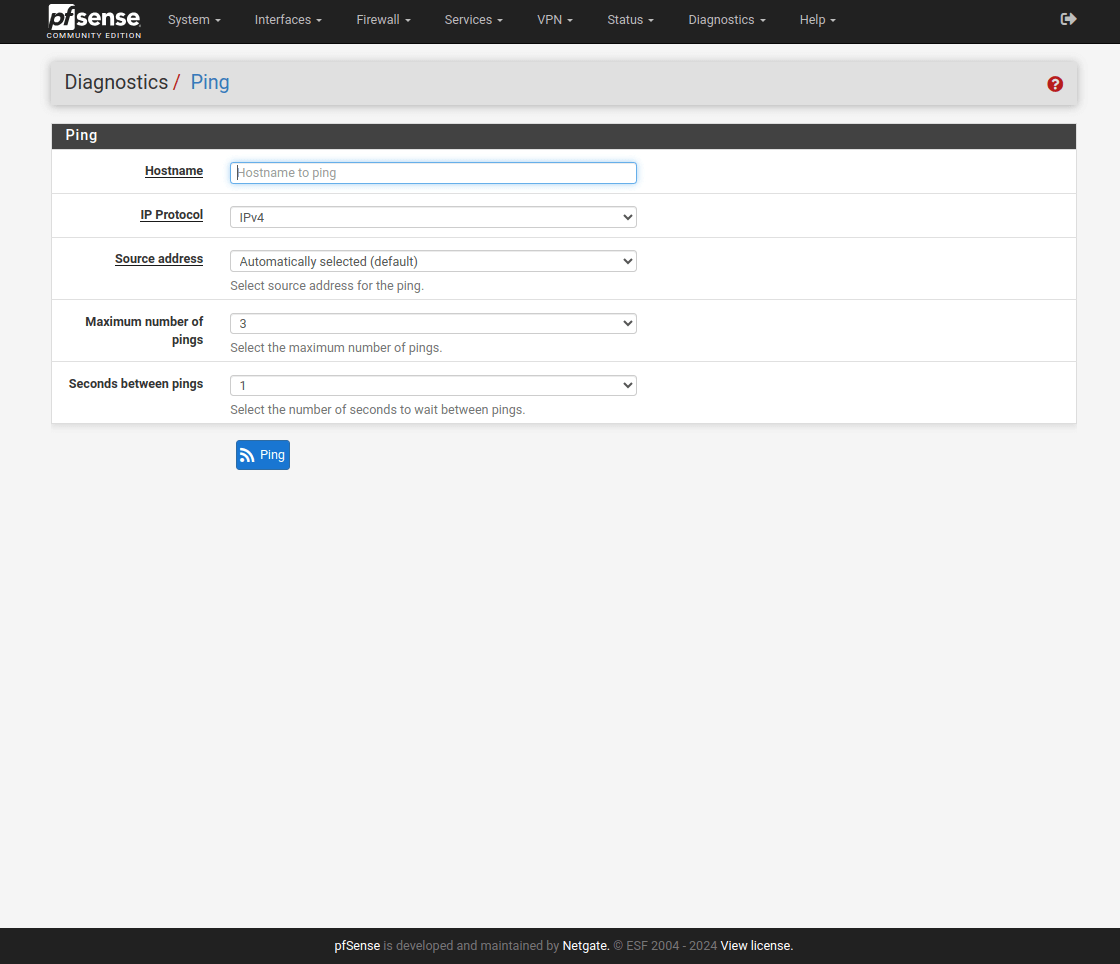
Figure 4. Pfsense Diagnostics > Ping
-
Enter the Hostname or IP address of the target device.
-
(Optional) Choose the IP Protocol (IPv4 or IPv6) if the hostname resolves to both.
-
(Optional) Specify the Source Address on your pfSense firewall for the ping (useful for VPN testing).
-
Set the Maximum Number of Pings (defaults to 3).
-
Set the Seconds Between Pings (defaults to 1 second).
-
Click Ping to start the test.
The results will be displayed automatically upon completion.
You may perform a ping test via Console by following the next steps:
- Access the console locally or via SSH with an admin account.
- Select the Ping Host option (e.g., option 7).
- Enter the IP address or hostname to ping. The test will start and display results in real-time.
- Press Enter to return to the menu after completion.
Understanding the Ping Results
The ping results will show the following details:
- Target: The hostname or IP address you pinged.
- Sent: Number of ping requests sent.
- Received: Number of successful responses received.
- Lost: Number of packets that didn't receive a response (indicating potential connectivity issues).
- Minimum/Average/Maximum/StdDev (ms): Latency (round-trip time) in milliseconds for received packets.
A few examples of how the Ping diagnostic tool can be put to use are provided in the following list.
- A successful ping response indicates basic connectivity between your pfSense firewall and the target device. The round-trip time (RTT) displayed in the results provides an estimate of the network latency between them.
- By pinging different devices at various stages of your network (e.g., local device, gateway, external server), you can isolate where connectivity issues might be occurring.
- If a ping to a local device fails, it suggests a problem within your own network segment (e.g., cabling issue, device malfunction).
- If a ping to your gateway (usually your internet service provider's router) fails, it indicates an issue with your internet connection.
- If a ping to an external server succeeds but with high latency, it might suggest network congestion or distance-related delays.
- If a ping to a specific device times out (no response received), it signifies the device is unreachable from your pfSense firewall. This could be due to various reasons:
- The device might be turned off or disconnected from the network.
- There might be firewall rules blocking communication.
- The device itself might be malfunctioning.
Traceroute
Traceroute is a tool that maps the path packets take from your pfSense firewall to a remote host on the network. It sends packets with increasing Time-To-Live (TTL) values and analyzes the ICMP error messages ("Time-to-live exceeded") received from routers along the way. This reveals the "hops" a packet takes to reach the destination.
pfSense offers traceroute via the GUI or console:
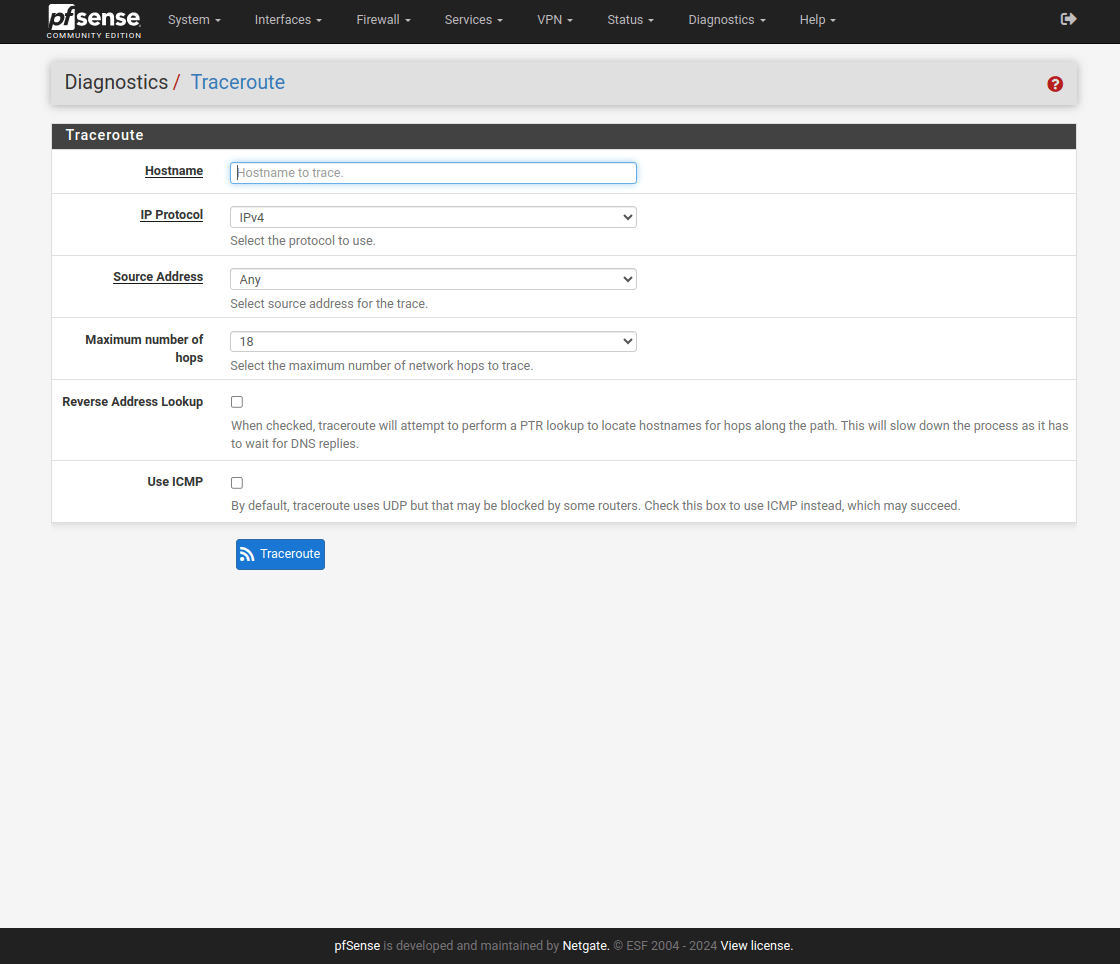
Figure 5. pfSense Diagnostics > Traceroute
You may perform a traceroute via GUI by following the next steps:
- Go to Diagnostics > Traceroute.
- Enter the Hostname or IP address of the target.
- (Optional) Choose the IP Protocol (IPv4 or IPv6) if the hostname resolves to both.
- (Optional) Specify the Source Address on your pfSense firewall for the trace (useful for VPN testing).
- Set the Maximum number of hops.
- Check Reverse Address Lookup to attempt translating IP addresses to hostnames (slows down the process).
- Check Use ICMP if UDP traceroute might be blocked by firewalls.
- Click Traceroute to start the test.
You may perform a traceroute via the Console by following the next steps:
- Access the console locally or via SSH with an admin account.
- Use the command traceroute [hostname/IP address].
Understanding the Traceroute Results
The traceroute output shows the following details:
- Hops: Each "hop" represents a router on the path to the destination.
- IP Address: The IP address of each router along the way.
- Response Times: Round-trip times (in milliseconds) for packets sent to each hop.
- Reverse Lookup (if enabled): Hostnames corresponding to IP addresses (may not always be available).
In order to improve pfSense diagnostics, the following are some examples of how Traceroute can be of use:
- Identifying Route Hops
- You enter the hostname or IP address of a destination you want to reach.
- Traceroute sends probes to the destination, and each router along the path responds with a hop count.
- These hop counts represent the sequence of routers (network devices) the packets traverse to reach the final destination.
- Troubleshooting Connectivity Issues: By analyzing the traceroute results, you can pinpoint where connectivity problems might be occurring:
- High Hop Counts: An unusually high number of hops could indicate a long and inefficient route, potentially impacting network performance.
- Failed Hops: If a specific hop fails to respond, it suggests a problem with that particular router on the path, causing the connection to be interrupted.
- Increased Latency at Specific Hops: Significant delays at a particular hop might indicate congestion or technical issues on that specific network segment.
- Isolating Network Bottlenecks: Traceroute can help identify potential bottlenecks (slow points) on the path to a destination. If a significant increase in latency occurs at a specific hop, it could indicate congestion or limitations on that network segment.
- Diagnosing External Server Issues: While not a definitive test, traceroute can sometimes provide clues regarding issues with the destination server itself. If all hops are successful but there's no response from the final destination, it could suggest a problem with the server's network configuration or its availability.
Routes
In pfSense, a route defines the path a packet takes to reach its destination network. It essentially tells the firewall where to send packets based on their IP addresses. Routes include the following details on pfSense:
- Destination Network: The network you want to reach (e.g., 10.0.0.0/16 for a subnet).
- Gateway: The IP address of the next hop router that will forward the packet towards the destination. This could be your ISP's router or another internal router on your network.
- Interface: The physical network interface (e.g., em0, em1) on your pfSense firewall that the packet will be sent out of.
What are the Route Types on pfSense?
There are two main types of routes in pfSense:
- Default Route: This route catches all traffic that doesn't match any other, more specific routes. It points to the gateway that connects you to the wider internet (usually your ISP's router).
- Static Route: You manually configure a static route to explicitly tell the firewall how to reach a specific network. This is useful for:
- Reaching networks that aren't on the same subnet as your pfSense firewall.
- Using a specific gateway for certain destinations (e.g., for load balancing).
pfSense uses routes for some VPN connections (OpenVPN, WireGuard, VTI mode IPsec) where the firewall creates entries in the routing table for reachable networks via those VPNs.
How to troubleshoot routing issues on pfSense?
This part explains how to check and troubleshoot routing issues on your pfSense firewall.
Viewing Routes:
You may use the route -n get [destination IP] command at the console to see how the firewall routes a specific address and check if the desired destination is listed with the expected route
Example 1: Default Route
Running route -n get 8.8.8.8 might show:
Destination:  0.0.0.0  (default  route)
Gateway:  198.51.100.1
Interface:  igb0
This indicates no specific static route exists for 8.8.8.8, so the default route is used.
Example 2: Specific Static Route
Running route -n get 8.8.4.4 might show:
Destination:  8.8.4.4
Gateway:  10.0.14.1  (alternate  gateway)
Interface:  igb5
Here, a static route directs traffic to 8.8.4.4 using the 10.0.14.1 gateway on interface igb5.
Using Traceroute:
Use traceroute to verify routes and troubleshoot multi-WAN setups. Traceroute shows each "hop" a packet takes to reach a destination, along with its latency. Access traceroute via Diagnostics > Traceroute in the GUI or use the traceroute [destination IP] command in the console.
Routes and VPNs
Some VPNs (like IPsec in tunnel mode) don't use the routing table. Static routes won't work with tunnel mode IPsec connections. OpenVPN, WireGuard, and VTI mode IPsec use the routing table and have entries for reachable networks.
Example: OpenVPN Route
Using netstat -rWn might show an OpenVPN route:
Destination  Gateway  Flags  Use  Mtu  Netif  Expire
...
10.6.0.0/16  10.6.203.1  UGS  0  1500  ovpnc2
This shows the OpenVPN interface (ovpnc2) with a gateway (10.6.203.1) for the 10.6.0.0/16 network.
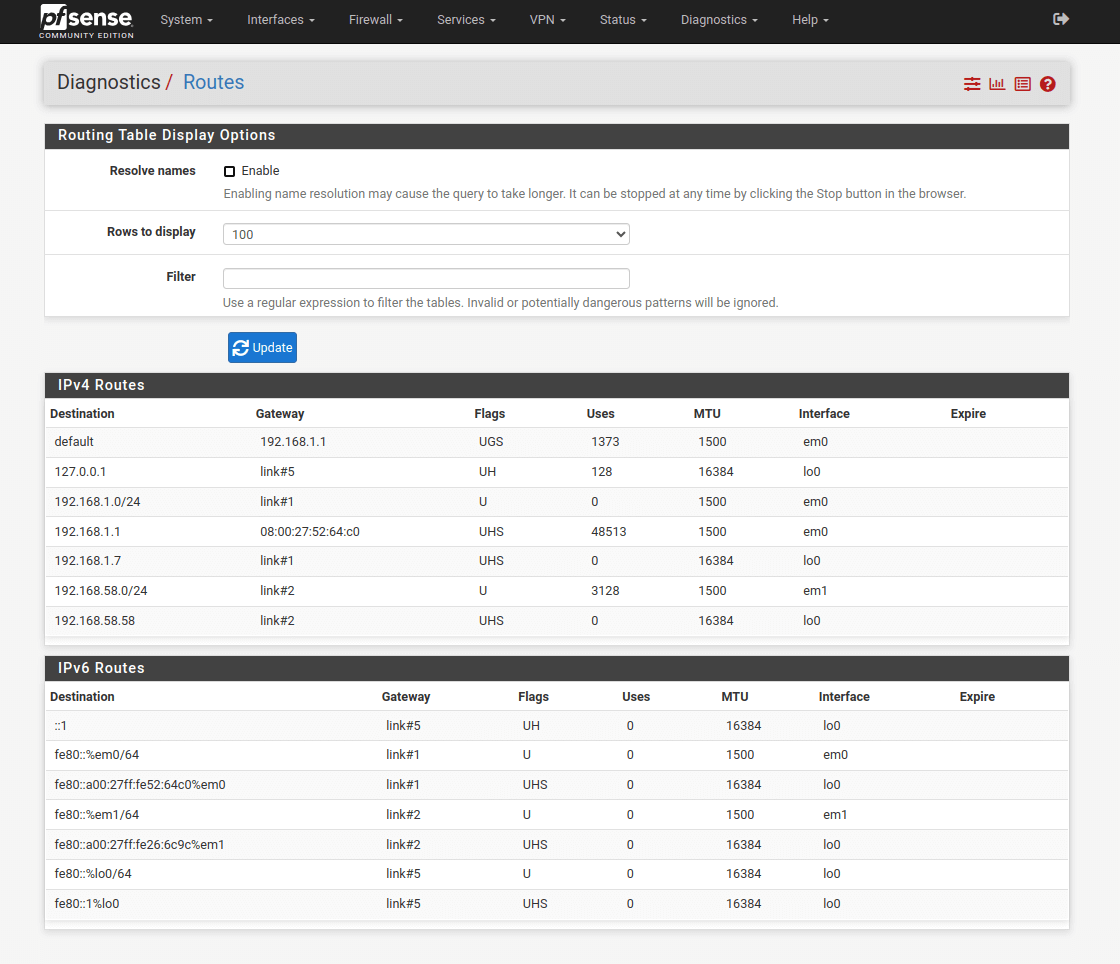
Figure 6. pfSense Diagnostics > Routes
Test Port
Test Port is a built-in tool in pfSense that allows you to see if your firewall can reach a specific port on another device. It essentially performs a basic TCP handshake to check if the target host is up and accepting connections on that particular port.
Why Use Test Port?
pfSense Test Port helps you troubleshoot connectivity issues related to your firewall's ability to connect to other devices on your network or the internet. Here are some common scenarios for using test port tool:
- Verifying if a server is online and accepting connections on a specific port (e.g., web server on port 80).
- Check if your firewall rules are configured correctly to allow traffic to a specific port on another device.
- Diagnosing potential issues with port forwarding.
How to Use Test Port in pfSense?
You may use Test Port tool on pfSense by following the next steps:
-
Navigate to Diagnostics > Test Port.

Figure 7. Pfsense Diagnostics > Test Port
-
Enter the IP address or hostname of the target device into Hostname field.
-
Specify the TCP Port number you want to test (e.g., 80 for web servers).
-
Optionally set a specific Source Port for the test.
-
You may enable Remote Text option to display text sent by the server upon connection.
-
You may choose a specific Source address for the test.
-
You may choose IP Protocol, IPv4 or IPv6, depending on the target device's network protocol.
-
Click Test.
The results will indicate whether the connection attempt was successful or not. If successful, it may display any text sent back by the server depending on the service and "Remote Text" option.
Firewall Status and Activity Diagnostic Tools
The primary purpose of Firewall Status and Activity Diagnostic Tools in pfSense is to monitor, analyze, and troubleshoot the functionality of your firewall. These tools provide valuable insights into how your firewall is handling network traffic.
Here's a breakdown of the Firewall Status and Activity Diagnostic Tools.
pfInfo
pfInfo is a diagnostic tool in pfSense that provides a wealth of information about how your firewall is handling incoming and outgoing traffic. Think of it like looking at the engine gauges in your car, it gives you insights into the performance and activity of your firewall.
pfInfo is located under Diagnostics > pfInfo. The page automatically refreshes by default, but you can uncheck the "Refresh" box to pause updates.
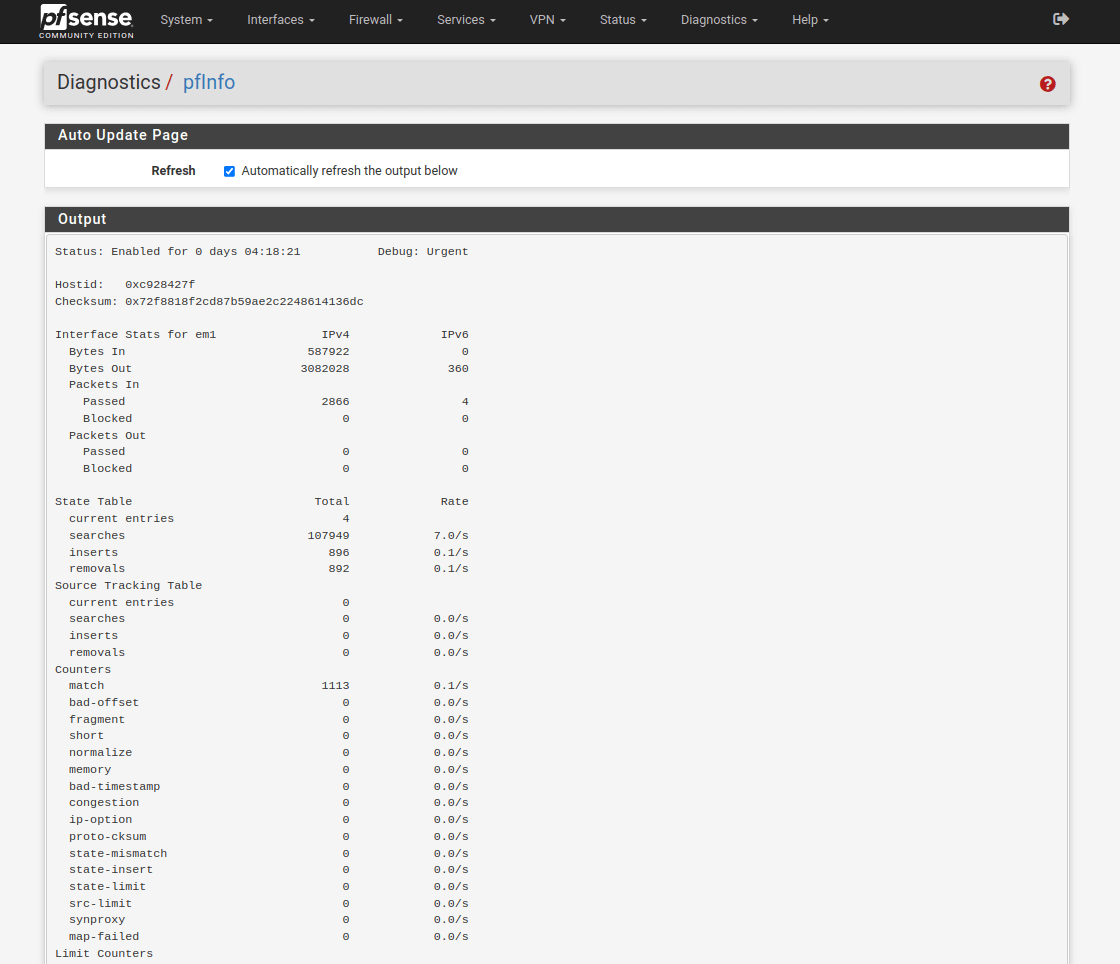
Figure 8. pfSense Diagnostics > pfInfo
pfInfo displays various statistics and counters categorized into sections. Here are some key areas:
- General Counters: This includes bytes and packets transferred in and out of the firewall, indicating overall traffic volume.
- State Table: This section shows how many active connections (sessions) your firewall is currently tracking. It also displays the rate at which new connections are being created and removed.
- Counters: This section provides details about unusual or malformed packets encountered by the firewall.
- Limit Counters: This tracks how often firewall rules with limitations (e.g., maximum connections per IP) are being reached.
- Table Size Limits: This shows the maximum capacity allowed for various tables used by the firewall.
- State Timers: This displays the timeouts configured for different connection states (e.g., how long an inactive connection is kept open).
- Interface Statistics: This section provides per-interface packet counters, allowing you to see traffic volume on each of your network connections.
How can pfSense users benefit from pfInfo?
By monitoring pfInfo, you can gain valuable insights into your firewall's health and performance. You can use pfInfo for the following purposes:
- Identify high traffic volumes or unusual activity.
- Diagnose potential bottlenecks or overloaded interfaces.
- Monitor the number of active connections and adjust firewall rules if needed.
- Troubleshoot issues related to specific protocols or packet types.
pfTop
pfTop is a powerful tool in pfSense that provides real-time insights into your firewall's inner workings. It acts like a traffic monitor, displaying information about active connections, firewall rules being used, and data transfer statistics
You can access pfTop in two ways:
-
GUI: Navigate to Diagnostics > pfTop. This is the most user-friendly option.
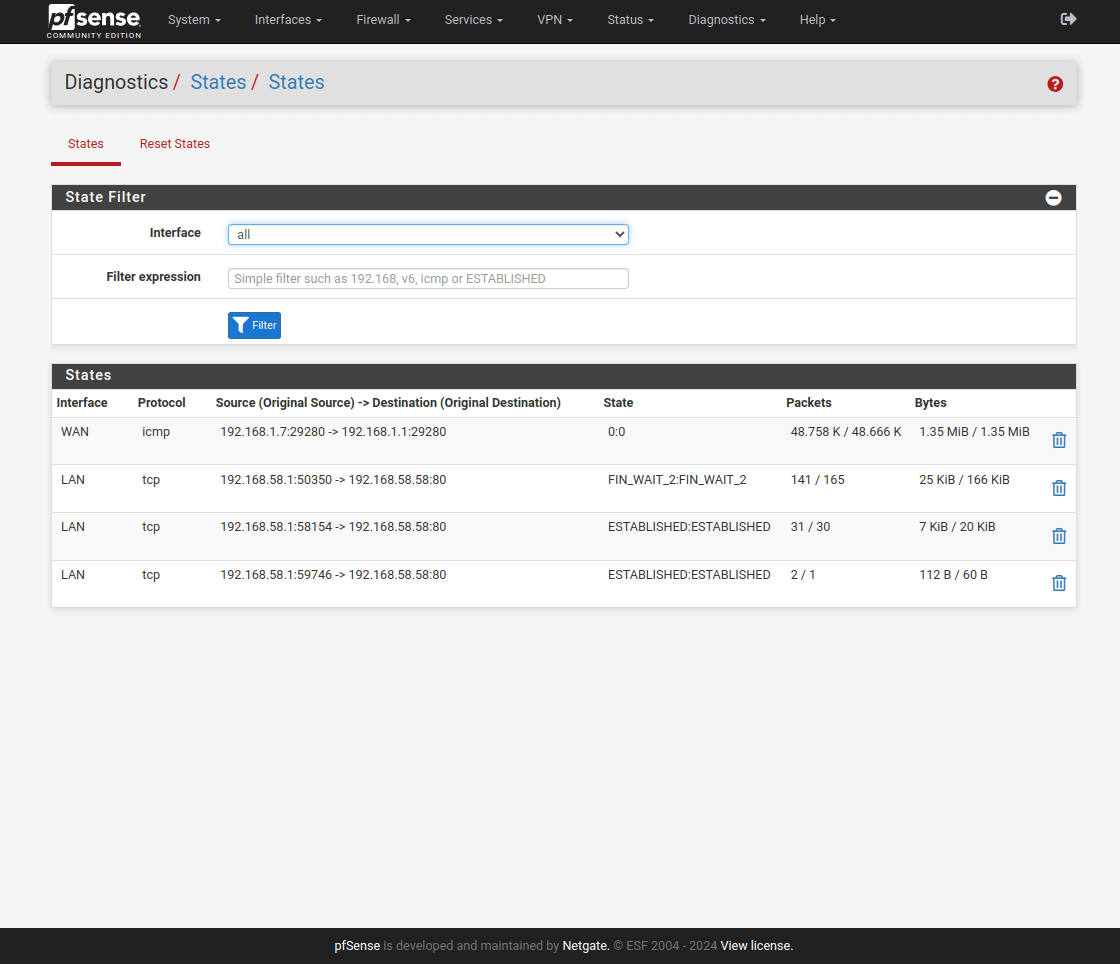
Figure 9. pfSense Diagnostics > pfTop
-
Console: If you prefer the command line, access pfTop through SSH or the console menu (option 9) and run the pftop command.
Understanding the pfTop Interface (GUI)
The pfTop interface offers various options to customize the information you see. Let's break down the key elements:
- View: This controls what data is displayed. Choose from options like "Default" (balanced view), "Label" (centered on rule descriptions), "Long" (detailed view for wide screens), and more.
- Filter Expression: Here, you can filter the displayed information based on specific criteria like protocol, address (source, destination, gateway), or direction (incoming/outgoing traffic).
- Sort By: Sort the displayed states (active connections) by various parameters like age, bytes transferred, IP addresses, ports, speeds, and more.
- Maximum # of States: Limit the number of entries shown on the page, especially helpful for large numbers of active connections.
States
pfSense uses a concept called "states" to keep track of active connections passing through your firewall. The Diagnostics > States page in the GUI provides a detailed view of these states, offering valuable insights into your network traffic.
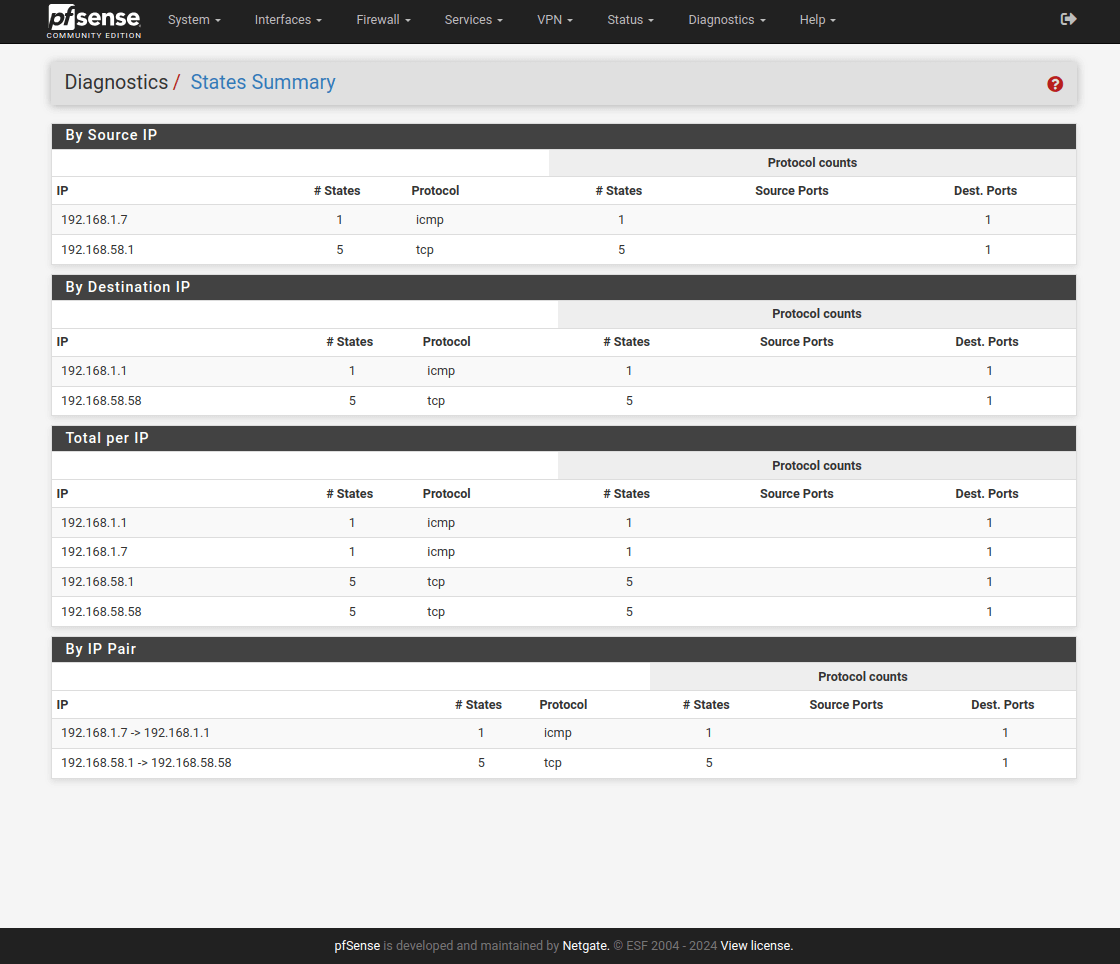
Figure 10. Pfsense Diagnostics > States
Each state entry displays the following details about a specific connection:
- Interface: The network interface through which the connection enters or exits the firewall.
- Protocol: The type of communication used, such as TCP (web browsing), UDP (streaming), or ICMP (ping).
- Source and Destination: This section shows the IP addresses (and sometimes ports) of the devices communicating, considering any Network Address Translation (NAT) applied by the firewall.
- State: This indicates the current stage of the connection, like "ESTABLISHED" for an active conversation or "SYN_SENT" if a device is waiting for a response. (Refer to the "Interpreting States" section for details on common state types.)
- Packets and Bytes: The total number of packets and data transferred for this connection.
- Action Button: You can remove individual states using the icon at the end of each row.
Using the State Filter
The "State Filter" panel allows you to search and narrow down the displayed entries:
- Interface: Choose a specific network interface to view its state table.
- Filter Expression: Enter a keyword or IP address to find specific connections. The search considers all columns.
Tips for Using States are given below:
- Filtering is crucial for systems with many active connections.
- You can remove all connections from a specific IP or subnet using "Kill States" after searching by IP address.
- The "Require State Filter" option in settings can prevent the page from loading until you filter the results, avoiding overwhelming data display.
Understanding State Types
A quick overview of some State Type examples are listed below:
- TCP States:
- SYN_SENT: Device is initiating a connection (waiting for response).
- ESTABLISHED: Two-way communication is fully active.
- TIME_WAIT/FIN_WAIT: Connection is closing down.
- UDP/Other Protocols:
- SINGLE: Device sent a single packet.
- MULTIPLE: Device sent multiple packets.
- NO_TRAFFIC: No response received from the destination.
By effectively using the States page and understanding state types, you can gain valuable insights into your network activity, troubleshoot connection issues, and monitor potential security concerns
How States are used on pfSense?
For diagnostic purposes, the following are some examples of how states can be used in PFSense:
- Monitor Network Activity: See what devices are talking, how much, and with what protocol. This helps troubleshoot connection issues and optimize firewall rules.
- Security Monitoring: Unusual connections or states like "SYN_SENT" might indicate suspicious activity like port scans.
- Network Management: Identify rogue devices, troubleshoot specific connections, and optimize network performance based on traffic patterns.
- Efficiency: States help pfSense filter packets faster by keeping track of active connections.
- Debugging: Analyze state information to understand traffic flow and debug firewall rules.
Overall, pfSense states provide valuable insights into your network's activity and security, allowing you to manage your firewall effectively.
States Summary
The State Summary (Diagnostics > States Summary) in pfSense offers a high-level overview of your active connections, providing a quicker way to identify potential issues.
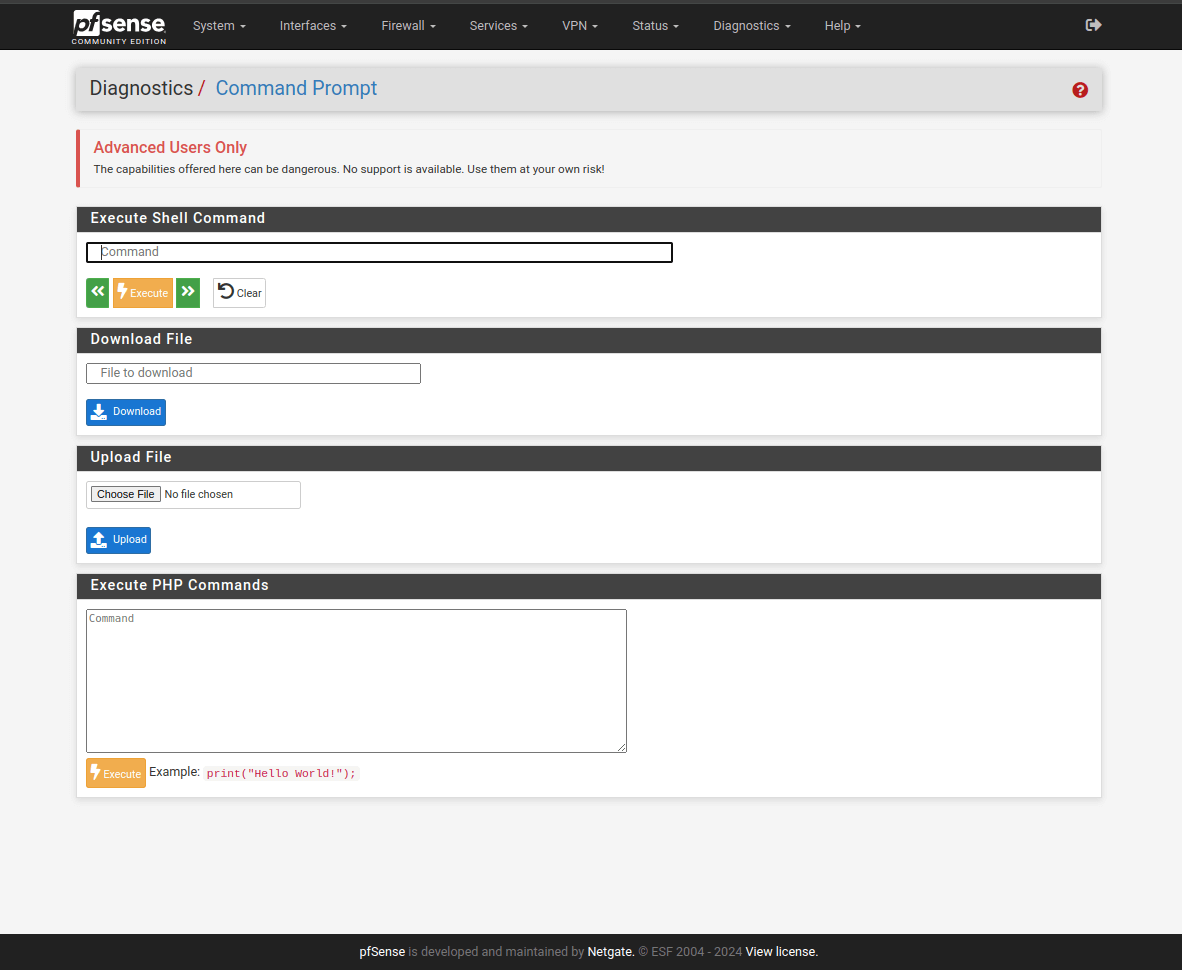
Figure 11. pfSense Diagnostics > States Summary
The State Summary categorizes connections based on various criteria:
- By Source IP Address: This helps pinpoint potential sources of attacks or port scans.
- By Destination IP Address: Useful for identifying servers or targets of attacks.
- Total per IP Address: Highlights devices using a lot of ports, like BitTorrent clients.
- By IP Address Pair: Shows connections between specific devices, helping identify unusual activity between client/server pairs.
How States Summary is used on pfSense?
States Summary is used on pfSense for the following purposes:
- Monitor Active Hosts: See which devices are currently connected and using your network resources.
- Identify Potential Threats: Look for suspicious activity like excessive connections from a single source or high numbers of connections on unusual ports.
- Investigate Specific Connections: Quickly pinpoint connections between specific devices for further analysis.
Processing the State Summary can be slow, especially with large state tables or limited processing power. In such cases, the page might not display correctly or even fail to load. If the State Summary is unavailable, consider using the regular States page (Diagnostics > States) for a more detailed, individual connection view, but be prepared for potentially overwhelming data.
By incorporating the State Summary into your monitoring routine, you can gain a quick snapshot of your network activity and identify potential security concerns or performance bottlenecks.
System Health and Management Diagnostic Tools
pfSense offers a variety of diagnostic tools for monitoring and managing the overall health and performance of your system. These tools allow you access to critical system functions but use caution as some can significantly impact your firewall's operation. Here's a breakdown of the System Health and Management tool :
Command Prompt
The Command Prompt in pfSense (Diagnostics > Command Prompt) offers advanced functionalities for experienced users. It allows you to execute shell commands, upload/download files, and even run PHP code directly on the firewall.
Using the Command Prompt incorrectly can potentially render your firewall unusable. Proceed with caution and only if you have a good understanding of command-line tools and PHP scripting. It's recommended to seek guidance from a support representative unless you're confident in your abilities. The Command Prompt is a powerful tool, but with great power comes great responsibility. Use it cautiously and only when necessary. If you're unsure, explore the web interface options or seek help from a qualified professional.
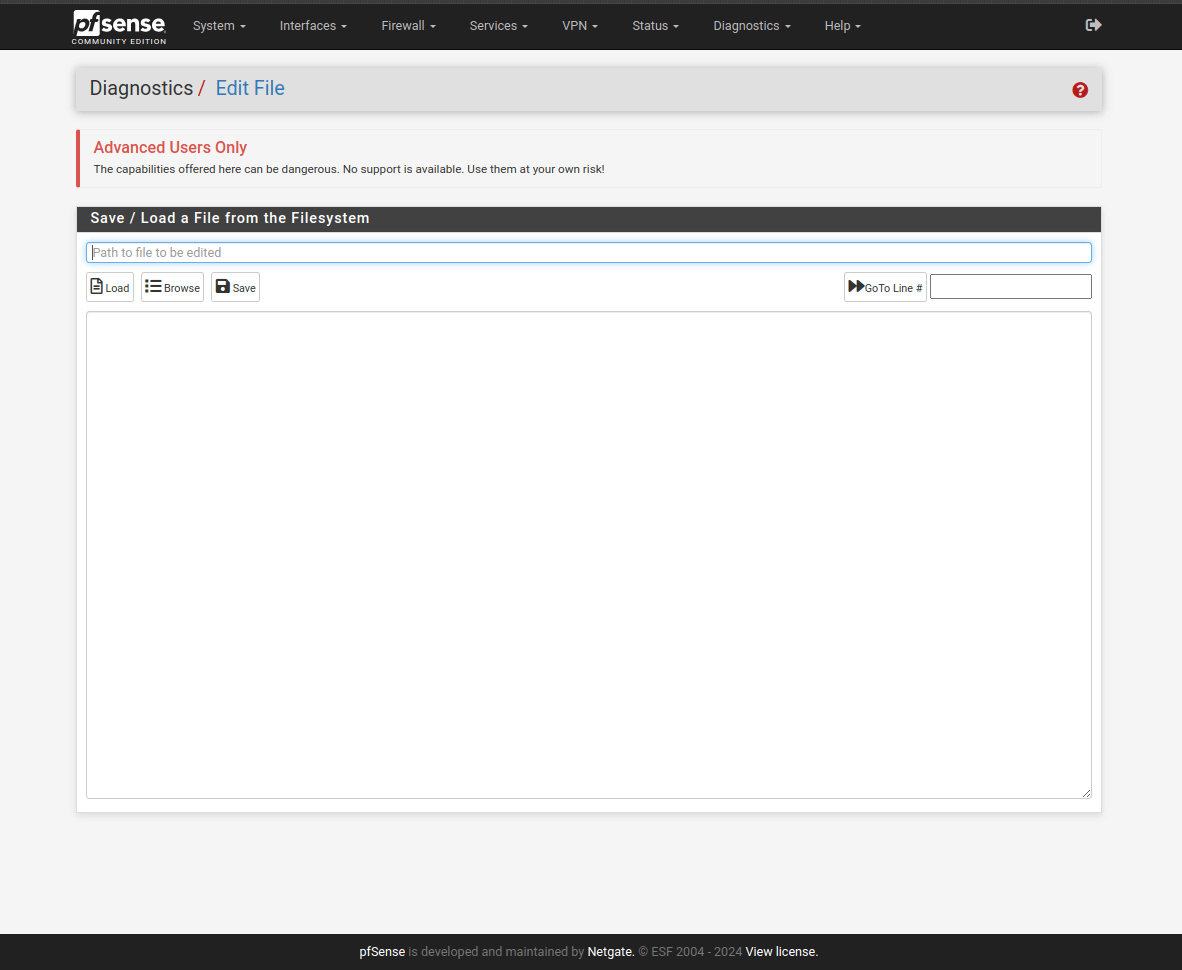
Figure 12. pfSense Diagnostics > Command Prompt
You can perform the following tasks with the Command Prompt:
- Execute Shell Commands: Run various commands as if you were using a console, allowing for detailed control over the firewall. Be aware that some commands like ping without a count or tcpdump without a limit can run indefinitely and require manual termination. Interactive commands like vi might not function properly due to the non-interactive nature of the interface.
- Download Files: Retrieve files directly from the firewall's filesystem by specifying the full path.
- Upload Files: Upload files from your local computer to the firewall's /tmp/ directory. You can then use other shell commands to move them to different locations if needed.
- Execute PHP Code: This allows for more advanced automation tasks by running PHP scripts directly on the firewall.
If you're not comfortable with the Command Prompt, pfSense offers alternative options for some tasks:
- The web interface provides many configuration options accessible through menus.
- Package Manager allows installing additional software packages for specific functionalities.
Edit File
While the pfSense web interface offers a wide range of configuration options, there might be situations where you need to edit specific configuration files for more granular control. pfSense provides a file editor (Diagnostics > Edit File) that allows advanced users to directly modify configuration files on the firewall. However, this is a powerful tool that can potentially render your firewall unusable if used incorrectly.
Editing the wrong file or introducing errors can seriously impact your firewall's functionality. Only use this feature if you have a strong understanding of firewall configuration and the specific file you're modifying. Consider seeking guidance from pfSense support or a qualified professional if you're unsure.
You may edit files by following the next steps:
-
Go to Diagnostics > Edit File on pfSense web UI.
Figure 13. pfSense Diagnostics > Edit File
-
Locate the File: Identify the exact file you need to edit. Common configuration files include firewall rules (/conf/config.xml) or specific package settings located in their respective directories.
-
Load the File: In the Edit File page, enter the full path to the file in the "Save/Load from path" field or use the "Browse" button to locate it. Click "Load" to open the file contents in the editor.
-
Edit with Caution: Make the necessary changes to the file content. Remember, even a small typo can cause problems.
-
Save and Reboot: Once satisfied with the edits, click "Save" to permanently modify the file. It's generally recommended to reboot the firewall afterward for the changes to take full effect.
Halt System
pfSense provides a safe way to shut down your firewall using the "Halt System" function. This is crucial before physically powering off the device to avoid data corruption or system instability.
You may halt pfSense via web GUI by following the next steps:
-
Navigate to Diagnostics > Halt System.
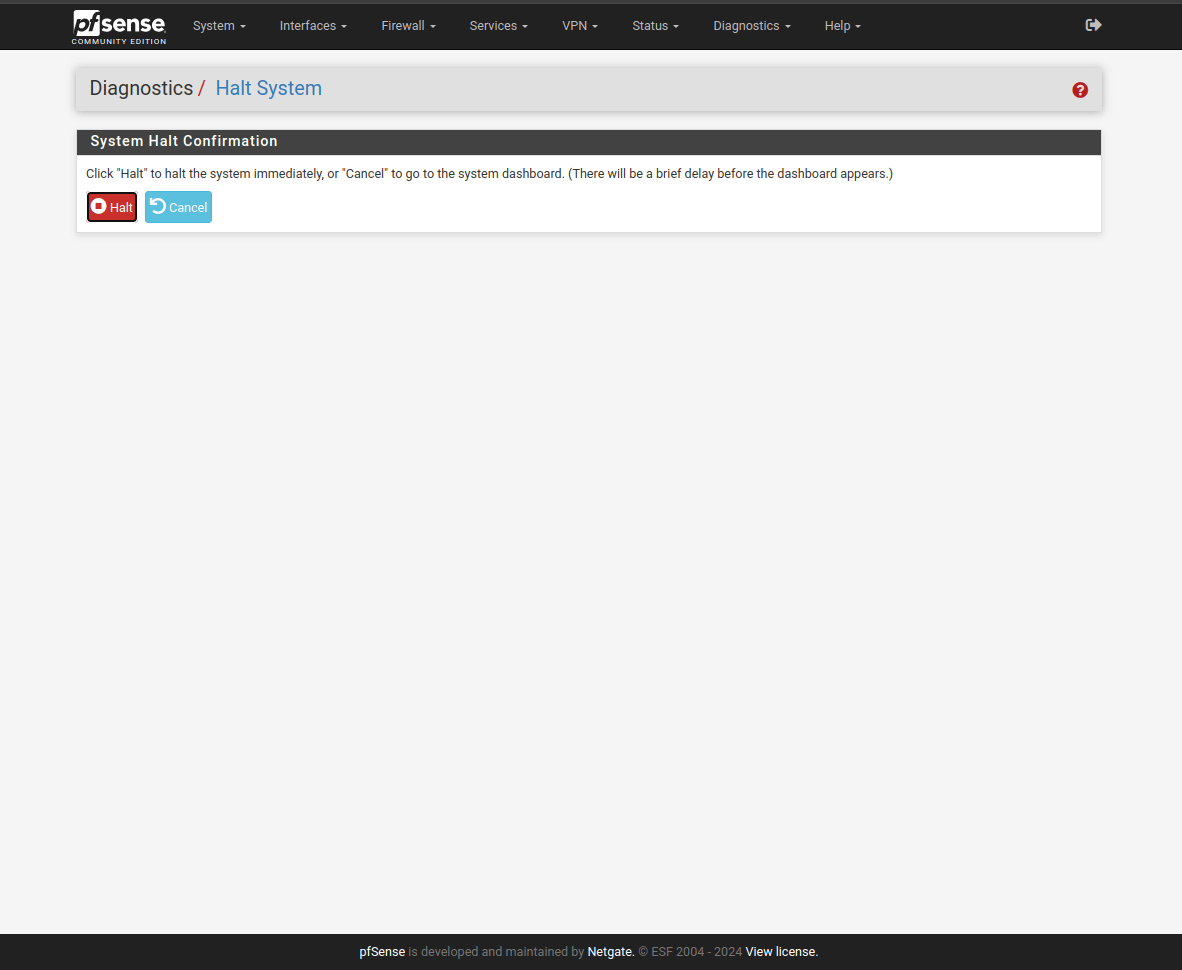
Figure 14. pfSense Diagnostics > Halt System
-
Click the Halt button.
-
In the confirmation window, click OK. This initiates the shutdown process.
You may halt pfSense via web Console by following the next steps:
- Access the console menu either locally or through SSH using an administrator account (like "admin" or "root").
- Identify the option number corresponding to "Halt system" (it might be number 6, but refer to your specific console for confirmation).
- Press Enter to select that option.
- Type y (for yes) to confirm the shutdown and press Enter again.
- Always halt the system before physically turning off the power. This ensures proper data flushing and avoids potential issues.
- After the operating system halts, some hardware might automatically shut off power as well.
- Schedule automatic shutdowns for maintenance or power saving using cron jobs (if applicable on your system).
- Consider using a UPS (Uninterruptible Power Supply) to protect your firewall from unexpected power outages.
Limiter Info
pfSense offers a feature called "Limiters" (Diagnostics > Limiter Info) that allows you to control and monitor bandwidth usage for specific purposes.
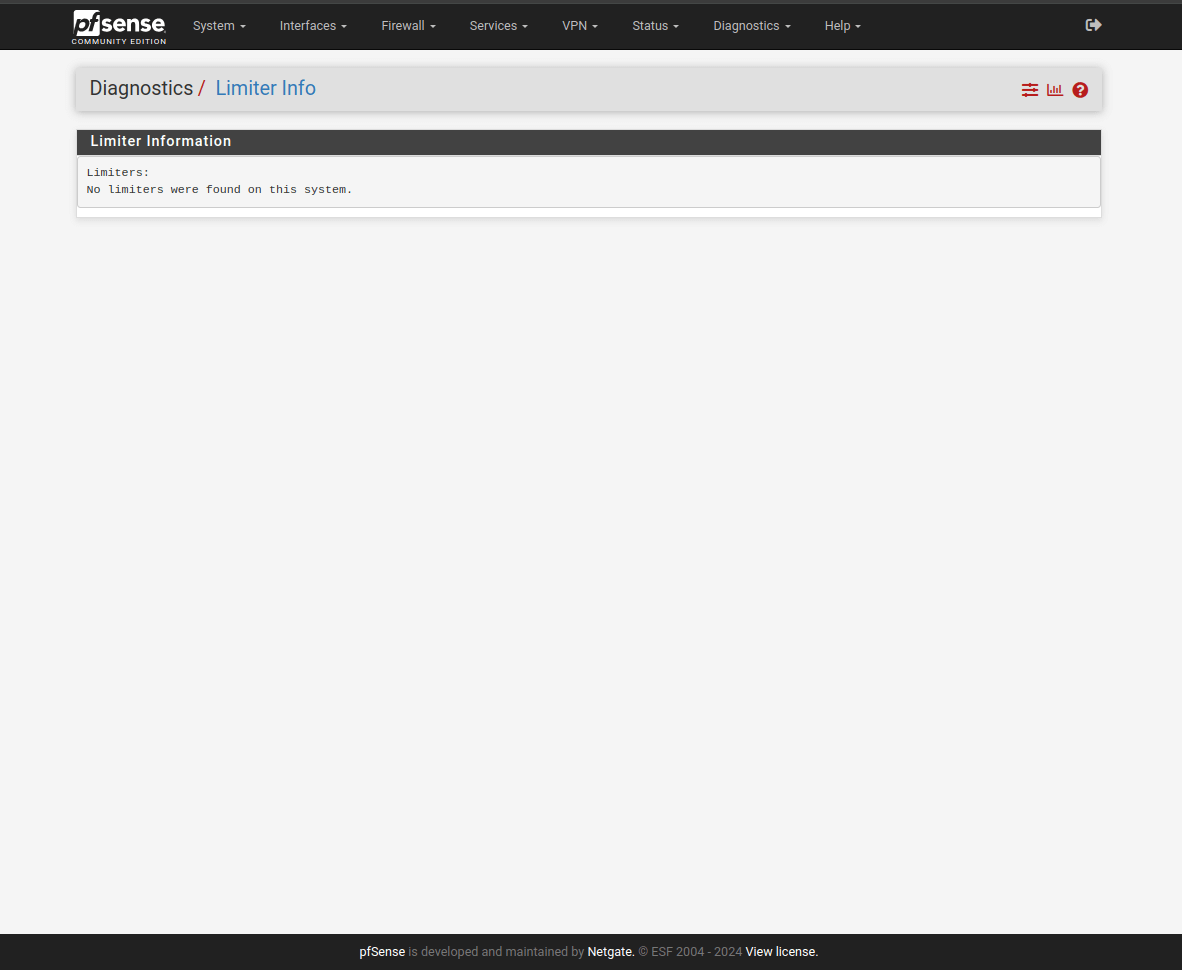
Figure 15. pfsense Diagnostics > Limiter Info
Limiters define maximum bandwidth for specific traffic types or devices on your network. Unlike Traffic Shaping (CBQ) which guarantees minimum bandwidth, limiters ensure traffic doesn't exceed a set limit.
Use Cases for Limiters are as follows:
- Limit Bandwidth per User: Allocate a specific internet speed for a particular device (e.g., limit user X to 1 Mbps).
- Fair Bandwidth Sharing: Distribute available bandwidth equally among multiple users on your network (e.g., share 10 Mbps equally between all LAN users).
- Network Segmentation Control: Limit the total bandwidth for a specific network segment (e.g., restrict "OPT" network to 5 Mbps).
- Protocol-Specific Limits: Control bandwidth usage for specific protocols like FTP (e.g., limit FTP traffic to 2 Mbps).
Understanding Limiter Info
The Limiter Info page displays the following details about active limiters in text format:
- Limiter Name: The name you assigned to the limiter.
- Bandwidth: The maximum bandwidth allocated to this limiter.
- Parameters: Additional settings for the limiter.
- Current Traffic Level: The real-time amount of traffic currently flowing through the limiter.
Using Limiter Info
This page provides a quick overview of your limiter usage. You can analyze traffic patterns and identify potential bottlenecks or areas where you might need to adjust
- Limiters are typically created in pairs: one for incoming traffic (Download) and one for outgoing traffic (Upload).
- Limiters are organized hierarchically, with a root limiter (main pipe) and child limiters (queues) with assigned weights (priorities).
By understanding Limiters and using Limiter Info effectively, you can gain control over bandwidth allocation and optimize network performance for your specific needs.
NDP Table (for IPv6)
pfSense uses the Neighbor Discovery Protocol (NDP) for IPv6 networks. The NDP table (Diagnostics > NDP Table) helps you see which IPv6 devices on your network have recently communicated with your firewall.
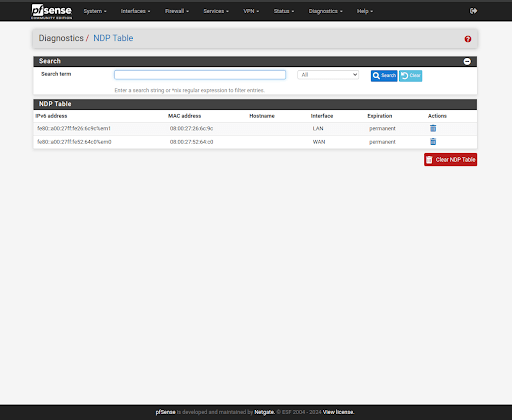
Figure 16. pfSense Diagnostics > NDPTable
Each entry in the NDP table provides details about a neighboring device:
- IPv6 Address: The unique address assigned to the device on your network.
- MAC Address: The physical address of the device's network interface card (NIC). If listed as "(Incomplete)", the firewall hasn't received a response yet.
- Hostname (if available): The device's name obtained through DNS reverse lookup (may not always be available).
- Interface: The network interface on your firewall where the device was seen.
- Expiration: How long the entry remains valid:
Permanent: Static entries for your firewall or specific devices.<time remaining>: Dynamic entries that expire if the device doesn't communicate within the specified time.
- Actions:
- Remove: Manually remove an entry (might be useful if a device's MAC address changes).
- Clear NDP Table: Clear all entries (rarely necessary, but can help if many devices change MAC addresses).
Use Cases for the NDP Table
Use Cases for the NDP Table are as follows:
- Troubleshooting Connectivity Issues: Identify devices having trouble communicating by checking their NDP entries.
- Verifying Firewall Rules: See if allowed devices are appearing in the table.
- Monitoring Network Activity: Track which devices are actively using your network.
- Security Monitoring: Look for unusual devices or excessive communication from specific addresses.
Packet Capture
pfSense offers a built-in tool for capturing network traffic packets, allowing you to analyze communication on your network. Packet Capture, located at Diagnostics > Packet Capture, acts like a recording device for your network traffic. It captures the data packets flowing through a specific network interface, enabling you to analyze details like source, destination, protocol, and content (if applicable).
Use Cases for Packet Capture are as follows:
- Troubleshooting Network Issues: Identify the root cause of connectivity problems by examining communication patterns.
- Security Monitoring: Analyze suspicious activity or potential security breaches by looking for unusual traffic patterns.
- Application Performance Analysis: Monitor application behavior and identify bottlenecks or inefficiencies.
- Verifying Firewall Rules: Confirm if allowed traffic is flowing through the firewall as expected.

Figure 17. pfSense Diagnostics > Packet Capture
Using Packet Capture
You may use packet capture on pfSense by following the next steps:
- Navigate to Diagnostics > Packet Capture.
- Configure Capture Options:
- Interface: Select the network interface to capture traffic from.
- Packet Capture Filter: Choose a preset filter or define a custom filter to narrow down the captured data (e.g., capture only traffic to a specific IP address or port).
- Packet Count: Set a limit on the number of packets to capture (recommended to avoid overwhelming captures).
- Packet Length: Choose how much data to capture from each packet (full packet or just headers).
- Promiscuous Mode: Enable this to capture all traffic on the interface, even packets not directly addressed to the firewall (use with caution, some drivers might not handle it well).
- View Options: Define how the captured data will be displayed in the GUI (e.g., enable name lookup for IP addresses).
- Click Start: This begins capturing packets. The captured data will be displayed in a live preview window.
- Click Stop (or wait for the count limit): This ends the capture and allows you to view the results.
Viewing Captured Data
You may view the captured data with the following ways on pfSense:
- View: This displays the captured packets in a standard tcpdump format within the GUI.
- Download: This allows you to save the captured data as a file for later analysis in a dedicated tool like Wireshark (recommended for in-depth analysis).
Reboot
Rebooting your pfSense firewall occasionally is a healthy practice, similar to restarting your computer. You may need to reboot your pfSense firewall for the following purposes:
- Applying Updates: After installing software updates, a reboot is often recommended to ensure the changes take full effect.
- Resolving Issues: Rebooting can sometimes clear temporary glitches or memory issues that might be causing problems.
- Maintaining Performance: Regular reboots can help prevent performance degradation over time.
Reboot Methods in pfSense
pfSense offers several ways to reboot, each with its advantages:
- Normal Reboot (Diagnostics > Reboot System): This is the traditional method, restarting the entire operating system. It's always available and reliable.
- Reroot (Diagnostics > Reboot System): This is a faster option that restarts core services without a full system reload. It's suitable for situations where a quick refresh is needed.
- Single User Mode (Console Only): This advanced option boots the firewall with minimal functionality for troubleshooting purposes. Use it with caution and only under the guidance of a qualified professional.
- Reboot with Filesystem Check (Diagnostics > Reboot System): This method reboots the firewall and performs a filesystem check to identify and fix potential issues. Use this if you suspect filesystem corruption.
How to Reboot pfSense
You may reboot pfSense via GUI (Graphical User Interface) by following the next steps:
-
Navigate to Diagnostics > Reboot System.
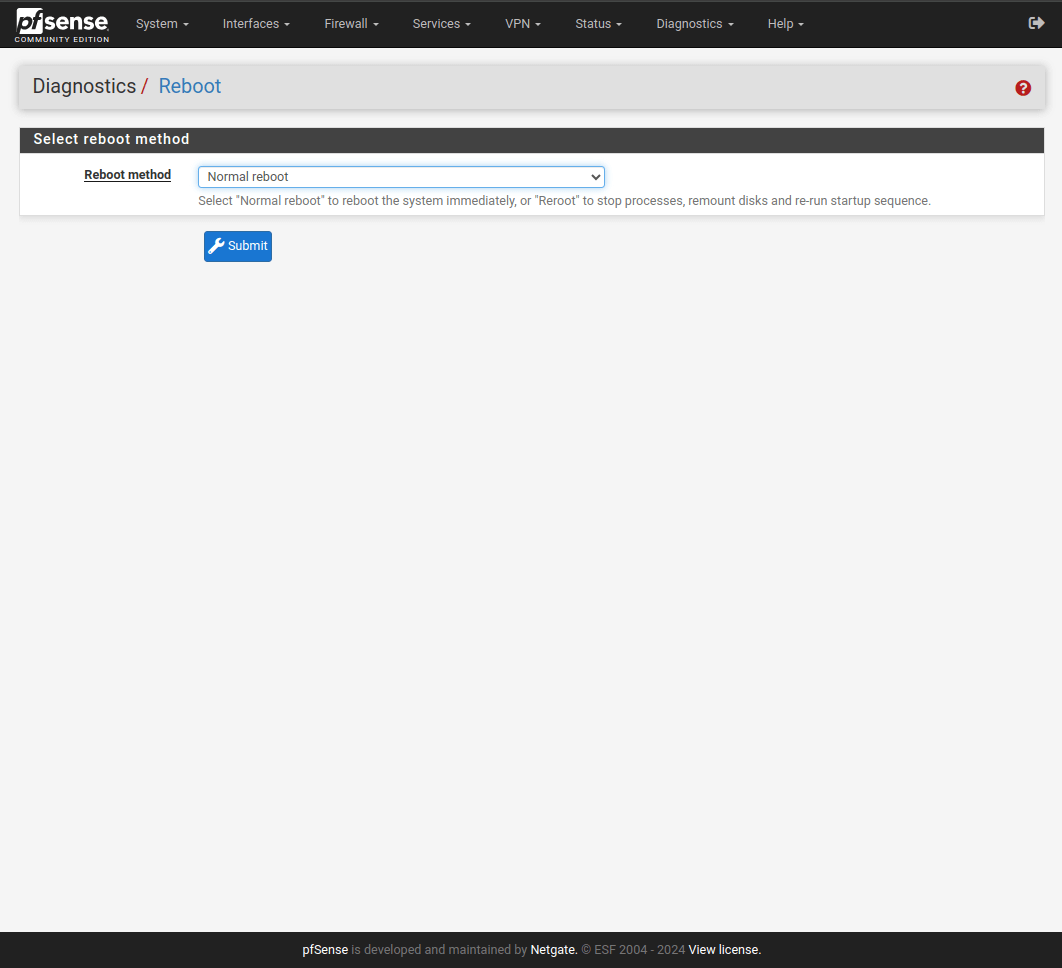
Figure 18. pfSense Diagnostics > Reboot
-
Choose your preferred reboot method from the options.
-
Click "Submit" to initiate the reboot process.
You may reboot pfSense via the Console by following the next steps:
- Access the console menu locally or via SSH with an administrator account.
- Select the menu option corresponding to "Reboot system".
- Press Enter.
- Choose the desired reboot method by entering the corresponding letter.
- Press Enter again.
SMART Status
pfSense offers a valuable tool called S.M.A.R.T. Status to monitor the health of your firewall's hard drives. S.M.A.R.T. stands for Self-Monitoring, Analysis and Reporting Technology. It's a built-in feature in most modern hard drives and SSDs that allows them to monitor their own performance and reliability. By tracking various indicators, S.M.A.R.T. can potentially identify potential failures before they cause data loss or outages.
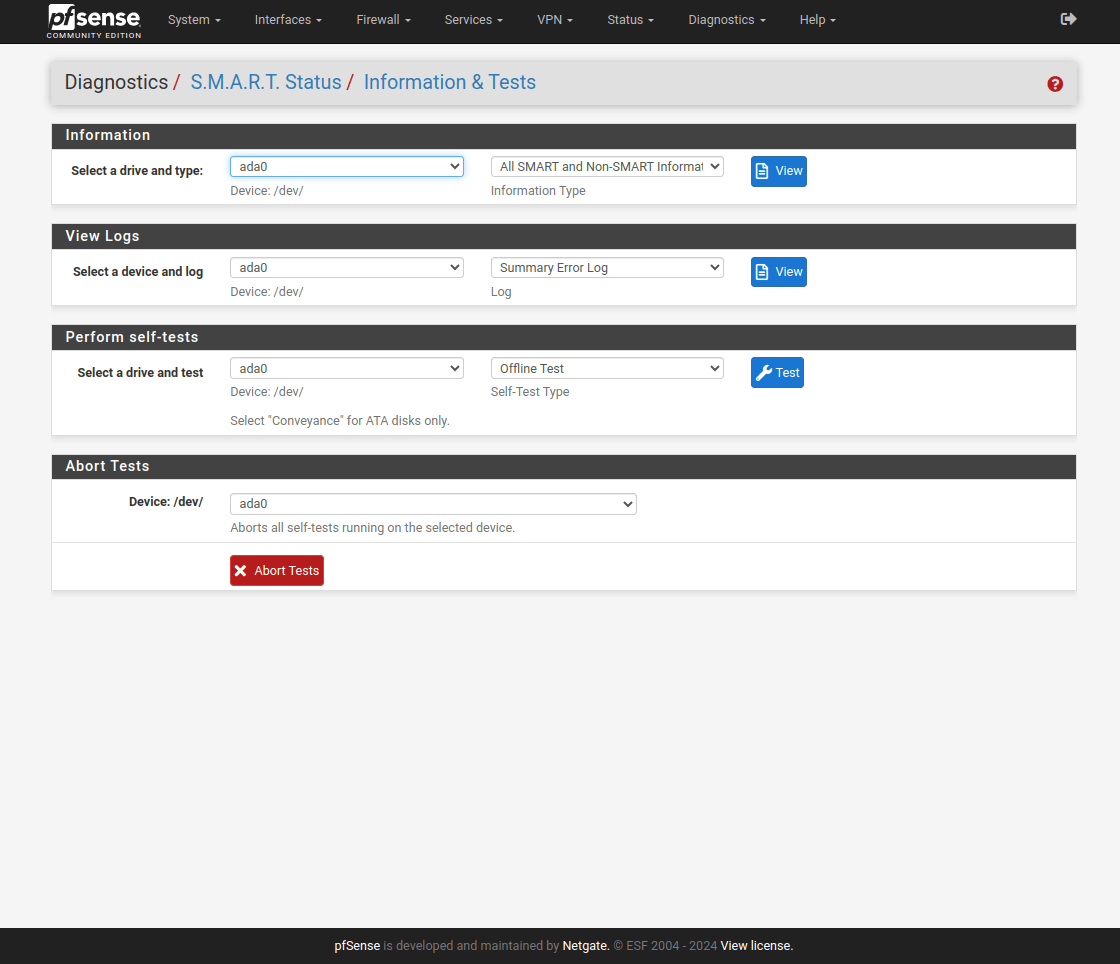
Figure 19. pfSense Diagnostics > SMART Status
Sockets
pfSense uses the Diagnostics > Sockets page to display information about active connections on your firewall. Understanding sockets and how to interpret this page can be a valuable diagnostic tool.
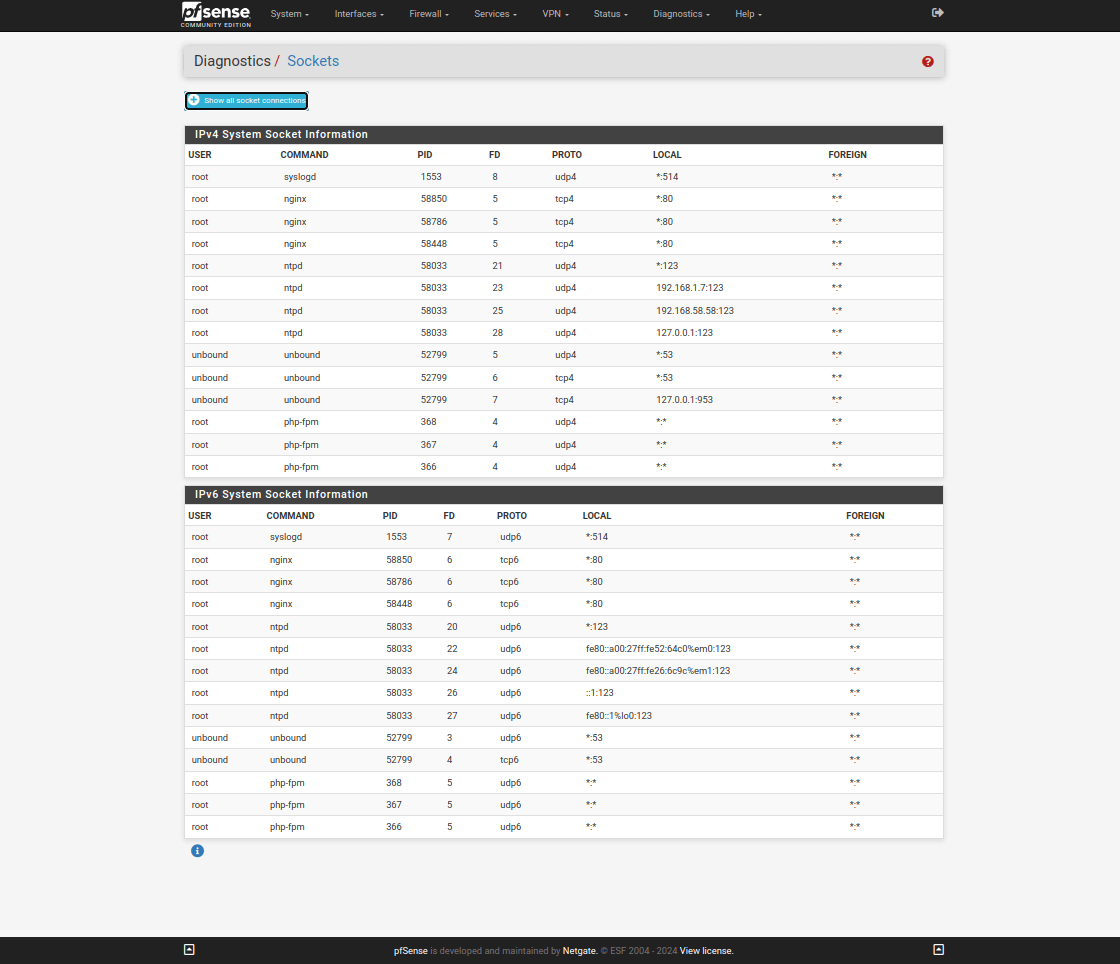
Figure 20. pfSense Diagnostics > Sockets
A socket is a virtual endpoint used for communication between programs on a network. It's like a dedicated channel established between two applications for exchanging data. pfSense itself uses sockets for various purposes, such as:
- Web interface (GUI) access
- Communication with daemons (background services)
- Outbound connections to update repositories or retrieve information
Using Sockets for Diagnostics
The Sockets page provides valuable information for troubleshooting network connectivity issues. Here's how to use Sockets:
-
Understanding the Data: The page displays information in columns:
- User: The operating system user associated with the socket (usually root for system processes).
- Command: The program or daemon using the socket (e.g., httpd for the web interface).
- PID: The process ID of the program using the socket.
- FD: The file descriptor number for the socket (internal system identifier).
- Proto: The transport protocol and address family (TCP4, UDP6, etc.).
- Local: The local IP address and port of the socket on your pfSense box.
- Foreign (Optional): The remote IP address and port for outbound connections (only shown when "Show all socket connections" is clicked).
-
Analyzing Connections: By default, the page shows only "listening" sockets. These are sockets actively waiting for incoming connections on specific ports. Clicking "Show all socket connections" reveals additional information:
- Established connections: These sockets are actively communicating with another device on the network.
- Outbound connections: These sockets represent connections initiated by pfSense to external servers.
-
Troubleshooting with Sockets: Here are some ways to use sockets for diagnostics:
- Identify services: See which ports are being used by specific services like the web GUI (port 80) or OpenVPN (port 1194).
- Verify service status: If a service is not functioning, check the Sockets page for activity on its designated port. Missing entries might indicate a service issue.
- Debug outbound connections: Identify if pfSense can connect to external servers by looking for established sockets with remote IP addresses.
- Track resource usage: A high number of sockets can indicate heavy network activity or potential resource exhaustion.
System Activity
The Diagnostics > System Activity page in pfSense is a vital tool for monitoring your firewall's overall health and performance. It provides a real-time snapshot of various system resources, similar to the output of the top command on the command line.
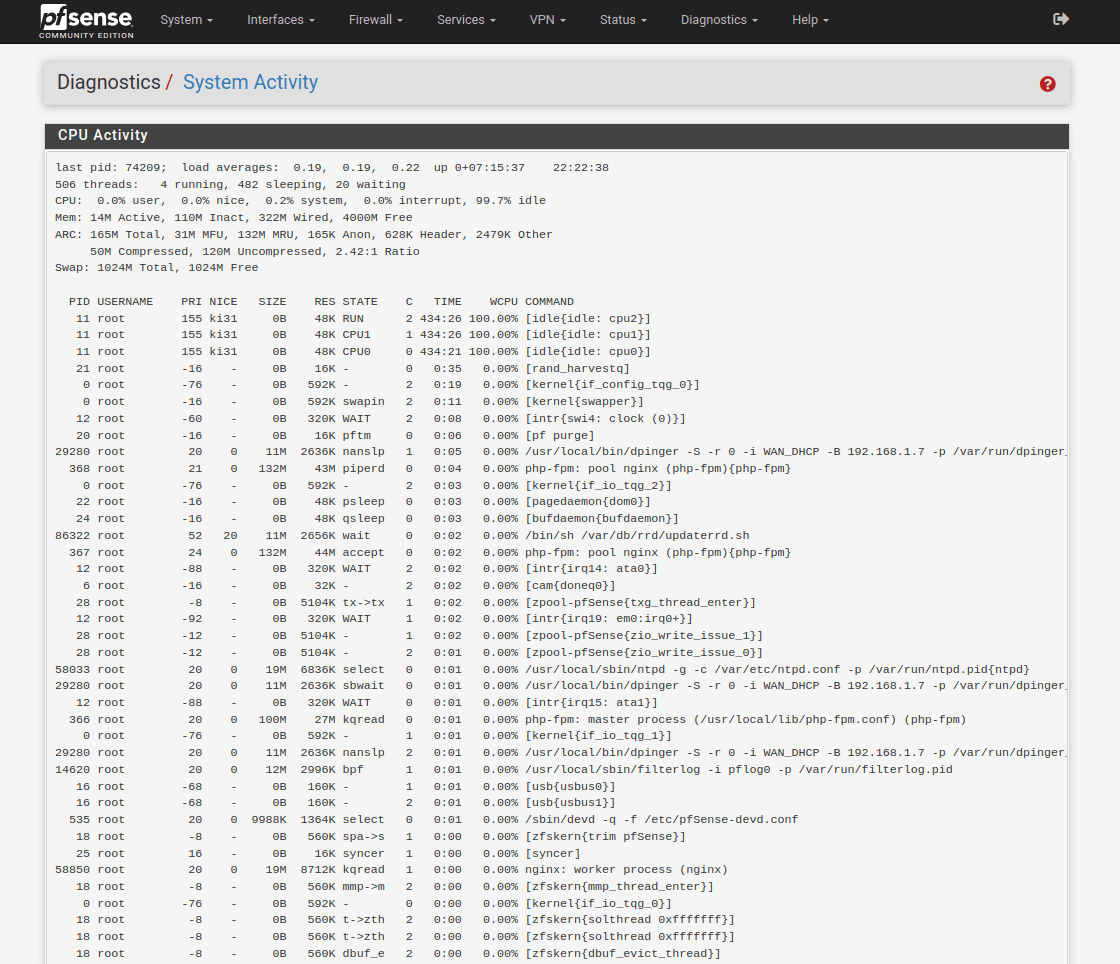
Figure 21. pfsense Diagnostics > System Activity
The system activity page displays the following key metrics about your pfSense system:
- System Load Average: This indicates how busy your firewall's CPU has been over the past minute, 5 minutes, and 15 minutes. A high load average for extended periods might suggest performance bottlenecks.
- Process States: It shows the number of processes in various states like running, sleeping, waiting, etc. A high number of "waiting" processes could indicate a resource crunch or a specific application causing delays.
- CPU Usage: This displays the percentage of CPU time currently being utilized by the system. A consistently high CPU usage could signal the need for a hardware upgrade or performance optimization.
- Memory Usage: This provides a breakdown of memory allocation for different areas like active processes, cached data, and buffers. High memory usage can lead to performance issues. Reference the "Memory Management" documentation for details on each memory category.
- ZFS ARC Usage (if applicable): If your pfSense uses ZFS storage pools, this section shows how the Adaptive Replacement Cache (ARC) is utilizing memory. The ARC improves storage performance. Refer to "ZFS Tuning" documentation for managing ARC usage.
- Swap Memory Usage: This displays how much swap space (hard drive used as virtual memory) is being utilized. Frequent swap usage indicates insufficient RAM for current tasks.
- Active Processes: This is a list of currently running processes on your firewall. You can see their CPU and memory consumption.
Using System Activity for Diagnostics
The System Activity page helps you identify potential performance issues and troubleshoot them. Some ways to use System Activity are as follows:
- Monitor CPU Usage: If the CPU usage consistently reaches 100%, it might be time to consider a hardware upgrade or optimize resource allocation.
- Identify Resource-Intensive Processes: Look for processes consuming a disproportionate amount of CPU or memory. This could indicate a specific application causing performance issues.
- Investigate High Load Average: A persistently high load average suggests your firewall is struggling to keep up with network traffic. Analyze other metrics like CPU and memory usage to pinpoint the bottleneck.
- Monitor Memory Usage: If free memory consistently drops low, it might be wise to investigate memory leaks or consider adding more RAM.
- Track ZFS ARC Usage (if applicable): A well-tuned ARC can improve storage performance. Monitor ARC usage to ensure it's effectively utilizing memory.
- Monitor Swap Usage: Frequent swap usage indicates the system is relying heavily on disk space to compensate for insufficient RAM. Consider adding RAM or reducing memory usage by applications.
Tables
pfSense uses tables to organize and manage lists of IP addresses, networks, or hostnames used in firewall rules. These tables offer flexibility and simplify rule creation. Think of tables as named lists that pfSense can reference within firewall rules. Types of Tables in pfSense are as follows:
- Static: These tables contain predefined entries that rarely change, like the "bogons" list of unused IP ranges.
- Dynamic: These tables are automatically populated based on events, like "sshguard" containing IP addresses that failed repeated login attempts.
Benefits of Using Tables
The benefits of using tables are listed below:
- Maintainability: Updating a single entry in a table reflects across all rules referencing it, making rule management easier.
- Readability: Firewall rules become clearer when referencing named tables instead of scattered IP addresses.
- Flexibility: Tables allow the creation of reusable lists for different purposes.
Accessing and Using Tables
You may access and view tables by following next steps:
-
Go to Diagnostics > Tables to view tables.
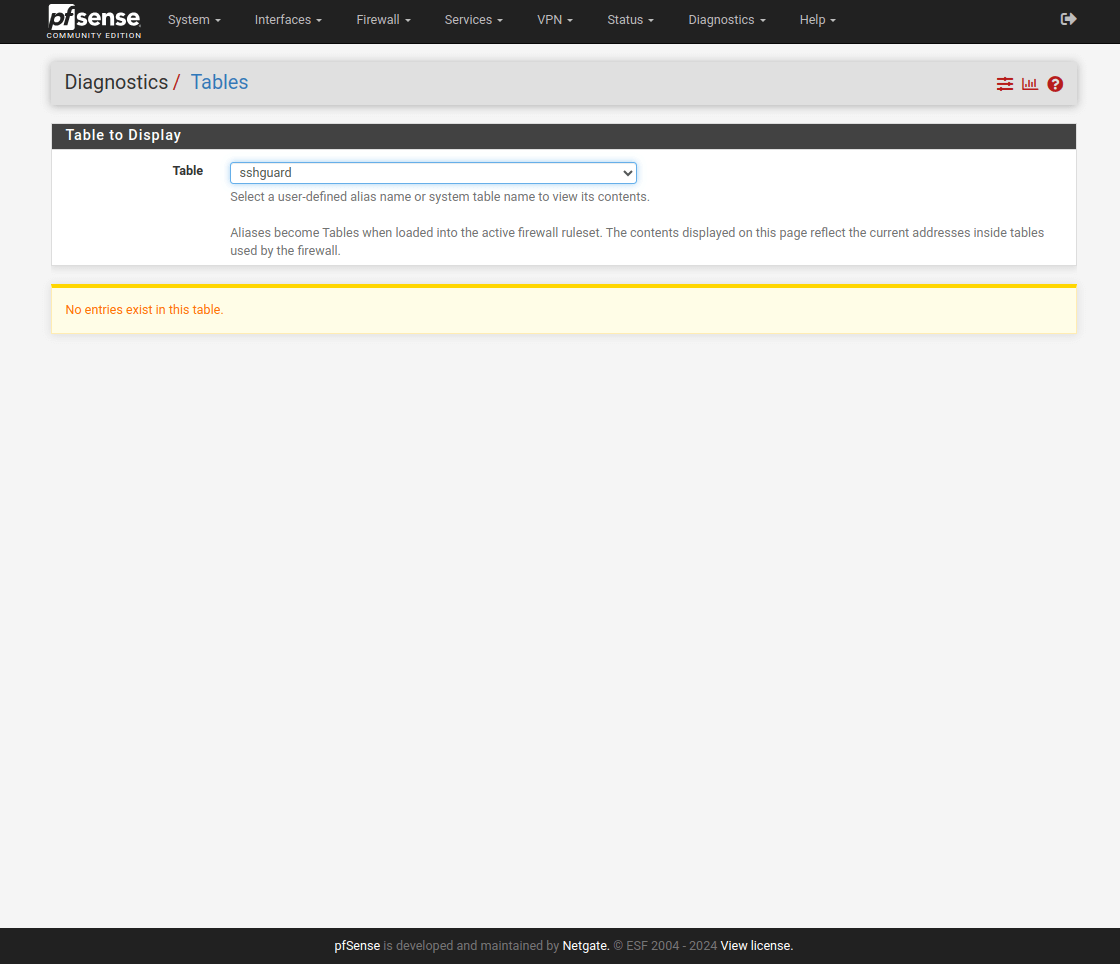
Figure 22. pfSense Diagnostics > Tables
-
Choose the desired table from the Table dropdown menu.
-
The page will display entries in the selected table.
-
To removing entries (Dynamic Tables) use the X icon next to an entry to remove it from a dynamic table before its automatic expiration.
Don't use this for manually created or file-based tables. Edit the alias and remove the entry there instead.
What are Default Tables in pfSense?
Default Tables in pfSense are listed below:
- bogons/bogonsv6: These tables list unused IP ranges, automatically blocked if "Block Bogon Networks" is enabled on any interface. You can manually update them using the Update button.
- cpzoneid: Internal tables used by Captive Portal, not intended for manual management.
- negate_networks: This table holds networks where the firewall has created policy route negation rules.
- snort2c: Dynamically populated with blocked IP addresses identified by IDS/IPS systems (Snort or Suricata).
- sshguard: This dynamic table lists IP addresses with repeated failed login attempts for SSH or the GUI.
- tonatsubnets: When using automatic outbound NAT, this table contains networks for which outbound traffic is automatically translated.
- virusprot: A dynamic table containing IP addresses exceeding predefined limits set in firewall rules.
- vpn_networks: This table lists remote networks accessible through VPN connections.
Using Tables for Diagnostics
You may use Tables for the following diagnostics purposes on pfSense
- Investigate NAT Issues: Check the "tonatsubnets" table to confirm if specific subnets are covered by automatic outbound NAT.
- Identify Blocked IPs: Review "snort2c" and "sshguard" tables to see IP addresses blocked by IDS/IPS or failed login attempts.
- Verify Bogon Blocking: Ensure the "bogons" tables are populated and up-to-date for effective blocking.
Configuration Management Diagnostic Tools
pfSense provides a robust set of diagnostic tools specifically designed to manage your firewall's configuration. These tools are essential for ensuring your firewall operates efficiently and securely. Let's delve into some key tools and explore their purposes in diagnosing configuration issues:
Authentication (testing)
pfSense provides a built-in tool at Diagnostics > Authentication to test login credentials against your configured authentication servers. This guide equips you with the knowledge to troubleshoot common login issues using this tool.
You may test authentication by following the next steps:
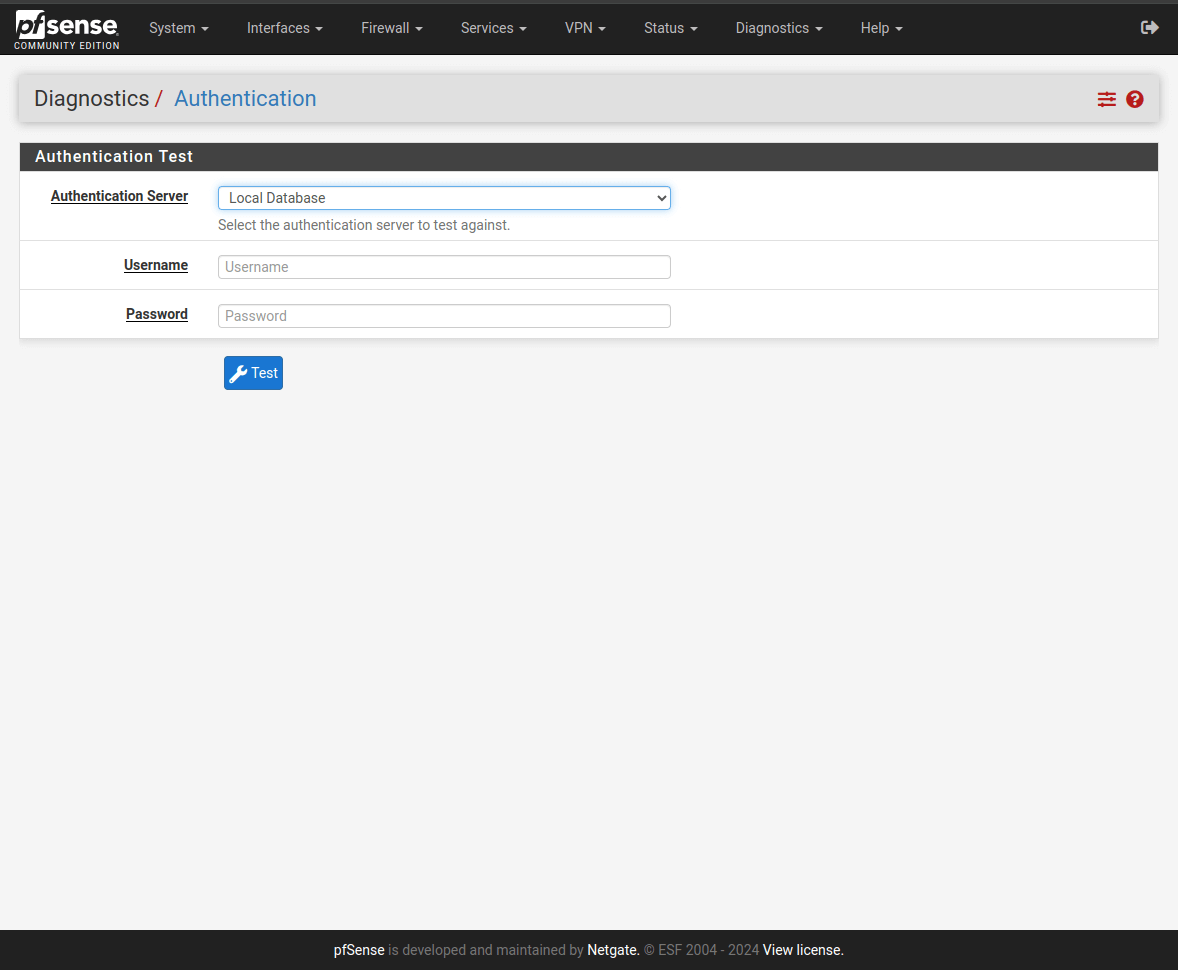
Figure 23. pfSense Diagnostics > Authentication
- Navigate to Diagnostics > Authentication.
- Select the Authentication Server: Choose the server you want to test (e.g., RADIUS, LDAP).
- Enter Username and Password: Provide the credentials you want to verify.
- Click "Test."
The tool displays the results of the authentication attempt. A successful test confirms the credentials are valid for the chosen server.
Common Issues and Solutions
Common authentication issues and their solutions on pfSense are outlined below:
- RADIUS Authentication Server
- Missing/Incomplete RADIUS Reply Attributes: The firewall might not support a large number of attributes returned by the RADIUS server. Reduce the number of attributes on the server if possible.
- LDAP Authentication Server
- Incorrect LDAP DN: Verify the Base DN and Search Scope match your LDAP server's configuration. Use an LDAP browser to locate the correct settings.
- Bind Credential Issues: Ensure the username for authenticated binds is correct and has sufficient permissions on the LDAP server.
- Group Membership Issues: Double-check the "Search Scope Level" and "Extended Query" settings to ensure they accurately reflect how groups are defined on your LDAP server.
- Connection Issues
- Non-SSL/TLS: Verify the LDAP server is listening on the correct port and that your network connectivity is functional. Use packet capture tools like Wireshark to analyze network traffic.
- SSL/TLS:
- Restart PHP and GUI: After making configuration changes with SSL/TLS, restart these services for the changes to take effect.
- Hostname Required: The server's hostname used in the configuration must match the server certificate's Common Name (CN) or Subject Alternative Name (SAN).
- Correct Port: Ensure the configured port (389 for STARTTLS or 636 for ldaps) matches the port the LDAP server is listening on.
- CA Certificate: Import the correct CA certificate used by the LDAP server into pfSense's Certificate Manager.
- Server Logs and Packet Captures: Consult the LDAP server logs and utilize packet captures to identify errors originating from the server itself.
By following these steps and understanding common pitfalls, you can effectively troubleshoot login issues using pfSense's Authentication Testing tool and ensure a secure login experience for your users.
Backup & Restore
Imagine this: you've spent hours configuring your pfSense firewall, creating firewall rules, setting up VPNs, and fine-tuning everything for optimal security and network performance. Suddenly, something goes wrong. Maybe a configuration mistake, a hardware failure, or even a power outage. Now your carefully crafted firewall settings are gone, leaving your network vulnerable.
This is where backups come in as lifesavers. A pfSense firewall backup is a snapshot of your entire configuration at a specific point in time. It captures all the settings, rules, and policies you've defined, essentially creating a digital image of your firewall's brain. We will explain a few concepts before we get into the specifics of backing up and restoring pfSense firewall.
- Backup Compatibility: Backups and firewall versions need to be compatible for successful restoration. This depends on the Configuration Revision number, not just the software version.
- Full vs. Partial Backups: A full backup restores the entire configuration, while a partial backup restores a specific section (e.g., firewall rules).
- Upgrading vs. Downgrading: Backups with a lower revision can be upgraded during restore. Backups with a higher revision cannot be restored to older versions.
- Encryption: Backups can be encrypted for security. You'll need the password to restore them.
All you need to know about backing up and restoring your pfSense firewall are explained below:
-
Choosing the Restore Method: There are 3 restore methods on pfSense:
- GUI Restore (Simple but Requires Additional Setup): This is the easiest method for most users but requires a separate PC connected to the network.
- Configuration History Restore (Minor Issues): Use this for recovering from minor configuration mistakes. It doesn't require an additional PC.
- Mounting the Disk Restore (Advanced): This advanced method involves attaching the pfSense storage disk to another machine for direct file access.
-
Restoring with the GUI: You may follow the next steps to restore via pfSense GUI:
- Navigate to Diagnostics > Backup & Restore.
- Click the "Restore Backup" section.
- Select the restore area (entire configuration or specific section).
- Browse and select the backup file.
- Click "Restore Configuration". The firewall will reboot and apply the restored settings.
-
Restoring from Configuration History: You may follow the next steps to restore from Configuration History on pfSense:
- Go to Diagnostics > Backup & Restore.
- Click the "Config History" tab.
- Locate the desired backup in the list (based on date and configuration version).
- Click the restore icon for that configuration. This won't trigger a reboot automatically. Some changes might require a manual reboot for full effect.
-
Restoring by Mounting the Disk (for Advanced Users): You may follow the next steps to restore by mounting the disk:
- Attach the pfSense storage disk to a computer running FreeBSD.
- Mount the disk and locate the /cf/conf/config.xml file (location might vary depending on disk setup).
- Copy the desired configuration file onto the target pfSense system.
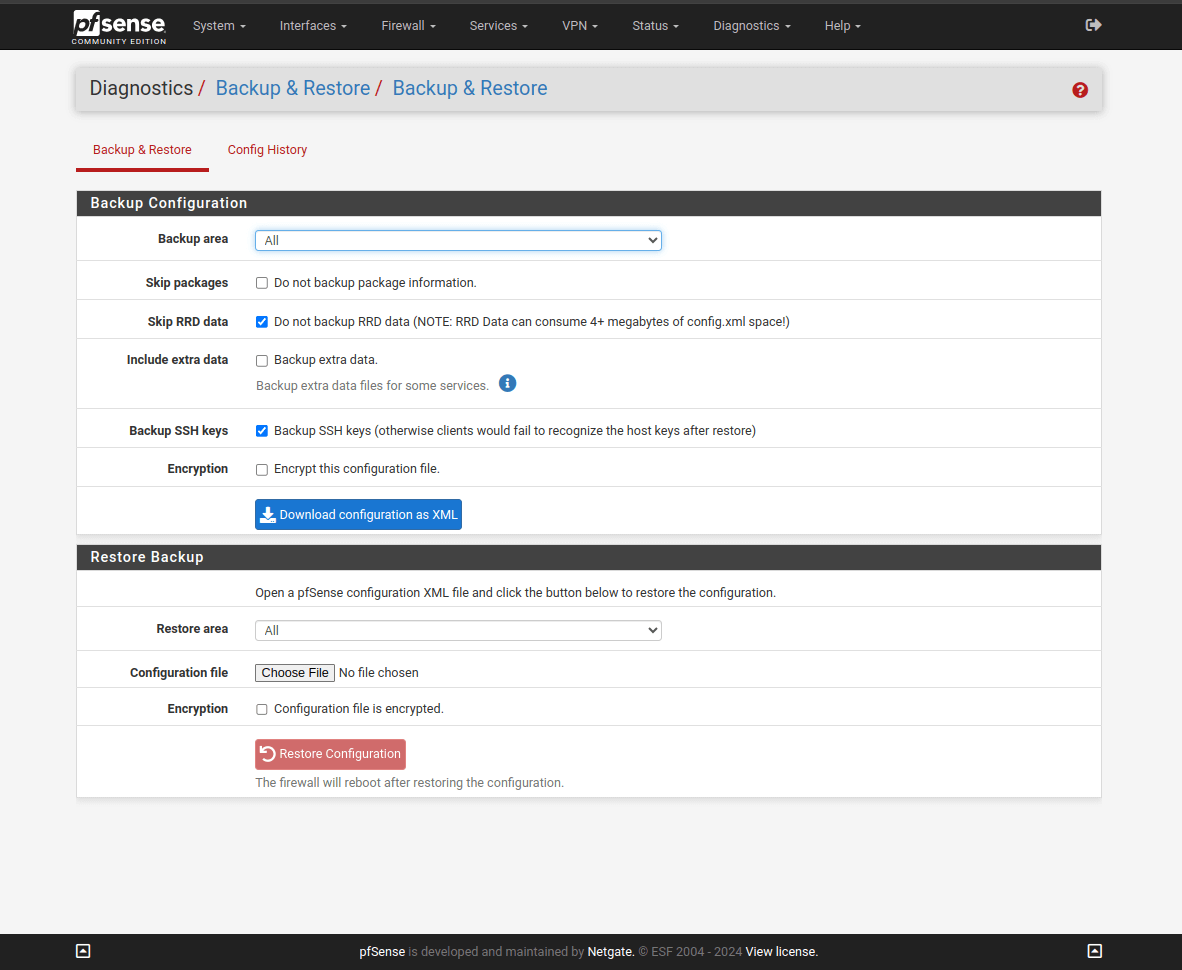
Figure 24. pfsense Diagnostics > Backup & Restore
Factory Defaults
Resetting your pfSense firewall configuration to factory defaults is a useful option in several scenarios. Perhaps you've made significant configuration changes that have caused instability or unexpected behavior, and you want to revert to a known good state. Maybe you're troubleshooting a complex issue and suspect configuration corruption. Or, you might be preparing to decommission a pfSense appliance and want to ensure all sensitive data and customized settings are wiped clean.
The factory reset process essentially takes your pfSense firewall back to a blank slate, removing all custom firewall rules, NAT configurations, VPN settings, DHCP scopes, and other customizations you've made. Additionally, it attempts to uninstall any third-party packages you've installed through the pfSense package manager.
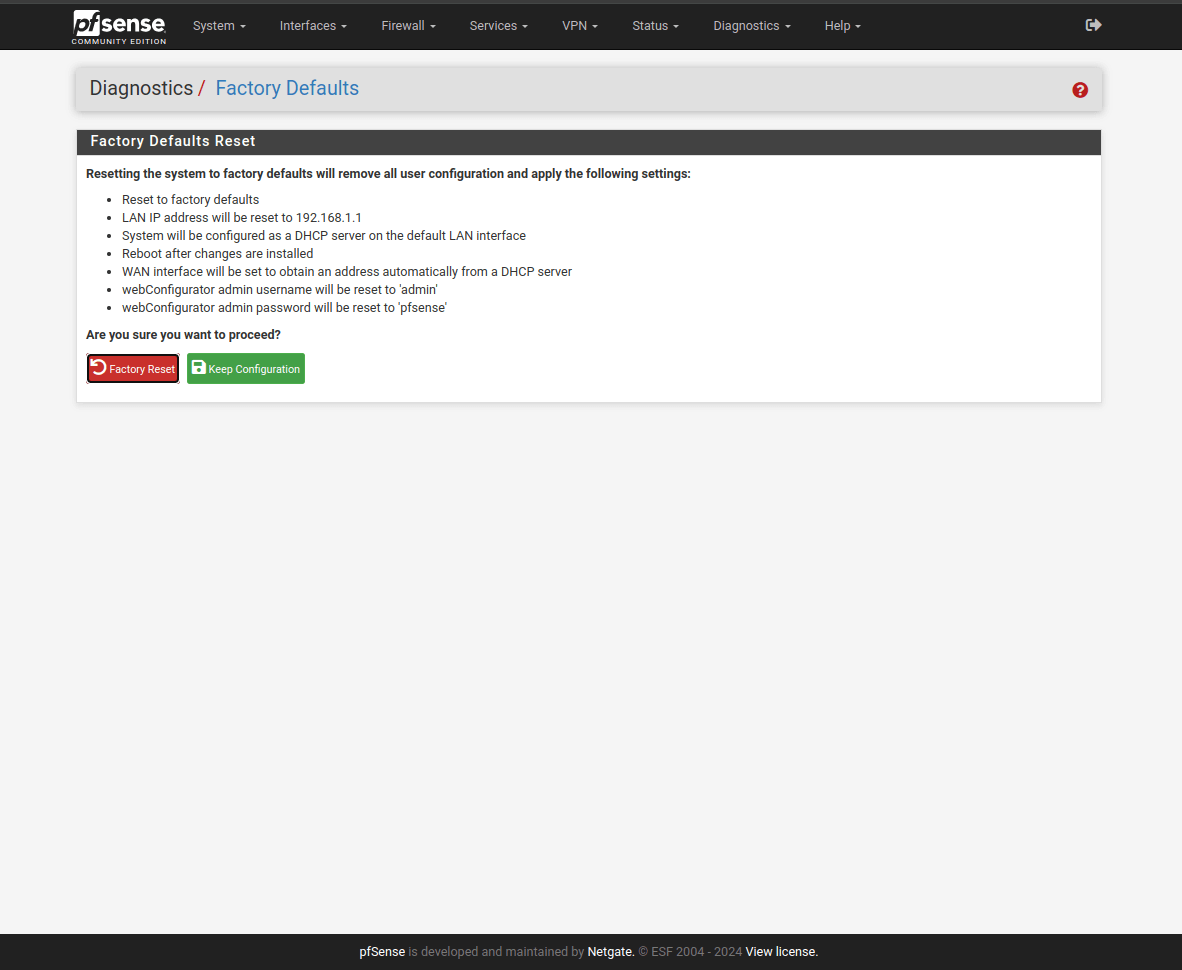
Figure 25. pfSense Diagnostics > Factory Defaults
You may reset factory defaults your pfSense via GUI by following the next steps:
- Navigate to the Diagnostics > Factory Defaults menu.
- Review the affected items (listed on the page).
- Click "Factory Reset" and confirm with "OK."
You may reset factory defaults your pfSense via Console by following the next steps:
- Access the console menu (local or SSH with admin privileges).
- Select the option for "Reset to factory defaults" (e.g., option 4).
- Confirm with "y" and press Enter to initiate the reset.
You may reset factory defaults your pfSense Hardware Button (Netgate Appliances Only) by following the next steps:
- Power on the unit.
- After the initial POST sequence, press and hold the reset button until system LEDs turn off or the system reboots.