Using Remote Elasticsearch for Zenarmor Reporting
Zenarmor provides IT administrators with the option of storing reporting data using either Elasticsearch or a MongoDB database depending on the organization`s firewall hardware resources. Elasticsearch is the leading scalable open-source enterprise search engine designed to operate in real-time in distributed environments. MongoDB is a scalable document database with flexible querying and indexing.
If the firewall has enough memory, 8GB or more RAM, and a modern i3 CPU or later, Zenarmor will select and install an Elasticsearch instance for its database back end. When the amount of memory is 2 to 4GB and the CPU is somewhat weaker, Zenarmor will automatically install a local MongoDB database on the target system. Both databases are all installed locally during the Zenarmor`s initial configuration wizard.
Starting with the Sensei 1.5 release, IT administrators can also completely offload the reporting database to a remote Elasticsearch instance, either in the cloud or as an on-premise custom Elasticsearch system. The following post will show how to configure Zenarmor with a remote Elasticsearch instance.
Remote Elasticsearch can be deployed in two ways:
- Completely offload reporting data to a remote database. This option does not require a local database to be installed with the firewall.
- Use a local database and simultaneously stream a copy of the reporting data to a remote server.
The first option lets users install Zenarmor even on inexpensive hardware devices with RAM at 1GB or less. Follow the steps below to configure options one and two.
Completely Offload Reporting to a Remote Elasticsearch Instance
Configuration steps for reporting to a Remote Elasticsearch Instance are given below:
- After Zenarmor fresh installation or a factory reset, all Zenarmor menus redirect to wizard. In the first Welcome screen, open Upgrade to Premium link from upper right corner then activate your premium license.
- Next then Hardware Check
- Select Use a Remote Elasticsearch Database
- Enter the Database URI information: (URI example http://elasticsearch_server_ip:9200 or https://elasticsearch_server_ip:9200).
- Enter the username and password.
- To configure Elasticsearch with a username and password see:
- To check connections and create indexes in the remote Elasticsearch instances click on
Install Database & Proceed - The Wizard will advance if everything is correct.
- Zenarmor will store the Report Data in the remote Elasticsearch instance with the configuration.
- No Report Data will be stored locally, all data will be stored in the remote Elasticsearch database.
- Note: Database URI still could be used even if Elasticsearch was configured without the username and password

Figure 1. Remote Elasticsearch configuration on Zenarmor
Stream Reporting Data to a Remote Elasticsearch Instance
Configuration steps to stream reporting data to a Remote Elasticsearch Instance are given below:
The following option requires SOHO or higher Zenarmor paid subscriptions.
- Go to:
Configuration>Reporting & Data>Stream Reporting Data to External Elasticsearch - Activate
Enabled. - The
Database URIinformation: (URI example http://elasticsearch_server_ip:9200 or https://elasticsearch_server_ip:9200). - To check the connection and create indexes in the remote Elasticsearch instance click on
Check External Database & Create Indexes - The Wizard will advance if everything is correct.
- Zenarmor will store the reporting data for both Local and Remote Databases with this configuration.
Database URI still could be filled up even if Elasticsearch was configured without the username and password.

Figure 2 Stream Reporting Data to a Remote Elasticsearch
Configuring Kibana to Visualize Zenarmor Reporting Data
- Prefix for index names comes with the Zenarmor Premium licenses.
- To reach the
Prefix>Zenarmor GUI>Configuration>About>Host Unique Identifier.
To be able to use 'Prefix' as Host Unique Identifier, you need to have SOHO or Business subscription plan.

Figure 3. Zenarmor configuration - about
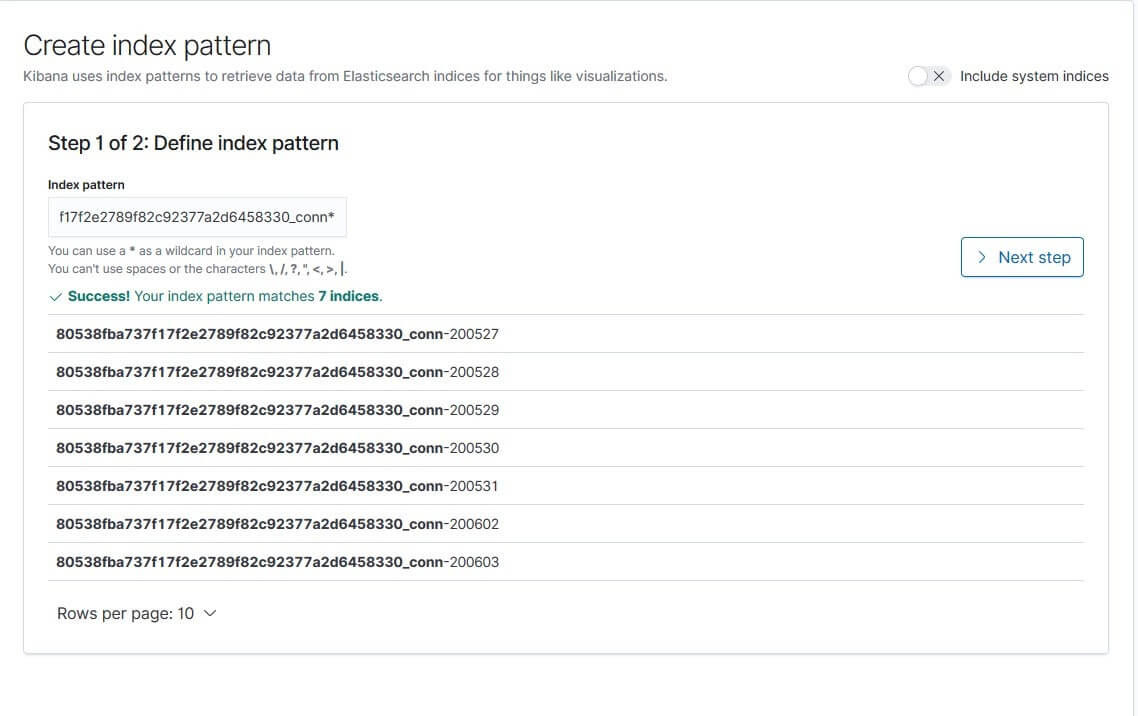
To use Zenarmor Reporting data in Kibana, Zenarmors prefix must be added to the Kibana index pattern: Open Kibana>Settings>Index Pattern`

Figure 4. Index pattern
- Click on
Create Index Patternand - Paste
Host Unique Identifier(To reach The prefix >Zenarmor GUI>Configuration>About>Host Unique Identifier).

Figure 5. Index pattern
- When you paste Host Unique Identifier, you will see an index list. Zenarmor creates 6 different indexes. They are:
[Prefix]_conn-date; For all TCP and UDP connections[Prefix]_sip-date; For all SIP connections[Prefix]_dns-date; For all DNS connections[Prefix]_http-date; For all Http connections[Prefix]_tls-date; For all https connections[Prefix]_alert-date; For all blocked connections
-
Add _**[conn,sip,dns,http,tls,alert]******* one of them end of the prefix to report continuously. Then click Next step.
- If you write or select a filename that you see in the list, it will report only related date.
-
Select
Start_Time> then click onCreate Index Pattern.

Figure 6. Kibana Visualizations
- To create Report Graphics, Open
Kibana>Visualizations

Figure 7. Visualizations
- Click on
Create New Visualizationand select any chart.

Figure 8. New Visualization
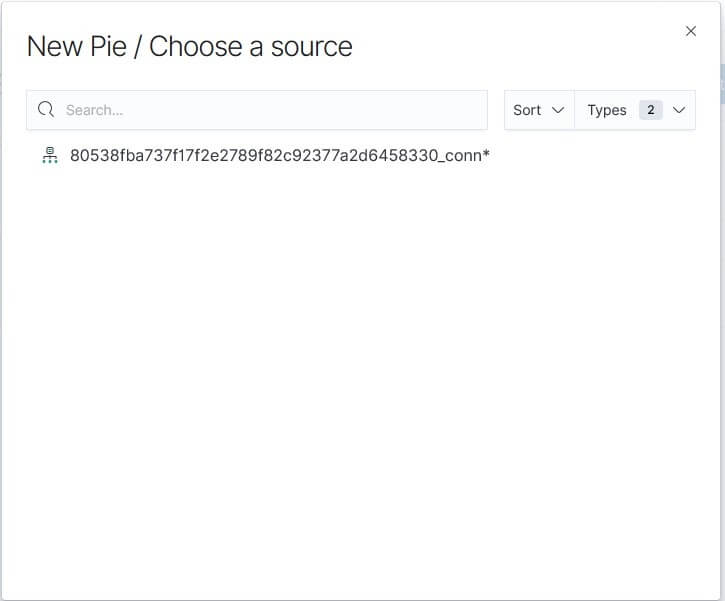
- Select Index File.

Figure 9. Source
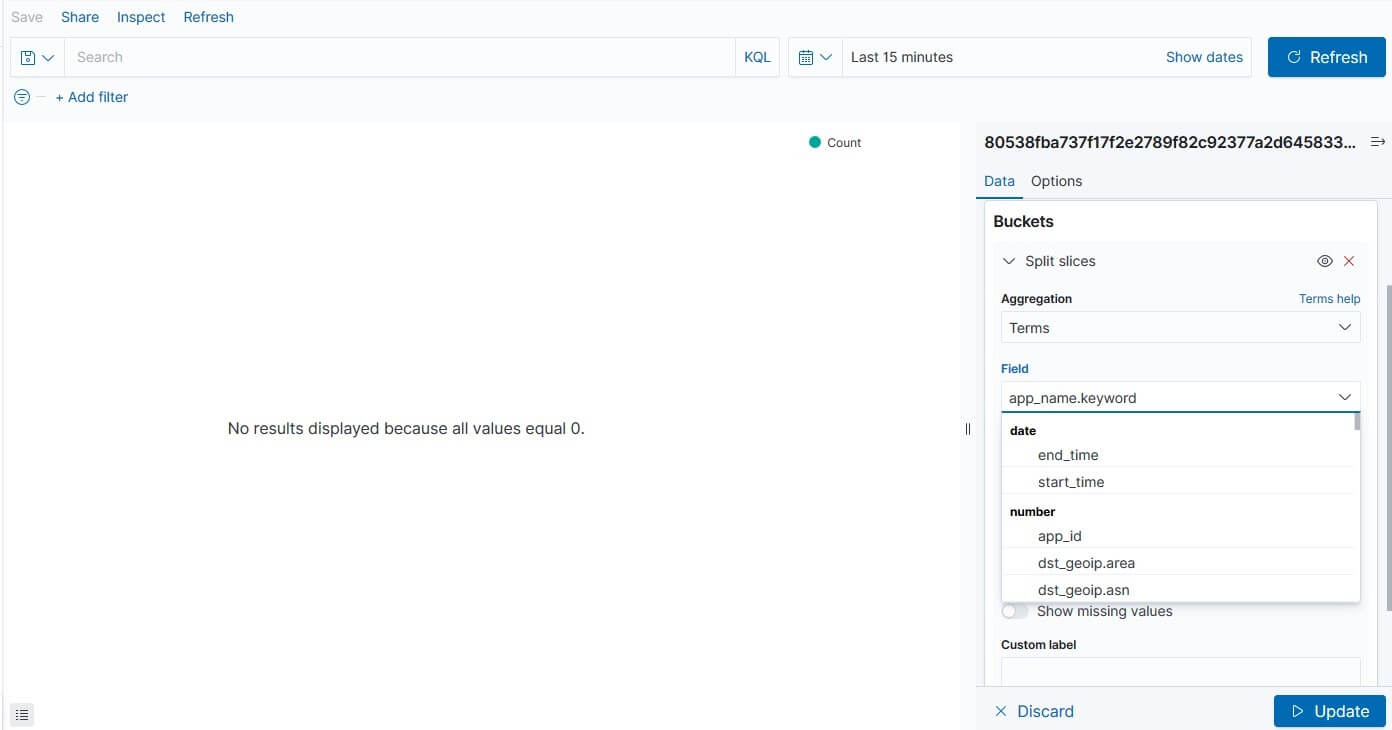
- To complete configuration, Select Terms from Aggregation select box and appropriate Field Name from the field Select box in the right Bucket section.

Figure 10. Bucket
- To update the chart, click on the
Updatebutton.

Figure 11. Pie Chart

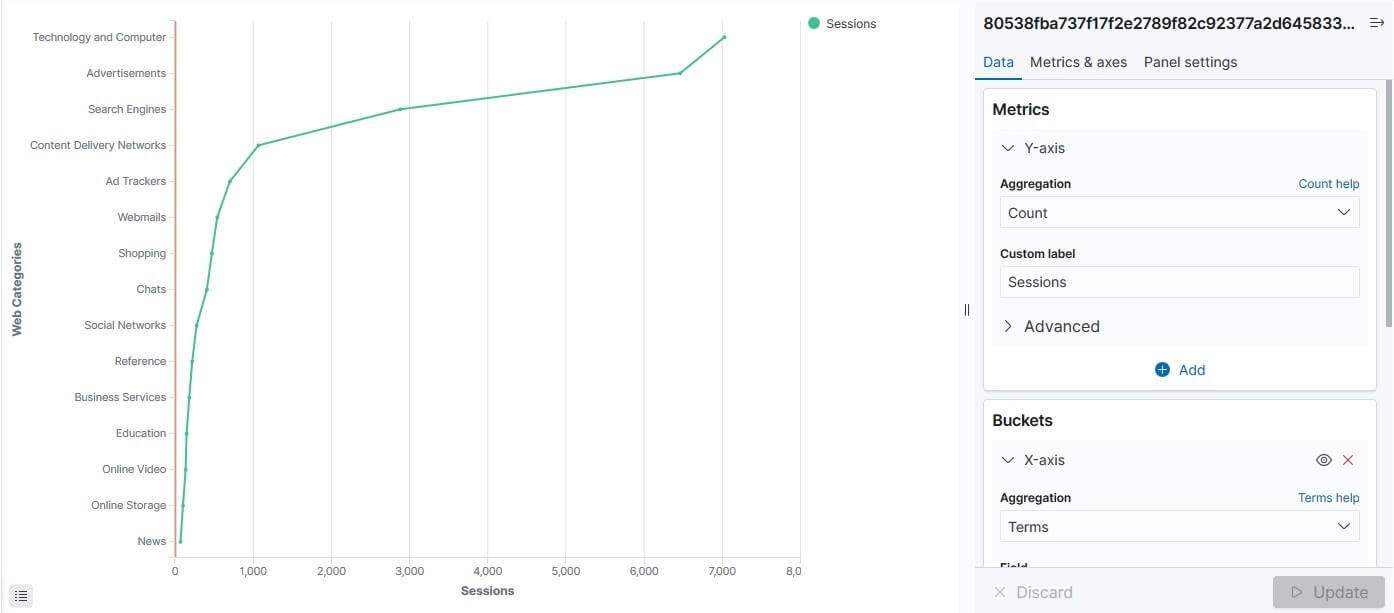
Figure 12. Web categories
- If you add more than one machine Reports, you can save reports with related machine names. They will also be added to the Visualize Dashboard.