Remote Elasticsearch Installation & Configuration on MS Windows for Zenarmor Reporting
Starting with the Sensei 1.5 release, IT administrators can also completely offload the reporting database to a remote Elasticsearch instance, either in the cloud or as an on-premise custom Elasticsearch system.
In order to use a remote Elasticsearch instance for Zenarmor Reporting, you must follow 3 main steps given below.
1. Microsoft Windows Firewall Configuration
2. Elasticsearch Installation and Configuration
3. Kibana Installation and Configuration
First of all, you have to be an administrator to install Elasticsearch Database on your Microsoft Windows Server/Desktop. Then, you can easily follow the instructions given below.
Microsoft Windows Firewall Configuration For Elasticsearch/Kibana
You must configure the firewall on your Windows server to allow traffic on the ports used by Elasticsearch and Kibana so that Zenarmor could write logs to the remote database.
The ports listed below should be opened for inbound communication on the Elasticsearch/Kibana server:
| Port | Protocol | Comment |
|---|---|---|
| 9200 | TCP | Elasticsearch HTTP REST endpoint (where Zenarmor sends its data) |
| 9300 | TCP | Elasticsearch cluster communication (not required if there is only one server) |
| 5601 | TCP | Kibana (web interface) |
You can configure the Windows firewall either using netsh on the command line or from GUI.
Firewall Settings on Command Line
1. To configure Windows Firewall, open a terminal window and then run netsh command with correct parameters, for instance:
c:\>netsh advfirewall firewall add rule name=ECS-Kibana-Inbound-9200-9300-5601 dir=in action=allow protocol=TCP localport=9200,9300,5601
This command will create a new firewall rule with the name ECS-Kibana-Inbound-9200-9300-5601 allowing inbound TCP traffic to the specified ports(9200, 9300, 5601).
Firewall Settings Using GUI
1. Go to Settings from Start Menu.
2. Then click on Network & Internet.
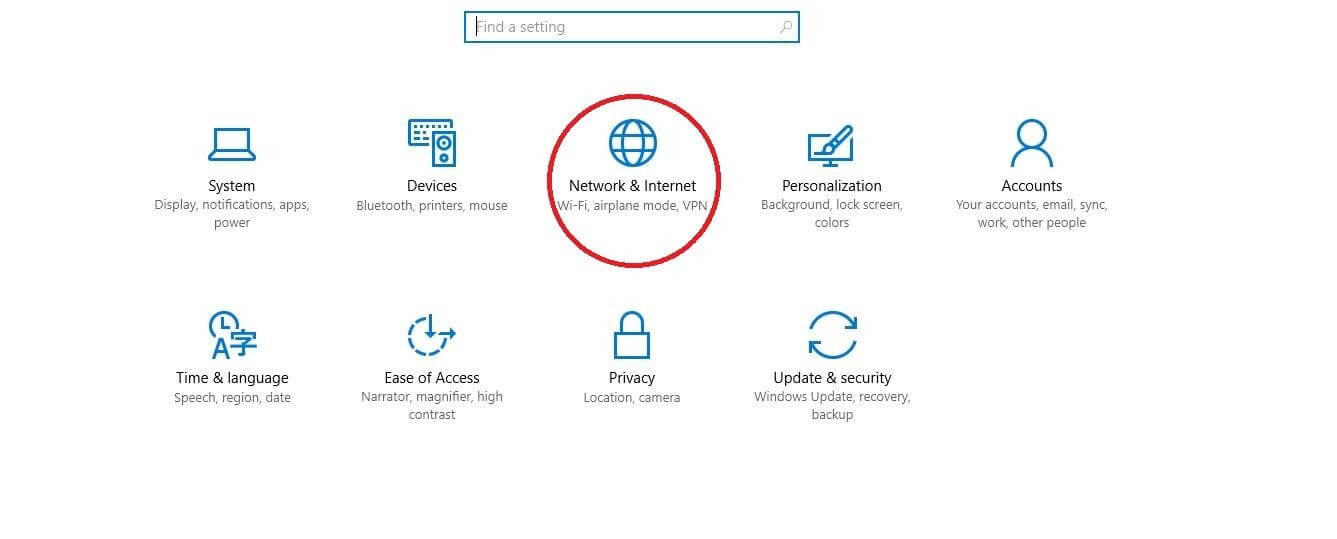 Figure 1. Network & Internet
3. Then click on Windows Firewall.

Figure 2. Windows Firewall
4. Click on Advanced Settings on the left sidebar.

Figure 3. Advanced Settings
5. Click on Inbound Rules in the Console Tree and then click on New Rule under Actions panel to open the New Inbound Rule Wizard.

Figure 4. Inbound Rules
6. Select the Port option and click on Next button.
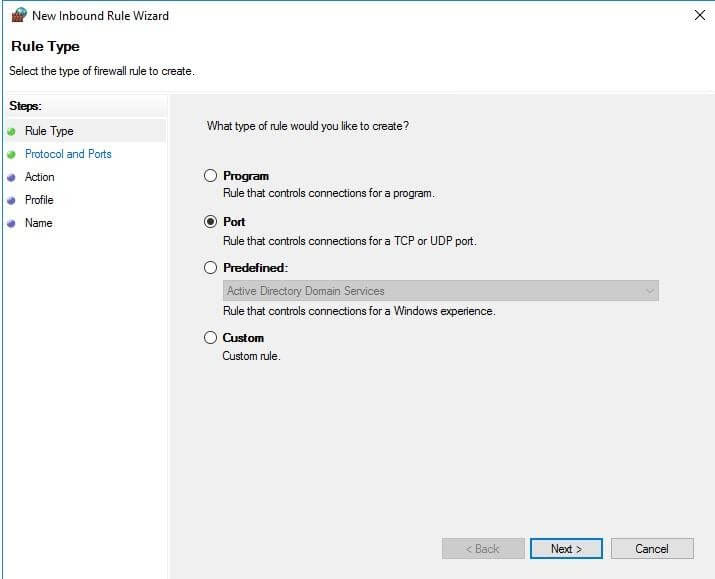
Figure 5. Inbound rule port
7. Select TCP and fill in the Specific Local Ports field with Elasticsearch and Kibana ports (9200, 9300, 5601), then click on Next.
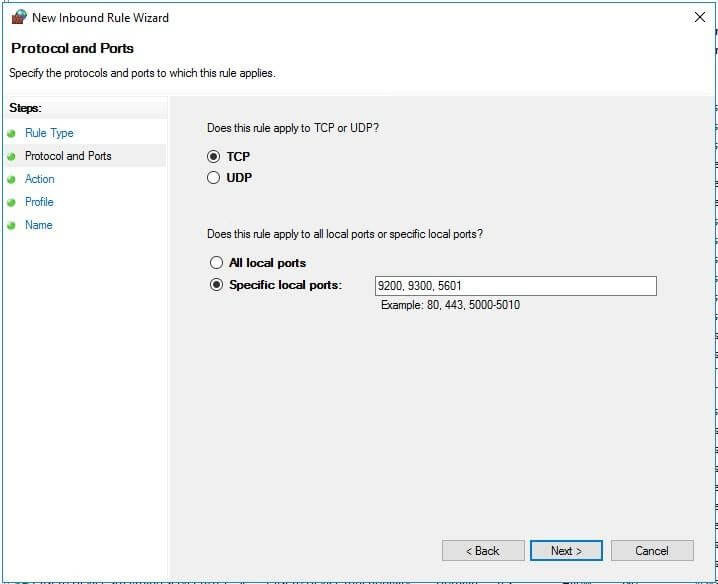
Figure 6. Specific Local Ports
8. Select Allow the connection option and click on Next.
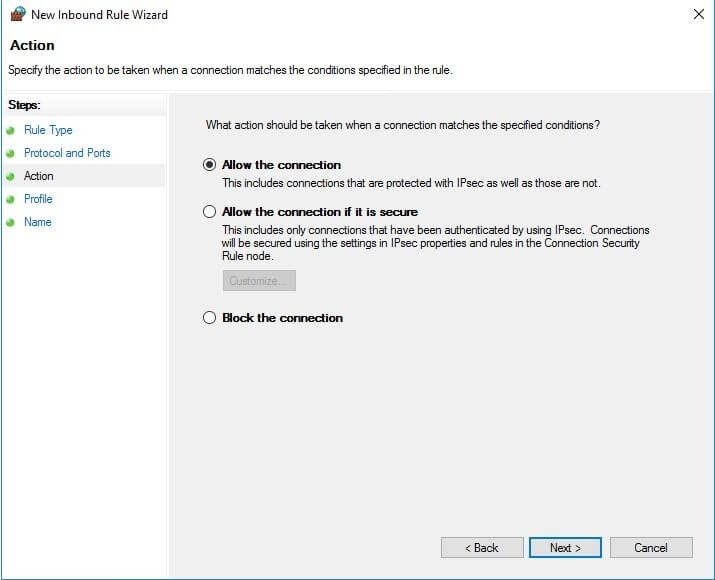
Figure 7. Allow the connection
9. Select Domain and Private Network.
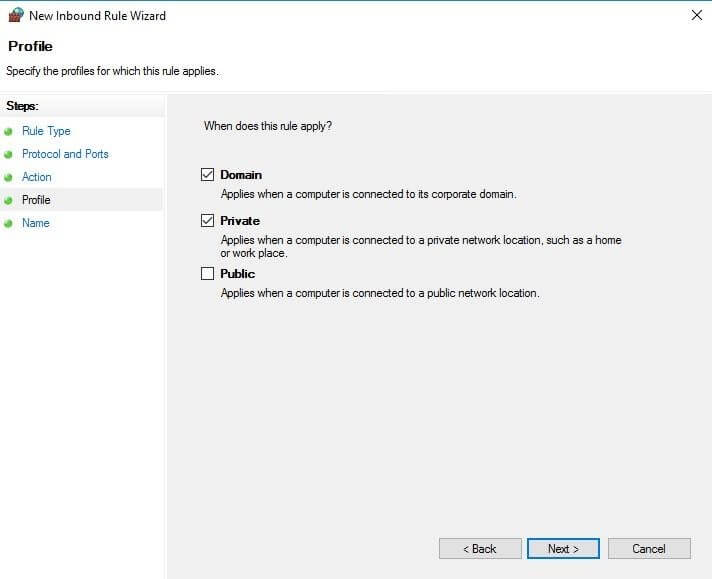
Figure 8. Private Network
10. Fill in the Name and Description fields for the new rule and then click Finish.
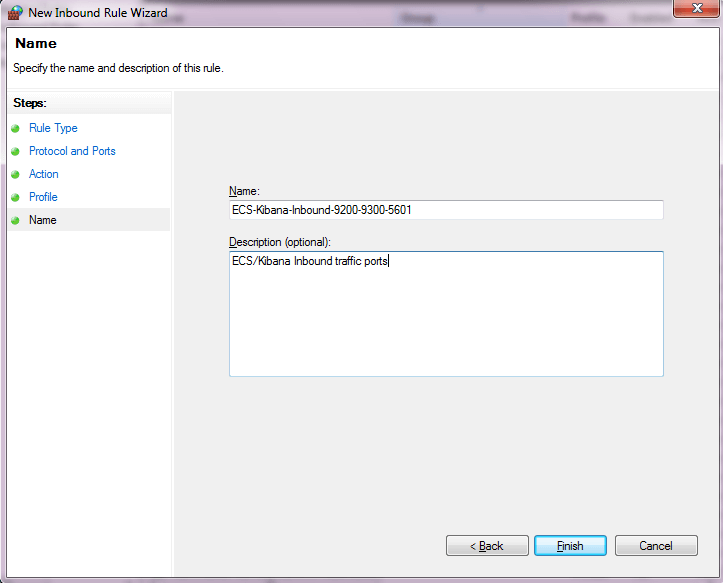
Figure 9. New inbound rule result description
Elasticsearch Installation & Configuration
Download and Install the .zip package
1. The latest stable version of Elasticsearch can be found on the Download Elasticsearch page. Download the .zip archive for the current Elasticsearch version by clicking on WINDOWS link on the download page.
 Figure 10. Download Elasticsearch
2. Unzip it with your favorite unzip tool. This will create a folder like elasticsearch-X.X.X (here it is elasticsearch-7.12.0), which we will refer to as %ES_HOME%.
Configuring Elasticsearch on the Command Line
Elasticsearch loads its configuration from the %ES_HOME%\config\elasticsearch.yml file by default.
1. Open %ES_HOME%\config\elasticsearch.yml configuration file with your favorite text editor such as WordPad.
2. Add the lines given below to the end of the elasticsearch.yml configuration file.
network host: 0.0.0.0
discovery.seed_hosts: ["127.0.0.1", "[::1]"]
For more information, please refer to official Elasticsearch Guide - Networking and Discovery Settings.
Installing Elasticsearch as a Service on Windows
To be able to run the Elasticsearch in the background and start automatically at boot time, it can be installed as a Microsoft Windows service. The %ES_HOME%\bin\elasticsearch-service.bat script is run to achieve this. Additionally, it allows system administrators to remove, manage or configure the service and potentially start and stop the service from the command line.
c:\elasticsearch-7.12.0\bin\elasticsearch-service.bat Usage: elasticsearch-service.bat install|remove|start|stop|manager [SERVICE_ID]
1. To install Elasticsearch, open a terminal window and then run %ES_HOME%\bin\elasticsearch-service.bat install command, for instance:
c:\elasticsearch-7.12.0\bin\elasticsearch-service.bat install The command line terminal will display output similar to the following:
Installing service : "elasticsearch-service-x64" Using ES_JAVA_HOME (64-bit): "c:\ elasticsearch-7.12.0\jdk" The service 'elasticsearch-service-x64' has been installed.
2. To enable starting Elasticsearch service automatically at startup, run %ES_HOME%\bin\elasticsearch-service.bat manager command:
c:\elasticsearch-7.12.0\bin\elasticsearch-service.bat manager It opens up the manager window.
3. In the manager GUI,
4. Select Startup Type as Automatic.
5. Click on the Start button to start the service.
6. Click on the Apply button to apply changes and then OK.

Figure 11. Startup Type Automatic
Setting Permissions For data Folder
To allow Zenarmor to write logs to Elasticsearch data directory, security settings of %ES_HOME%\data folder should be changed by giving Full Control for Everyone.
1. Using Windows Explorer go to %ES_HOME% directory and right click on the data folder.
2. Select the Permissions.
3. Select the Security tab. The list of groups and users that you see have permissions for this folder.
4. To add a new user (Everyone) click on Edit and then Add.
5. Click Advanced and then Find now.
6. Select Everyone to add to the permission list and click OK.
7. Select Allow check box for Full Control permission.
8. Click on Apply and then OK.

Figure 12. Setting Permissions
Checking Elasticsearch Status and Firewall Connection
1. You can test that your Elasticsearch node is running by sending an HTTP request to port 9200 from your firewall CLI:
curl -XGET http://Elasticsearch-SERVER-IP-ADDRESS:9200
This command should return a response something like this:

Figure 13. Checking Elasticsearch Status
Kibana Installation & Configuration
Download and Install the .zip package
1. The latest stable version of Kibana can be found on the Download Kibana page. Download the .zip archive for the current Kibana version by clicking on the WINDOWS link on the download page.
 Figure 14. Download Kibana
2. Unzip it to the same parent folder with Elasticsearch using your favorite unzip tool. This will create a folder like kibana-X.X.X-windows-x86_64 (here it is kibana-7.12.0-windows-x86_64), which we will refer to as %KB_HOME%.
Configuring Kibana
Kibana loads its configuration from the %KB_HOME%\config\kibana.yml file by default.
-
Open %KB_HOME%\config\kibana.yml configuration file with your favorite text editor such as WordPad.
-
Add the lines given below to the end of the kibana.yml configuration file.
server host: “192.168.0.36” (Kibana Server LAN IP should be written) elasticsearch.hosts: ["http://localhost:9200"]
Running Kibana at Startup on Windows
1. Using the Windows Key+ R to open run and type taskschd.msc. This will open Task Scheduler.
2. Click on Create Task under the Actions Panel.
3. The Create Task screen will appear. Select the “General” tab. In the “Name” field, give the task a name such as “Kibana”. Under the Security options, select “Run whether user is logged on or not”.
 Figure 15. Run whether user is logged on or not
4. Click on Triggers Tab and then “New..” button to create a new trigger.
5. Select “At Startup” in Begin the task drop-down menu and click OK.
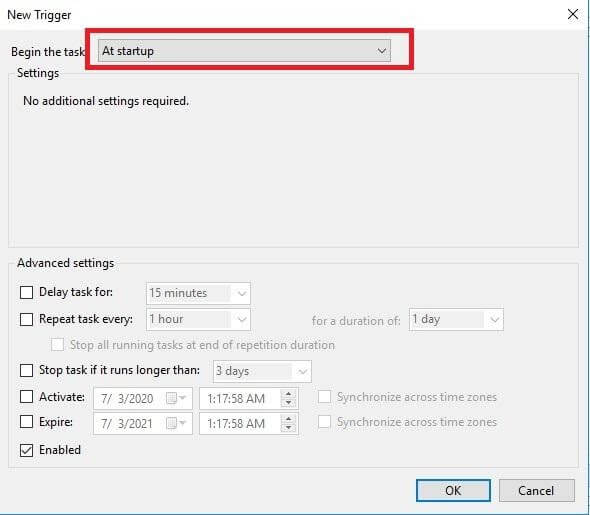
Figure 16. At Startup
6. Click on Actions Tab and then New button to create a new action.
7. Click on “Browse…” next to the “Program/script” field and select %KB_HOME%\bin\kibana.bat then click OK.
8. Then click OK to the Create Task window too. Fill in the username and password fields and click OK.
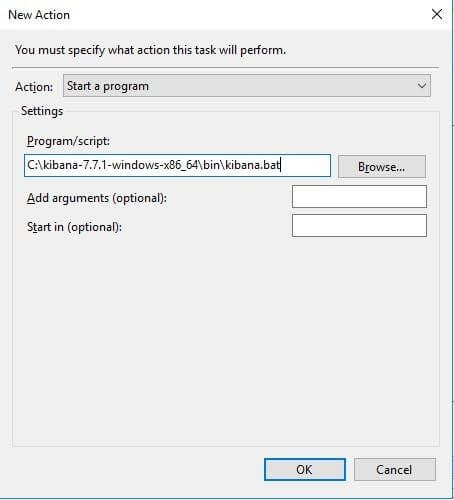
Figure 17. Create Task
9. In the Task Scheduler Window, Click on the Task Scheduler Library.
10. Select the task (Kibana) you created and Click Run under the Selected Item menu in Actions Panel on the right-hand side. Kibana runs at startup from now on.
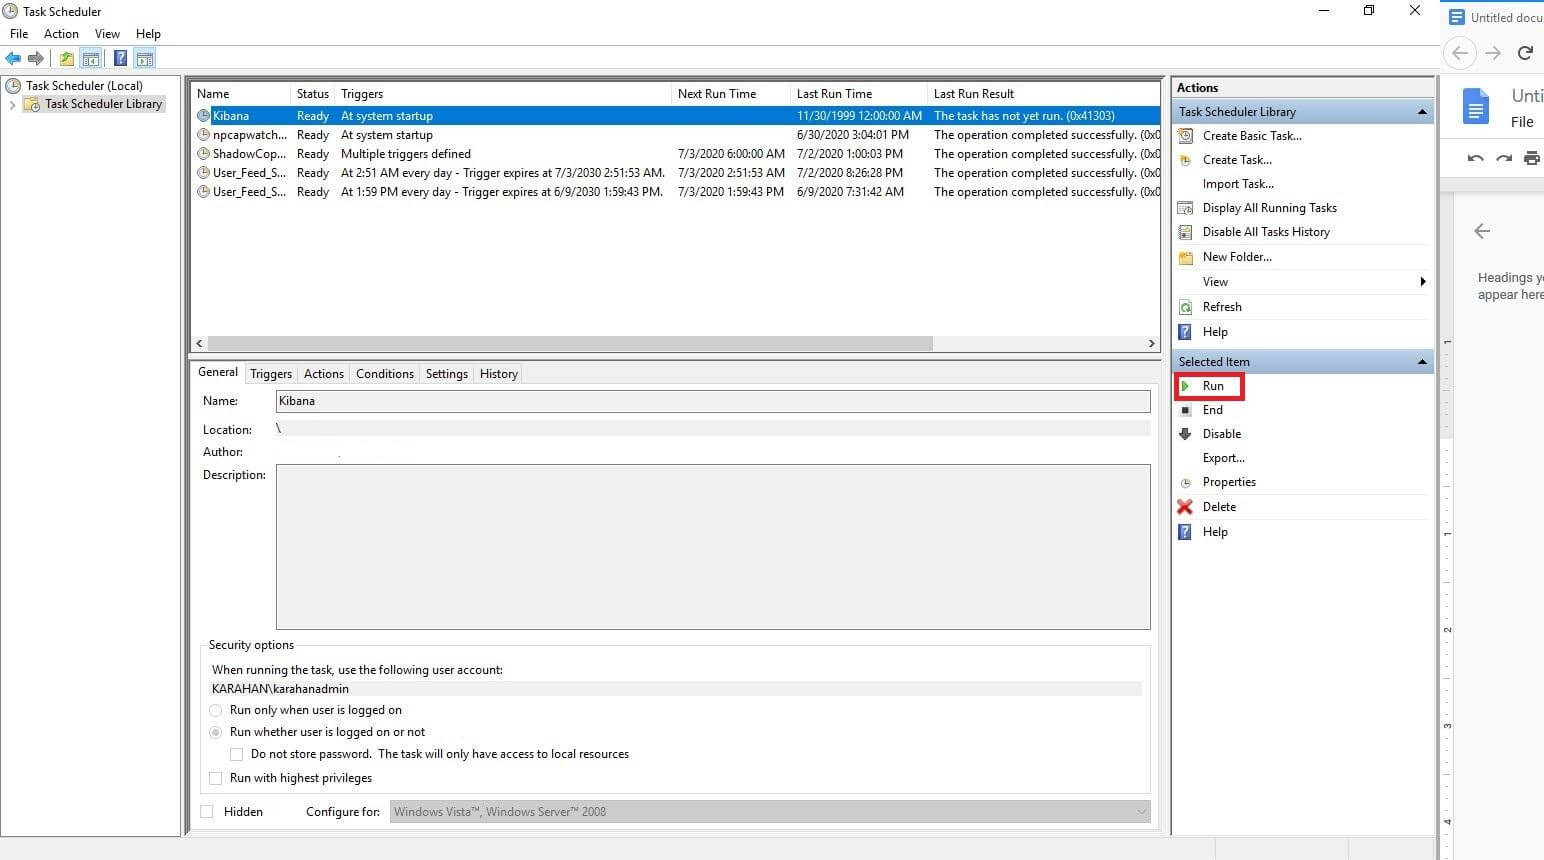 ** Figure 18.** Task Scheduler for Kibana
Setting Permissions For data Folder
Security settings of %KB_HOME%\data folder should be changed by giving Full Control for Everyone.
1. Using Windows Explorer go to %KB_HOME% directory and right click on the data folder.
2. Select the Permissions.
3. Select the Security tab. The list of groups and users that you see have permissions for this folder.
4. To add a new user (Everyone) click on Edit and then Add.
5. Click Advanced and then Find now.
6. Select Everyone to add to the permission list and click OK.
7. Select Allow check box for Full Control permission.
8. Click on Apply and then OK

Figure 19. Permission for data
To access Kibana GUI open the address: http://Kibana-IP_Address:5601
To manage indexes and see Zenarmor reports in Kibana please visit: