Gateway Reports
The Gateway Reports toolbar provides several controls that allow administrators to customize report views, analyze traffic, and investigate network activity observed by a specific gateway.
Unlike Centralized Reports, which aggregate reporting data from all managed gateways and endpoints, Gateway Reports focuses exclusively on traffic processed by the selected gateway.
As a result, all charts, statistics, and report data reflect only the activity observed by that gateway. This makes Gateway Reports particularly useful for troubleshooting, validating deployments, investigating gateway-specific events, and analyzing local network activity.

Figure 1. Gateway Reports Toolbar
Understanding the Report Toolbar
The report toolbar includes the following controls:
- Filter
- Reporting Metric
- Time Range
- Refresh Interval
- Record Size
- Bookmarks
- Settings
- Refresh
- Download
The following sections describe each control in detail.
Reporting Metric
The Reporting Metric selector determines which metric is used to visualize report data across the current report view.
Available metrics include:
- Sessions – Number of connections or transactions.
- Packets – Number of transmitted packets.
- Volume – Number of transferred bytes.
To change the reporting metric, follow the steps below.
- Click the Reporting Metric drop-down menu.
- Select the desired metric.
The selected metric is automatically applied to all charts within the current report view.

Figure 2. Reporting Metric
Time Range
The Time Range selector allows you to specify the reporting period.
Available options include:
- Last 30 Minutes
- Last 6 Hours
- Last 12 Hours
- Last 24 Hours
- Last 72 Hours
- Last Week
- Custom Range
To change the reporting period, follow the steps below.
- Click the Time Range selector.
- Select the desired period.
The selected time range is automatically applied to all charts and widgets within the current report view.

Figure 3. Time Range
Refresh Interval
The Refresh Interval determines how often report data is automatically updated.
Available intervals include:
- Pause
- 1 Minute
- 5 Minutes
- 15 Minutes
- 30 Minutes
- 1 Hour
To change the refresh interval, follow the steps below.
- Click the Refresh Interval selector.
- Select the desired interval.
Report data will automatically refresh according to the selected interval.
You can also refresh report data immediately by clicking Refresh.

Figure 4. Configuring the Refresh Interval*
Record Size
The Record Size selector determines how many records are displayed across supported charts and tables.
Available options include:
- Top 5
- Top 10
- Top 25
- Top 50
- Top 100
The default value is Top 10.
To change the record size:
- Click the Record Size selector.
- Select the desired value.
The selected value is automatically applied to all supported charts in the current report.

Figure 5. Record Size
Filtering Reports
Filters allow administrators to narrow report data and focus on specific users, devices, applications, hosts, policies, or other network attributes without modifying the underlying report data.
Applied filters can also be saved as reusable filter presets for future investigations.
You can apply a filter to your report view in two ways.
- Selecting the Filter option from the configuration bar at the top of the Reports page.
- Selecting a chart pane and clicking the Filter or Exclude button.
The following sections explain both filtering methods in detail.
Filtering on Configuration Bar
To apply a filter to the report view, you may follow the next instructions:
-
Click on the Filter button on the configuration bar at the top of the 'Reports' page. This will pop up a dialog box. You may enable the following options provided by Zenarmor:
- Private Access Connections: This settings provides 3 options. By default all connections including secure private networks connections and Internet connections are displayed.
- Show All Connections
- Show Only Private Access Connections
- Hide Private Access Connections
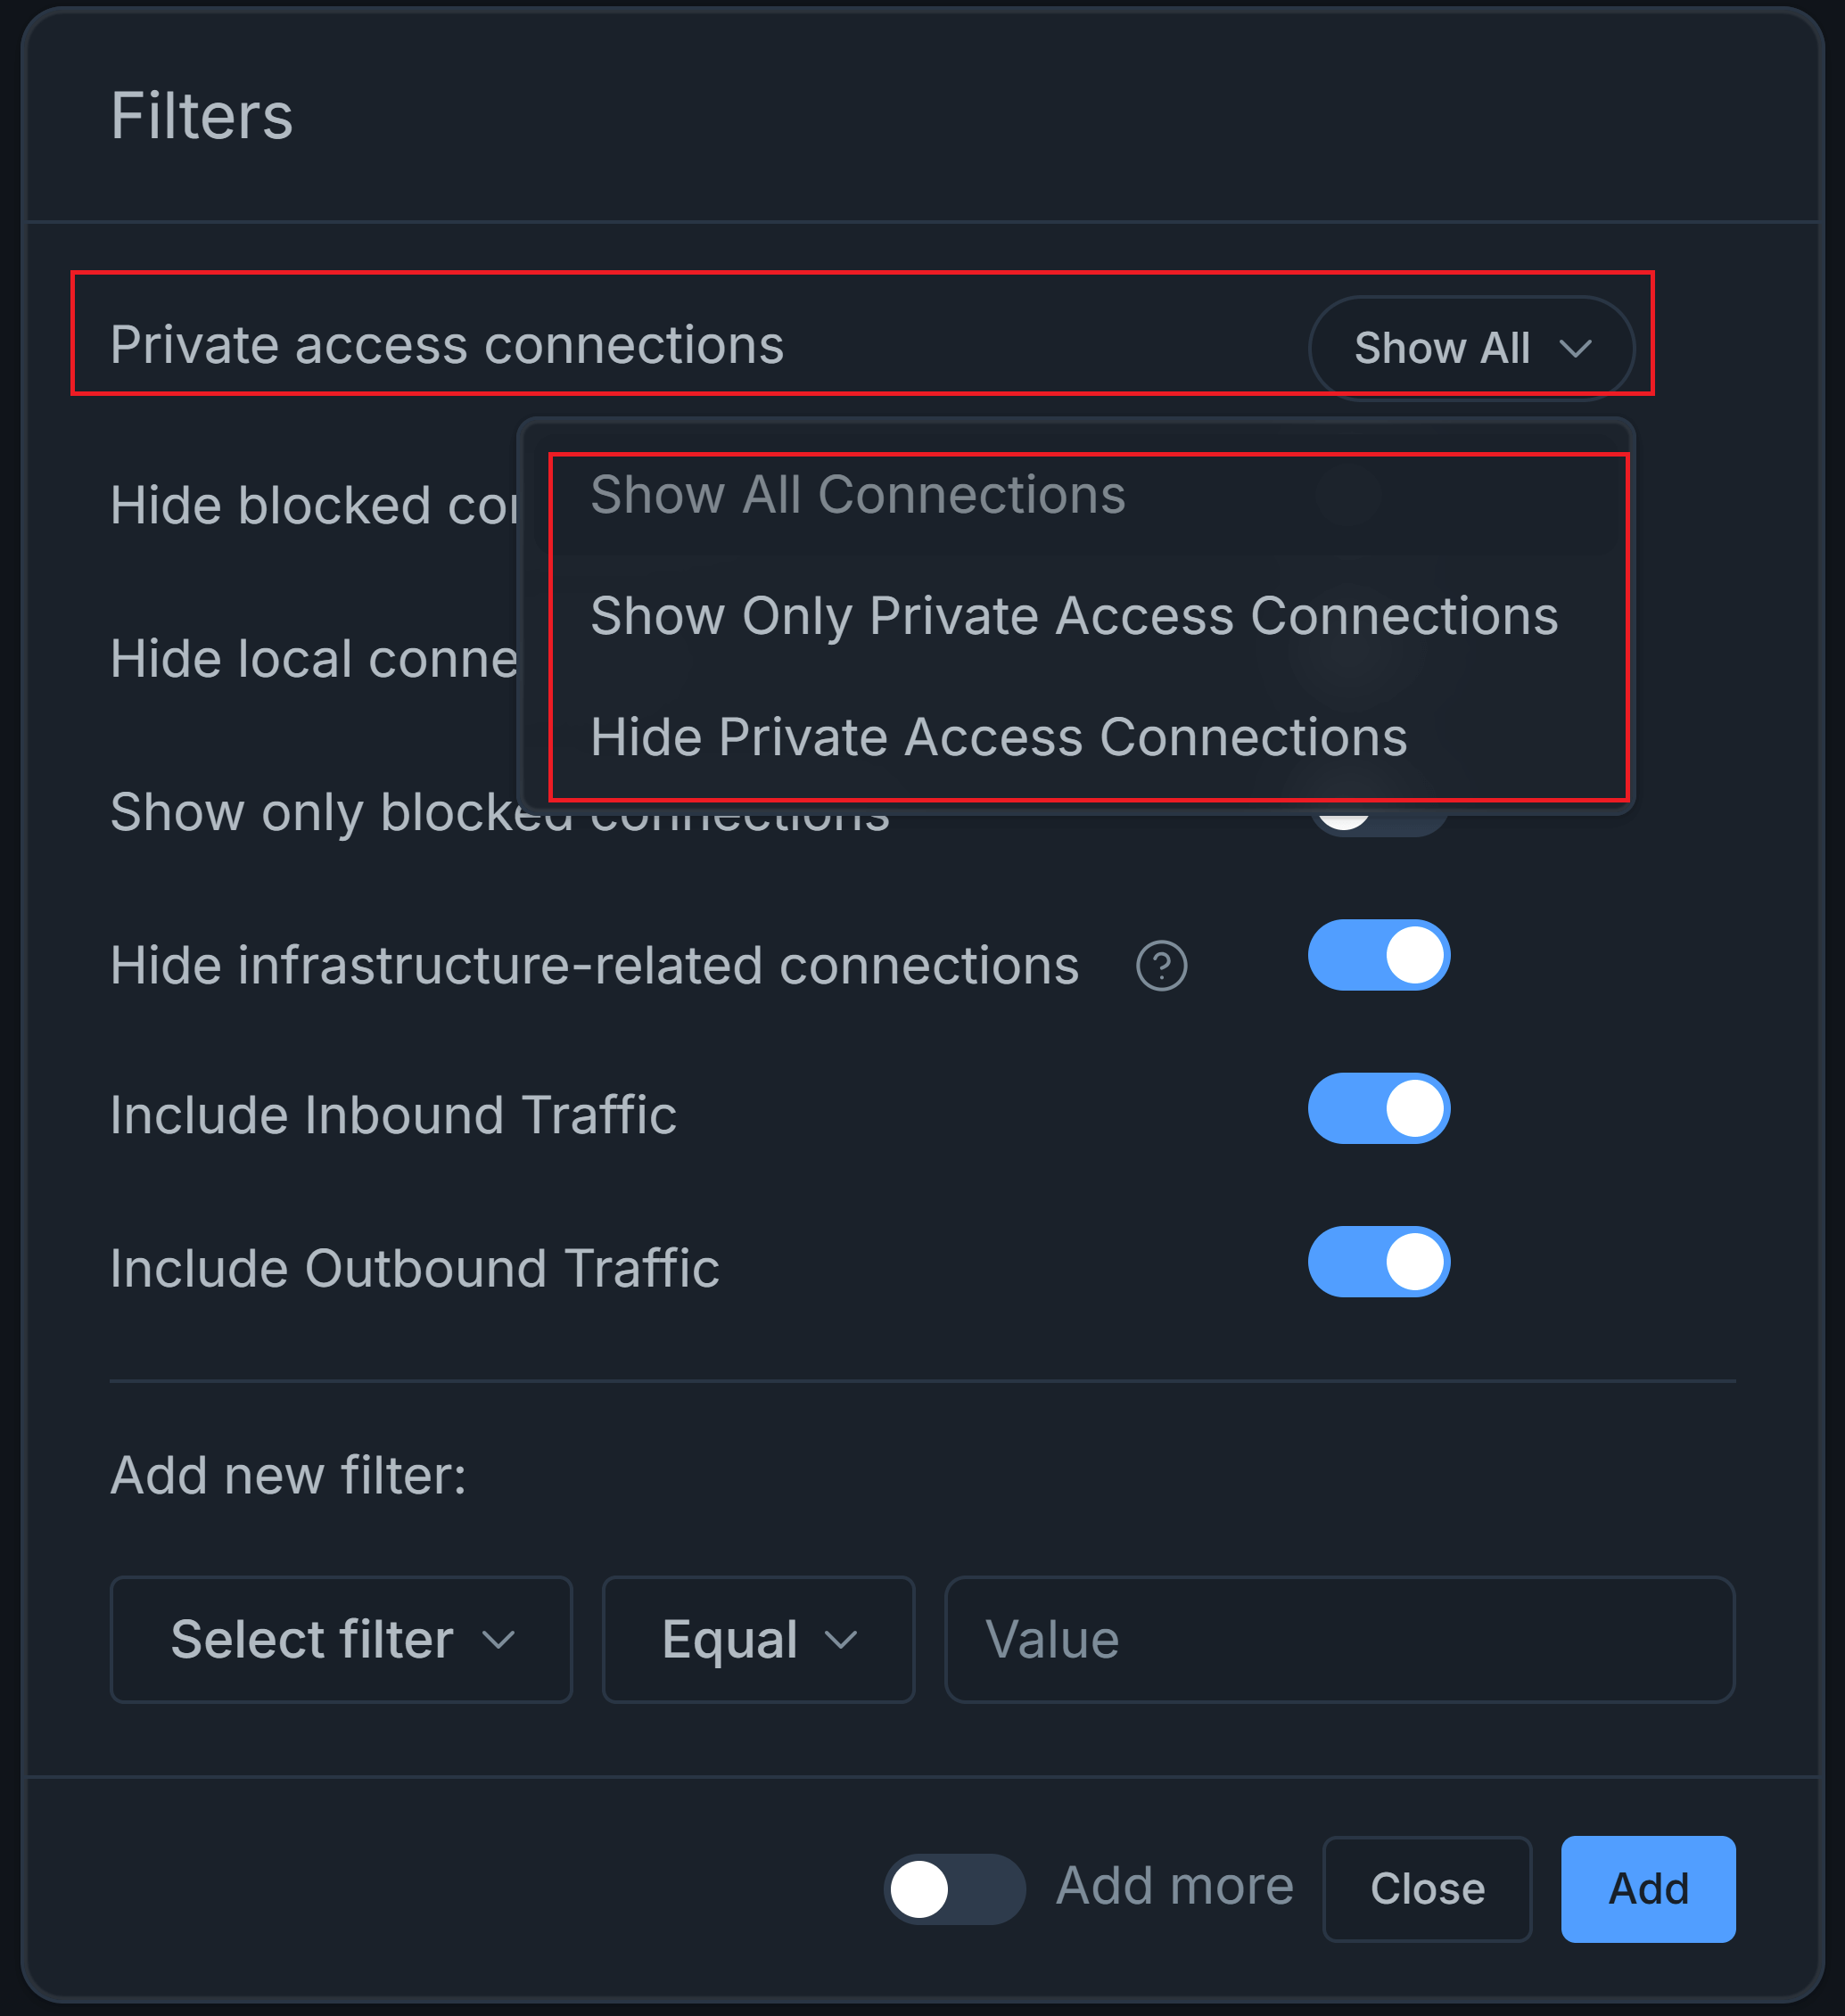
Figure 6. Filtering Private Access Connections
- Hide Blocked Connections: When you enable this option, blocked sessions are not displayed in the reports.
- Hide Local Connections: When you enable this option, internal sessions on your LAN are not displayed in the reports.
- Show Only Blocked Connections: When you enable this option, only blocked connections are displayed in the reports.
- Hide Infrastructure-related Connections: When you enable this option, infrastructure-related connections are not displayed in the reports.
- Include Inbound Traffic: Users can apply a filter for both traffic flow directions in reports, ensuring more precise traffic analysis and management. When you enable this option, inbound connections are displayed in the reports.
- Include Outbound Traffic: When you enable this option, outbound connections are displayed in the reports.
-
You may add new filter by selecting the reporting metric (such as Destination IP) in the first dropdown menu.
-
Select the operator in the second dropdown menu. There are 4 operator options available:
- Equals
- NotEquals
- Contains
- Does not Contain
-
Set a value that you want to be filtered for the report.
-
You may click Add more toggle bar if you want to add multiple filters.
-
Click Add button to activate filtering settings.
-
You may click Close after adding all filters to close the window.
The filter is automatically applied to the charts.

Figure 7. Applying Filter
After adding filters, a Reset All Filters button will be displayed at top right of the Reports page.
By clicking on the Reset All Filters button, you may clear all defined report filtering settings.
Saving or Resetting Filters
After one or more filters have been applied, additional filter management controls become available on the report toolbar.
These controls include:
- Save Current Filters
- Reset All Filters
Save Current Filters saves the current filter configuration as a reusable preset.
Reset All Filters removes every active filter from the report while preserving previously saved filter presets.

Figure 8. Filter Management Controls
Filtering from Charts
Charts also provide a quick way to filter report data without opening the Filter dialog.
To apply a filter to the report view, you may also follow the steps given below:
-
Select one of the chart panes. For example, if you're on
Connectionstab, you can tryApp Categories Breakdown. -
You may hover your mouse over the filtering type on the right sight of the chart pane. This will display Filter, Exclude and drop-down menu with
...icon buttons. For example, hover your mouse overSecure Web Browsing. Clicking on...icon will open a drop-down menu including Filter, Exclude and Live Sessions options.
Figure 9. Adding Filter on Chart
-
Or, you may click on the chart pie that you want to apply a filter. This will open a drop-down menu including Filter, Exclude and Live Sessions options.

Figure 10. Adding Filter via Chart Pie
-
Click either Filter or Exclude button. This will apply your filter to the current report page. For example, click Filter button.

Figure 11. Connections filtered out for Application Category = Secure Web Browsing
You can apply more than one filter to the report view and see the filtering/exclude parameters on the top of the reporting page.
Bookmarks (Saved Filters)
The Bookmarks button provides access to previously saved filter presets.
Saved filters allow administrators to quickly reuse commonly used filtering configurations without recreating them manually.
Viewing Saved Filters
You may easily view your saved filter by clicking on Saved Filters button located in the report configuration bar. This will display a window listing all saved filters.

Figure 12. Bookmarks (Saved Filters)

Figure 13. Bookmarks (Saved Filters) List View
Applying Saved Filters
You may apply previously saved filters to your reports by following these steps.
- Click on Saved Filters button located in the report configuration bar. This will display a window listing all saved filters.
- Select the filters that you want to apply.
- Click Apply button. This will automatically apply the saved filter to reports.
Updating Saved Filters
You may update previously saved filters by following these steps.
- Apply some filters to reports depending on your needs.
- Click on Saved Filters button located in the report configuration bar. This will display a window listing all saved filters.
- Select the filters that you want to apply.
- Click Update button. This will display a message box for confirmation.
- Click Update button to update the preset filter with the current applied filters.
Deleting Saved Filters
You may easily delete your saved filters by following these steps.
- Click on Saved Filters button located in the report configuration bar. This will display a window listing all saved filters.
- Select the filters that you want to remove.
- Click Remove From Saved Filters button. This will display a message box for confirmation.
- Click Remove button to delete the saved filter.
Settings
The Settings menu provides display preferences for report timestamps.
From this menu, administrators can:
- Switch between 12-hour and 24-hour time formats.
- View the time zone currently used for report timestamps.
The menu displays the available time format option. For example, if reports are currently displayed using the 12-hour format, the menu provides the option to switch to the 24-hour format, and vice versa.
To change the time format:
- Click the Settings icon on the report toolbar.
- Select the available time format option.
The selected format is immediately applied to timestamps throughout the current report view.
The current report time zone is also displayed in the Settings menu for reference.

Figure 14. Report Settings
Refreshing Reports
To retrieve the latest report data, click Refresh on the report toolbar.
This refreshes every chart and widget while preserving the currently selected reporting options.

Figure 15 Refreshing Reports
Exporting Reports
Reports can be exported for offline analysis, reporting, or sharing.
To export report data:
- Click Download.
- Select the desired export format.
- Download the generated report.
Available export formats and capabilities may vary depending on your deployment and subscription.

Figure 16. Exporting Zenarmor Reports
Export Report Feature is not available for Free Edition. To benefit from the custom report feature, you must have one of the paid Zenarmor subscriptions. For more information about plans & pricing.
Kindly note that the generation of "PDF-based" scheduled reports is facilitated through an API hosted on the Zenarmor Datacenter. However, it should be noted that no data processed by this API, which primarily functions to generate PDF files, is stored on our end.
Working with Interactive Charts
Charts throughout Gateway Reports are interactive and provide contextual actions that help administrators investigate report data without leaving the current report view.
In addition to visualizing report data, charts allow administrators to filter or exclude specific items, view related live sessions, customize chart settings, and perform chart-specific actions independently of the global gateway report controls.
Accessing Chart Actions
Most chart actions are available by hovering over a chart legend entry or selecting a chart item.
Depending on the selected chart, the More Actions (⋯) menu may include:
-
Filter – Displays only the selected data in the current report.
-
Exclude – Removes the selected data from the current report.
-
Live Sessions – Opens the Live Sessions page filtered for the selected item.

Figure 17. Chart Context Menu
Viewing Live Sessions
For supported charts, you can investigate the active network sessions associated with a selected chart item.
To open the related live sessions:
- Hover over a chart legend entry or select a chart item.
- Click the More Actions (⋯) button.
- Select Live Sessions.
The Live Sessions page opens with the selected chart item automatically applied as a filter, allowing you to investigate current network activity in greater detail.

Figure 18. Opening Live Sessions
Changing the Reporting Metric for a Chart
Some charts allow the reporting metric to be configured independently from the global report setting.
To change the reporting metric for an individual chart:
- Hover over the chart header.
- Select the desired reporting metric (Session, Packet, or Volume).
Only the selected chart is updated. The reporting metric configured on the report toolbar remains unchanged.

Figure 19. Changing the Chart Reporting Metric
Changing the Chart Record Size
Some charts allow the number of displayed items to be configured independently from the global report setting.
To change the chart record size:
- Hover over the chart header.
- Select the desired value from the Top drop-down menu.
Only the selected chart is updated.
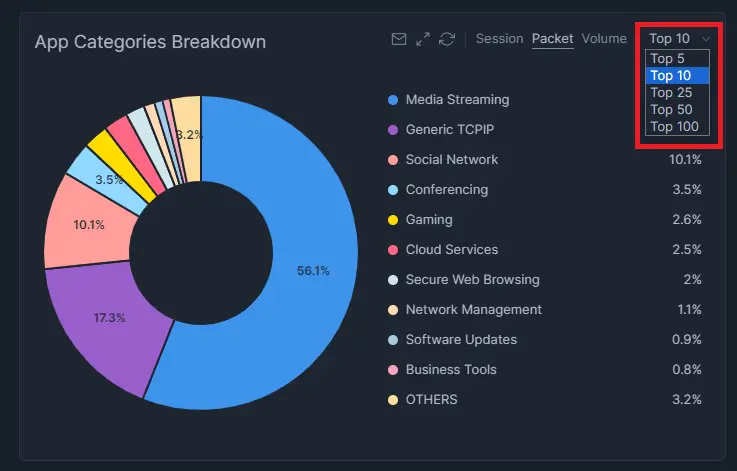
Figure 20. Selecting Chart Size
Refreshing a Chart
Individual charts can be refreshed independently without reloading the entire report view.
To refresh a chart:
- Hover over the chart header.
- Click the Refresh icon.
The selected chart is refreshed using the latest available data while preserving the current report configuration.
Resizing Charts
Charts can be expanded to provide additional workspace during investigations.
To resize a chart:
- Hover over the chart header.
- Click the Resize icon.
- Click the icon again to restore the default size.
Only the selected chart is affected.

Figure 21. Resizing the Chart Window
Adding Charts to Scheduled Reports
If Scheduled Reports are configured, individual charts can be added directly to scheduled reports.
To add a chart:
- Hover over the chart.
- Click the Add to Scheduled Reports icon.
The selected chart will be included the next time the scheduled report is generated.

Figure 22 Adding a Chart to a Scheduled Report