Zenarmor Reports Overview for OPNsense
Reports module is the place where you see what is happening on your network, which rules are hitting, and more in real-time.
All reports have their charts set up. You'll be provided with the charts relevant to the report you're on.

Figure 1. Zenarmor Reports
Start with the big picture, drill down to details
Zenarmor®'s rich reporting allows you both to see the overall network activity in a birds-eye view and if you want to inspect it in detail, you can select any chart item and drill down to details. You can drill down as many levels as you like.
At any time, you can click on the Sessions Explorer to see per-connection details for the current reporting level.
For instance, if you selected Drill-down for the Streaming application category and then you drilled down to the "192.168.1.1" IP address, all reports will be displaying information regarding the Streaming activity of 192.168.1.1 IP Address.
When you launch the Sessions Explorer, the displayed records will have the same drill-down filter, so you'll only see the sessions belonging to the 192.168.1.1 IP address doing Streaming.
Reporting criteria
To customize your reports, you can select the reporting criteria on the top right-hand side.
Reporting Metric
You can select the metrics used to create the reports. Do you want to see how many sessions are created, how many packets are transmitted, or maybe the number of bytes transferred? You can select which information you want to see here. They can be either one of these:
-
Sessions: Number of connections/transactions
-
Packets: Number of packets
-
Volume: Number of bytes
Reporting Time Interval
You can define a time interval. The time interval can be:
-
Last 30 minutes
-
Last 6 hours
-
Last 12 hours
-
Last 24 hours
-
Last 72 hours
-
Last week
-
Custom range
Refresh Time
This is the auto-refresh interval for the reports to automatically refresh with new data.
This is the auto-refresh interval for the reports to automatically refresh with new data. The interval options are as follows:
- Pause
- 1 minute
- 5 minutes
- 15 minutes
- 30 minutes
- 1 hour
To refresh the reporting page immediately you may click on the Refresh button at the top right corner of the screen.
Record Size
You may specify record size of the reports by selecting available options in the Record Size drop-down menu at the top of the page:
- Top 5
- Top 10
- Top 25
- Top 50
- Top 100
How to Use Generic Filter
Zenarmor includes a filtering option that is extremely useful for inspecting network activity. You can apply a filter to your report view in two ways.
- Selecting the Filter option from the configuration bar at the top of the Reports page.
- Selecting a chart pane and clicking the Filter or Exclude button.
Filtering on Configuration Bar
To apply a filter to the report view, you may follow the next instructions:
-
Click on the Filter button on the configuration bar at the top of the 'Reports' page. This will pop up a dialog box. You may enable the following options provided by Zenarmor.
-
Private Access Connections: This settings provides 3 options. By default all connections including secure private networks connections and Internet connections are displayed.
- Show All Connections
- Show Only Private Access Connections
- Hide Private Access Connections
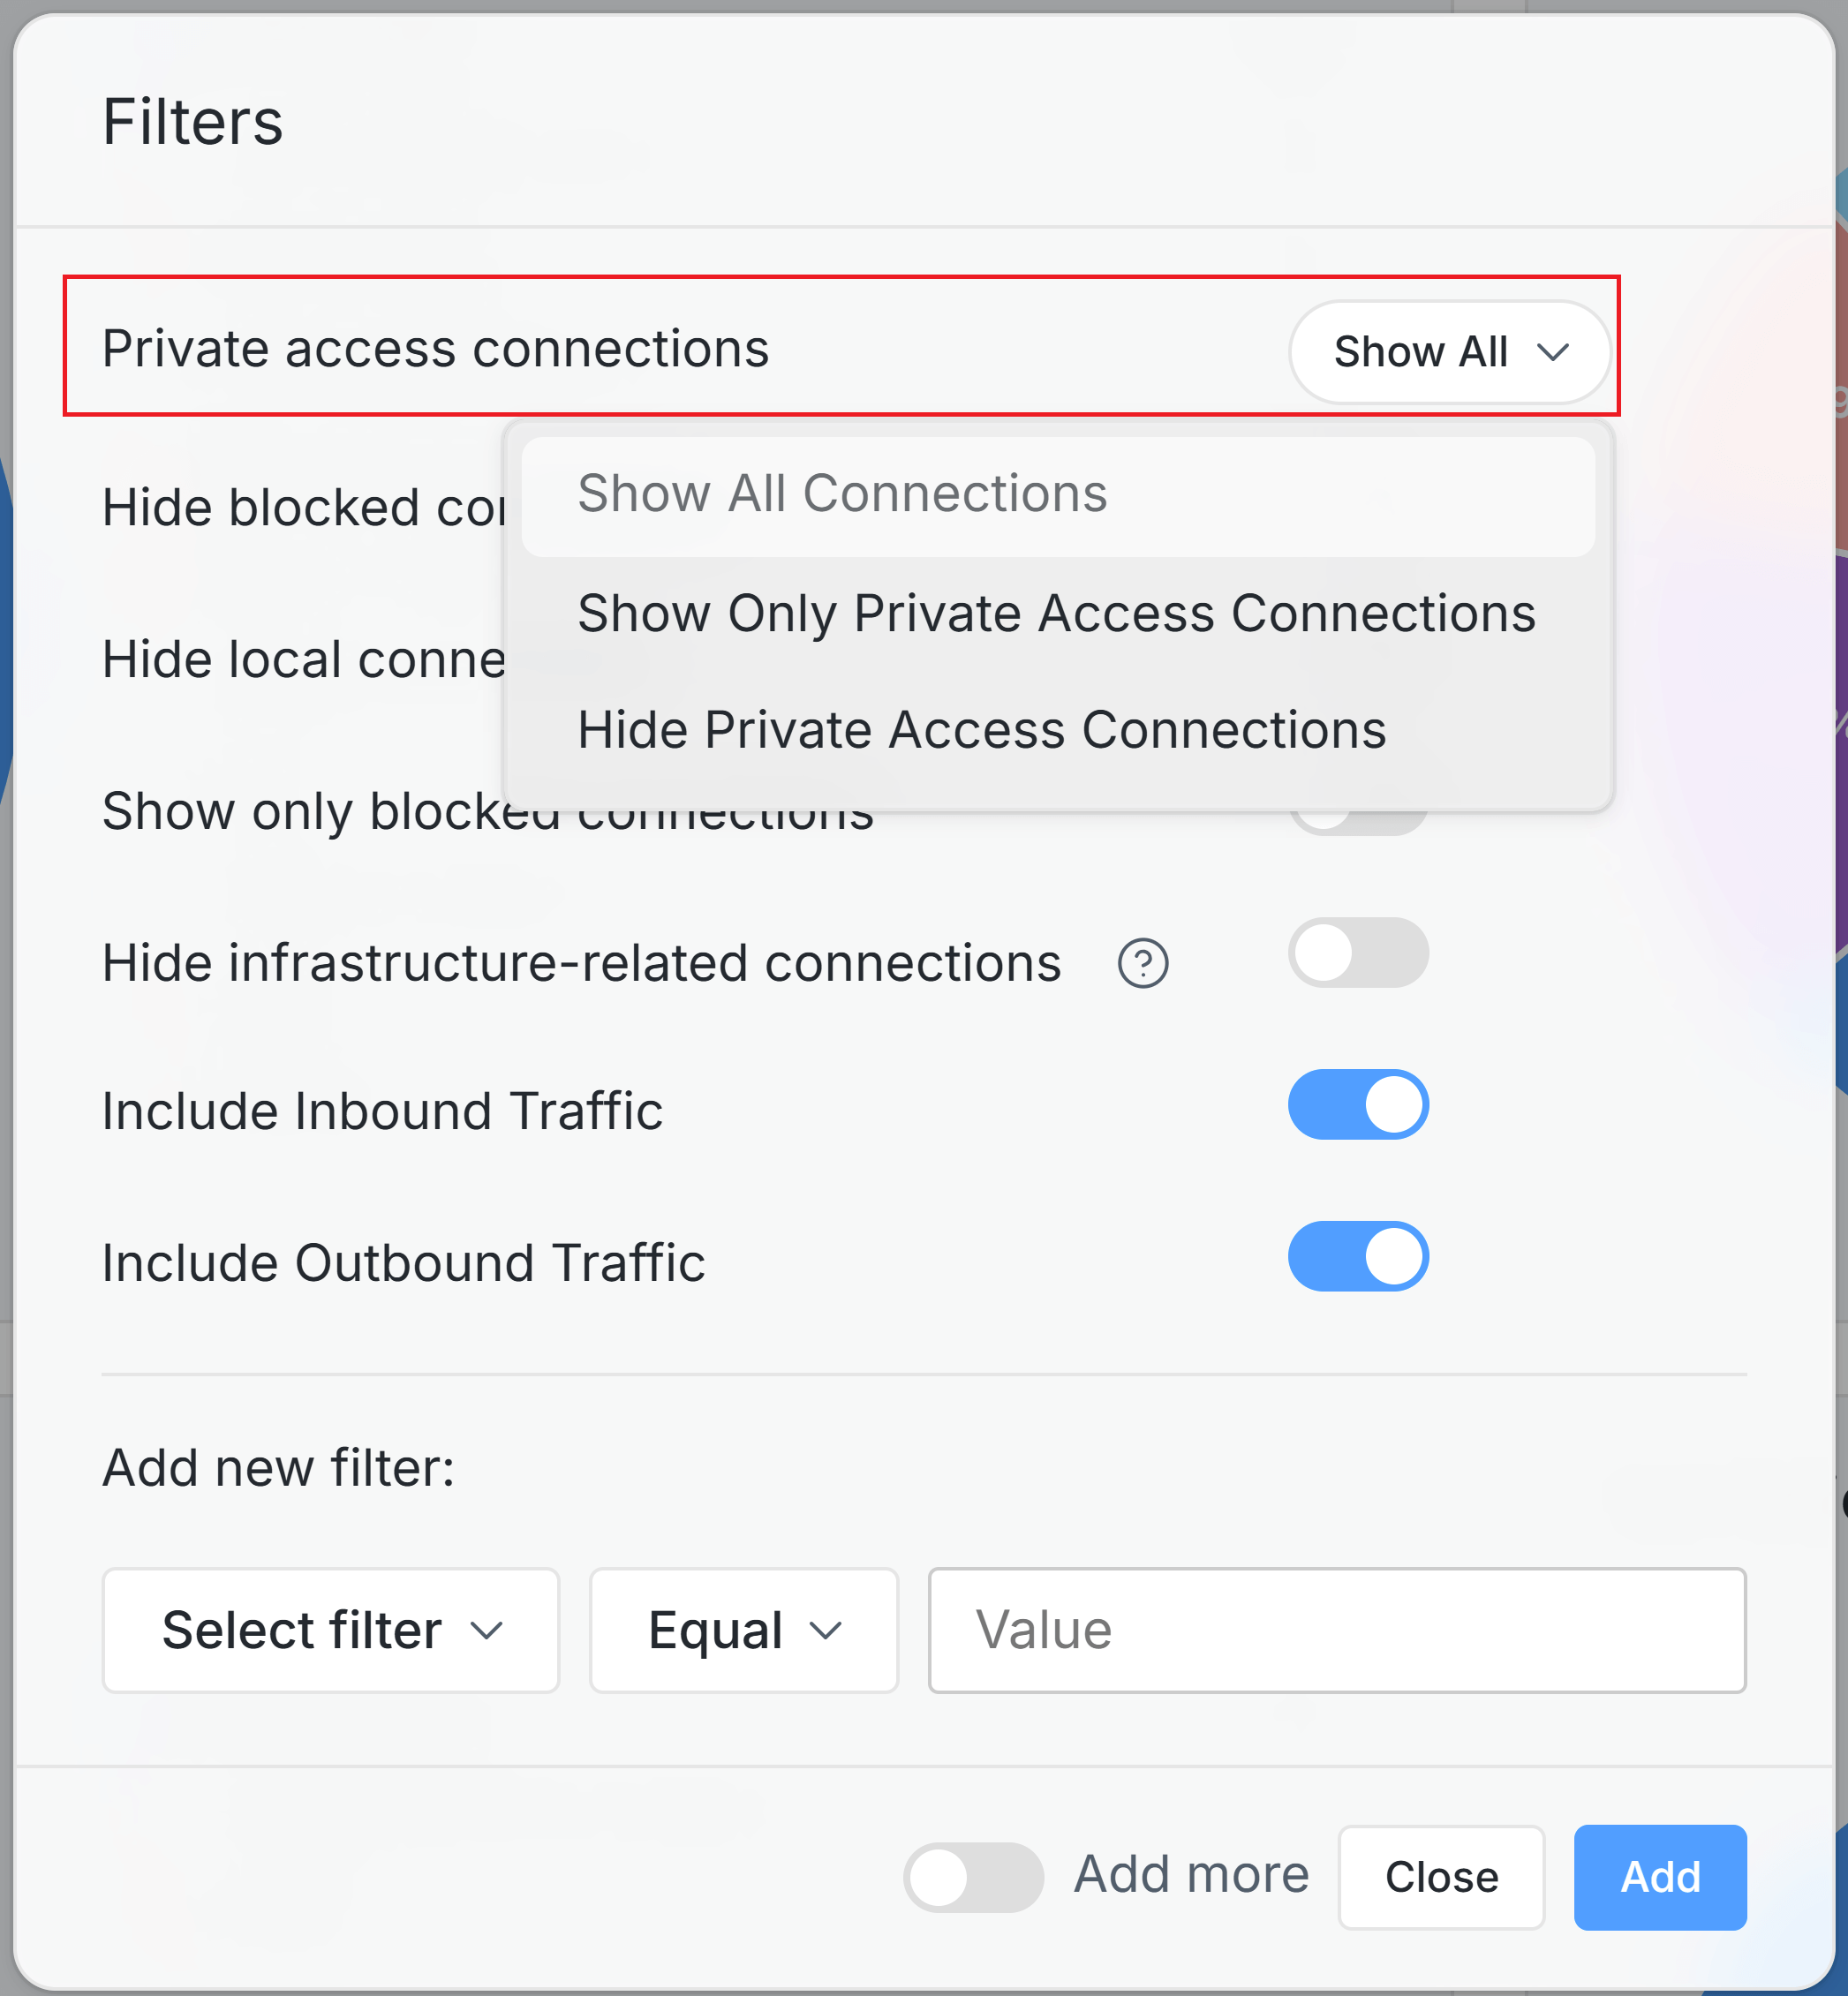
Figure 10. Filtering Private Access Connections
-
Hide Blocked Connections: When you enable this option, blocked sessions are not displayed in the reports.
-
Hide Local Connections: When you enable this option, internal sessions on your LAN are not displayed in the reports.
-
Show Only Blocked Connections: When you enable this option, only blocked connections are displayed in the reports.
-
Hide Infrastructure-related Connections: When you enable this option, infrastructure-related connections are not displayed in the reports.
-
Include Inbound Traffic: Users can apply a filter for both traffic flow directions in reports, ensuring more precise traffic analysis and management. When you enable this option, inbound connections are displayed in the reports.
-
Include Outbound Traffic: When you enable this option, outbound connections are displayed in the reports.
-
-
You may add a new filter by selecting the reporting metric (such as Destination IP) in the first dropdown menu.
-
Select the operator in the second dropdown menu. There are 4 operator options available:
- Equals
- NotEquals
- Contains
- Does not Contain
-
Set a value that you want to be filtered for the report.
-
You may click Add more toggle bar if you want to add multiple filters.
-
Click Add button to activate filtering settings.
-
You may click Close after adding all filters to close the window.
The filter is automatically applied to the charts.

Figure 2. Applying Filter
After adding filters, Save Current Filters and Reset All Filters button will be displayed at top right of the Reports page.
By clicking on the Save Current Filters button, you may save your active filters to them in the future.
By clicking on the Reset All Filters button, you may clear all defined report filtering settings.
Filtering on Charts
To apply a filter to the report view, you may also follow the steps given below:
-
Select one of the chart panes. For example, if you're on Connections tab, you can try App Categories Breakdown.
-
You may hover your mouse over the filtering type on the right sight of the chart pane. This will display Filter, Exclude and drop-down menu with
...icon buttons. For example, hover your mouse overSecure Web Browsing. Clicking on...icon will open a drop-down menu including Filter, Exclude and Live Sessions options.
Figure 3. Adding Filter on Chart
-
Or, you may click on the chart pie that you want to apply a filter. This will open a drop-down menu including Filter, Exclude and Live Sessions options.

Figure 4. Adding Filter via Chart Pie
-
Click either Filter or Exclude button. This will apply your filter to the current report page. For example, click Filter button.

Figure 5. Connections filtered out for Application Category = Secure Web Browsing
You can apply more than one filter to the report view and see the filtering/exclude parameters on the top of the reporting page.

Figure 6. Connections filtered out for Application Category = Secure Web Browsing and Remote Hosts!=10.10.10.1
Report Charts
Due to the nature of the job, Zenarmor creates a vast amount of data and creates meaningful graphics based on them. Each Sub-Module has its own chart setup.
You can hover your mouse over the filtering type on any of the charts to filter out the reporting data on Zenarmor.
Filtering will be automatically applied to all the charts as is.
Connection Report Charts
Zenarmor provides the following Connection charts:
-
App Categories Breakdown
-
Apps Breakdown
-
Top Devices
-
Top Device Categories
-
Top Local Hosts
-
Top Remote Hosts

Figure 7. Connections Report View-1
-
Top Locale Serving Ports
-
Top Remote Ports
-
Egress New Connections by App Over Time
-
Eggress New Connections by Source Over Time
-
Unique Local Hosts
-
New Connections & Unique Remote Hosts

Figure 8. Connections Report View-2
-
Egress New Connections Heatmap
-
Facts
-
Top Eggress Users
-
Top Ingress Users
-
Top Downloaders Heatmap
-
Top Uploaders Heatmap
-
Policies
-
Top Destination Locations Heatmap

Figure 9. Connections Report View-3
-
Interfaces & Vlans
-
Table of Apps
-
Table of Local Assets
-
Table of Remote Hosts
Figure 10. Connections Report View-4
Threats Report Charts
Zenarmor provides the following Threats charts:
- Top Detected Threats
- Top Blocked Threats
- Threats Detected and Allowed
- Top Threat Destinations
- Top Blocked Devices
- Top Detected Devices
- Top Blocked Device Categories
- Top Detected Device Categories
- Top Detected Hosts
- Top Blocked Hosts
- Top Blocked Users
- Top Detected Users
- Top Countries
- Interfaces & Vlans
- Policies

Figure 11. Threats Report View
Blocks Report Charts
Zenarmor provides the following Blocks charts:
- Top Devices
- Top Device Categories
- Blocked Local Hosts and Reasons
- Top Blocks
- Blocked Conversations Heatmap
- Blocked Local Hosts Over Time
- Top Eggress Users
- Top Ingress Users
- Interfaces & Vlans
- Policies

Figure 12. Blocks Report View
Web Report Charts
Zenarmor provides the following Web charts:
-
Top Categories
-
HTTP Transactions by Source Over Time
-
Top Devices
-
Top Device Categories
-
Top Talkers Heatmap
-
Top Request Methods
-
Top HTTP Versions
-
Top HTTP Response Codes

Figure 13. Web Report View-1
-
Top Web Ports
-
Top OS
-
Top Eggress Users
-
Top Ingress Users
-
Top User Agents
-
Policies
-
Interface & Vlans
-
Top Devices

Figure 14. Web Report View-2
-
Table of Sites
-
Table of URIs

Figure 15. Web Report View-3
DNS Report Charts
Zenarmor provides the following DNS charts:
-
DNS Transactions Heatmap
-
Policies
-
DNS Queries Distribution
-
DNS Query Types
-
Top Devices
-
Top Device Categories
-
Top Eggress Users
-
Top Ingress Users
-
DNS Response Codes Tag Cloud
-
Interface & Vlans

Figure 16. DNS Report View
TLS Report Charts
Zenarmor provides the following TLS charts:
-
Top Talkers Heatmap
-
Web Categories Breakdown
-
Policies
-
Top TLS Session Creators Over Time
-
Top Destination Ports
-
Top TLS Servers Over Time
-
Top Devices
-
Top Device Categories
-
Top Eggress Users
-
Top Ingress Users
-
Interface & Vlans

Figure 17. TLS Report View
Video on Zenarmor Advanced Reporting Capabilities
Here is a video about the Zenarmor Advanced Reporting Capabilities