Zenarmor Report Views on OPNsense
Zenarmor® has rich and customizable views and reports that you can enjoy analyzing both the big picture and also detailed per-connection events. Reports can be customized, filtered, generated, and scheduled to be sent to your emails. You can generate ad-hoc graphical views of summary traffic and threat activity, view sessions in real-time or historical, and search in views. With the help of Zenarmor reporting capabilities, you can quickly identify and react to network security threats across the network (responsive reporting capability).
To view the Zenarmor reports, navigate to Zenarmor → Reports on your OPNsense web UI.
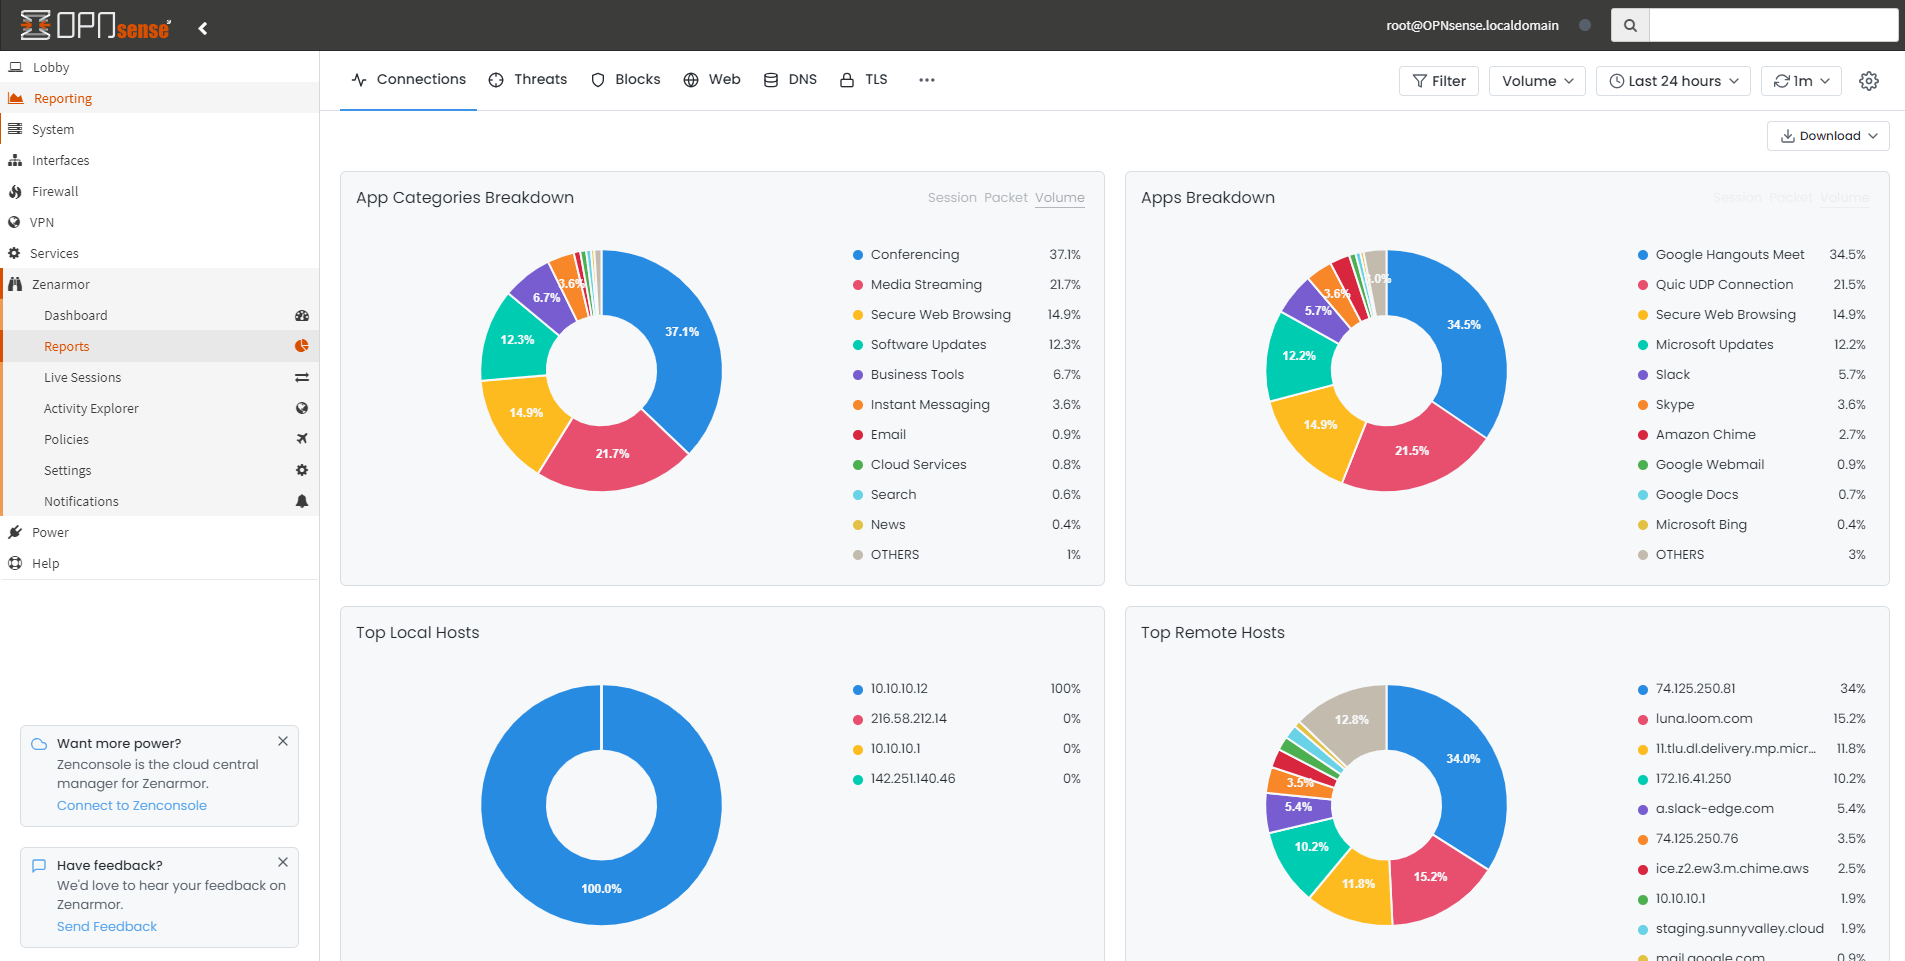
Figure 1. Viewing Zenarmor Reports
Report Views
There are six types of predefined Zenarmor Report Views. Each one is displayed in a different tab on the Zenarmor Reports page:
1. Connections
Connection Tab shows the various applications in your network that are making connections both internally and externally in your network. These connections may be of any protocol and not just HTTP/HTTPS traffic.
This tab shows the following connection details:
-
Application and application categories
-
Protocols used for the connections
-
Duration of the connection, and many other details
There are more than twenty different types of charts in the Connections Tab.
-
App Categories Breakdown
-
Apps Breakdown
-
Egress New Connections by App Over Time
-
Egress New Connections by Source Over Time
-
Egress New Connections Heatmap
-
Table of Remote Hosts
-
Top Devices
-
Top Device Categories
-
Top Egress Users
-
Top Ingress Users
-
Top Local Hosts
-
Top Remote Hosts
-
Top Remote Ports
-
Top Locale Serving Ports
-
Unique Local Hosts
-
New Connections & Unique Remote Hosts
-
Facts
-
Top Destination Locations Heatmap
-
Table of Apps
-
Table of Local Assets
-
Table of Remote Hosts
-
Interfaces & Vlans
-
Policies
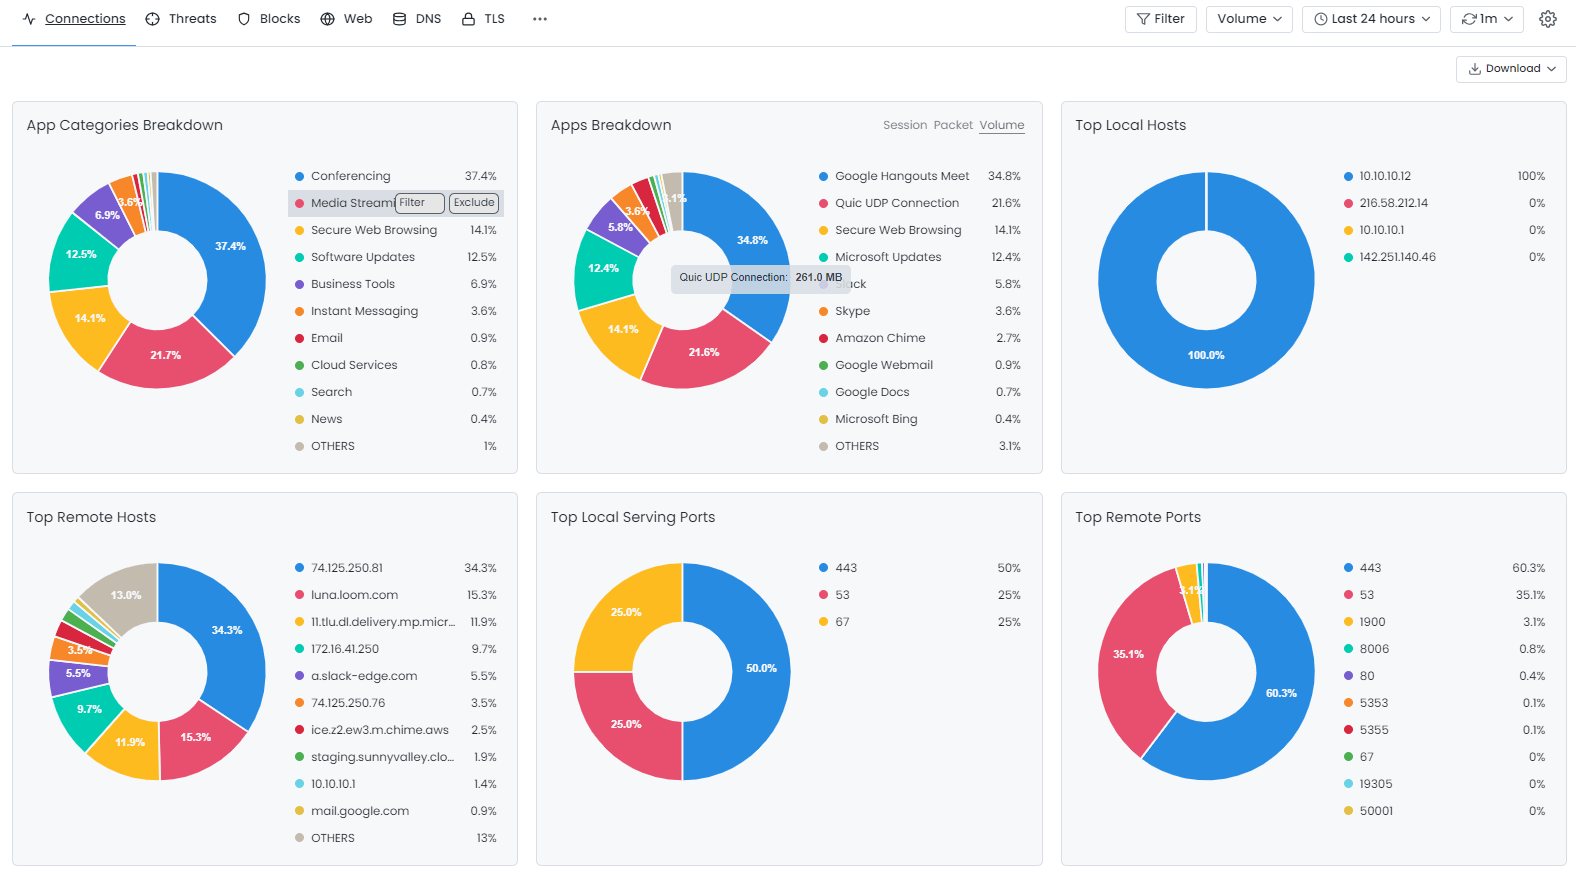
Figure 2. Charts Displayed in Connections Report View
2. Threats
Threat Tab shows any threat that has been recognized based on the Essential Security and Advanced Security capabilities of the engine. If your engine detects a security risk such as malware activity, a phishing server connection, a spam site connection, etc, you can view the statistics of these security violations here.
Zenarmor provides the following Threats charts:
-
Top Blocked Devices
-
Top Detected Devices
-
Top Blocked Device Categories
-
Top Detected Device Categories
-
Top Countries
-
Threats Detected and Allowed
-
Top Detected Threats
-
Top Detected Users
-
Top Detected Hosts
-
Top Threat Destinations
-
Top Blocked Threats
-
Top Blocked Hosts
-
Top Blocked Users
-
Interfaces & Vlans
-
Policies
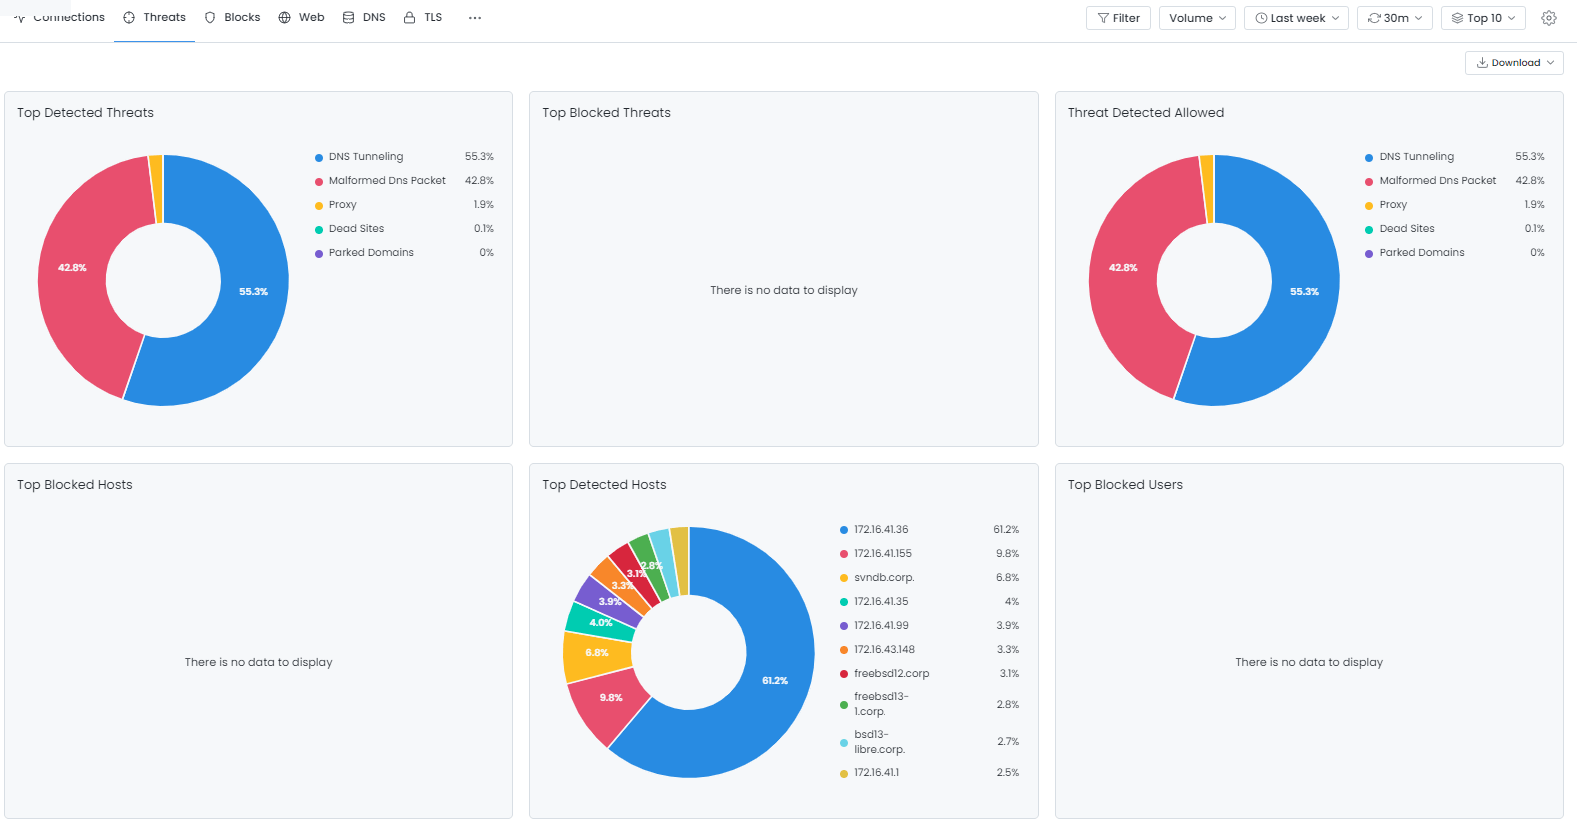
Figure 3. Charts Displayed in Threats Report View
3. Blocks
Blocks Tab shows everything that has been blocked based on your web/app controls. If the engine blocks any connection based on your defined policy rules, you can find all statistics about this blocked connection here.
Zenarmor provides the following Blocks charts:
-
Top Devices
-
Top Device Categories
-
Top Blocks
-
Top Egress Users
-
Top Ingress Users
-
Blocked Local Hosts and Reasons
-
Blocked Conversations Heatmap
-
Blocked Local Hosts Over Time
-
Interfaces & Vlans
-
Policies
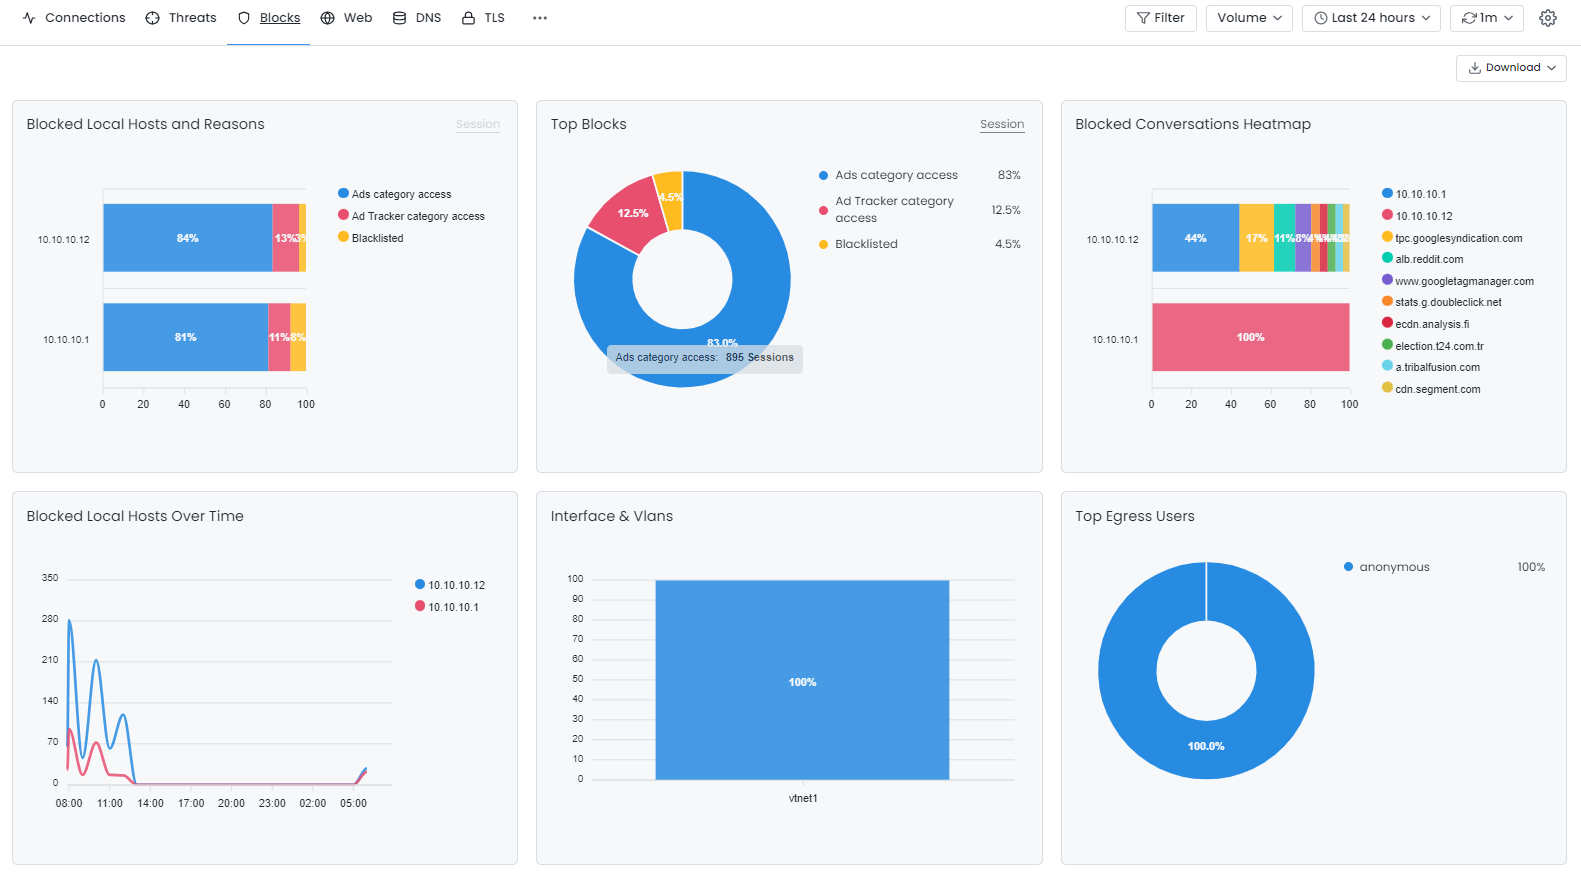
Figure 4. Charts Displayed in Blocks Report View
4. Web
Web Tab shows web-based traffic (generated by browsing websites or API calls) reports.
This Tab provides detailed information about the website category, the method used (GET, POST, etc), the hostname, and other information.
-
Top Devices
-
Top Device Categories
-
Top Eggress Users
-
Top Ingress Users
-
Policies
-
Interface & Vlans
-
Table of Sites
-
Table of URIs
-
HTTP Transactions by Source Over Time
-
Top HTTP Versions
-
Top HTTP Response Codes
-
Top Web Ports
-
Top Talkers Heatmap
-
Top Categories
-
Top OS
-
Top User Agents
-
Top Request Methods
-
Top Devices
-
Policies
-
Interface & Vlans
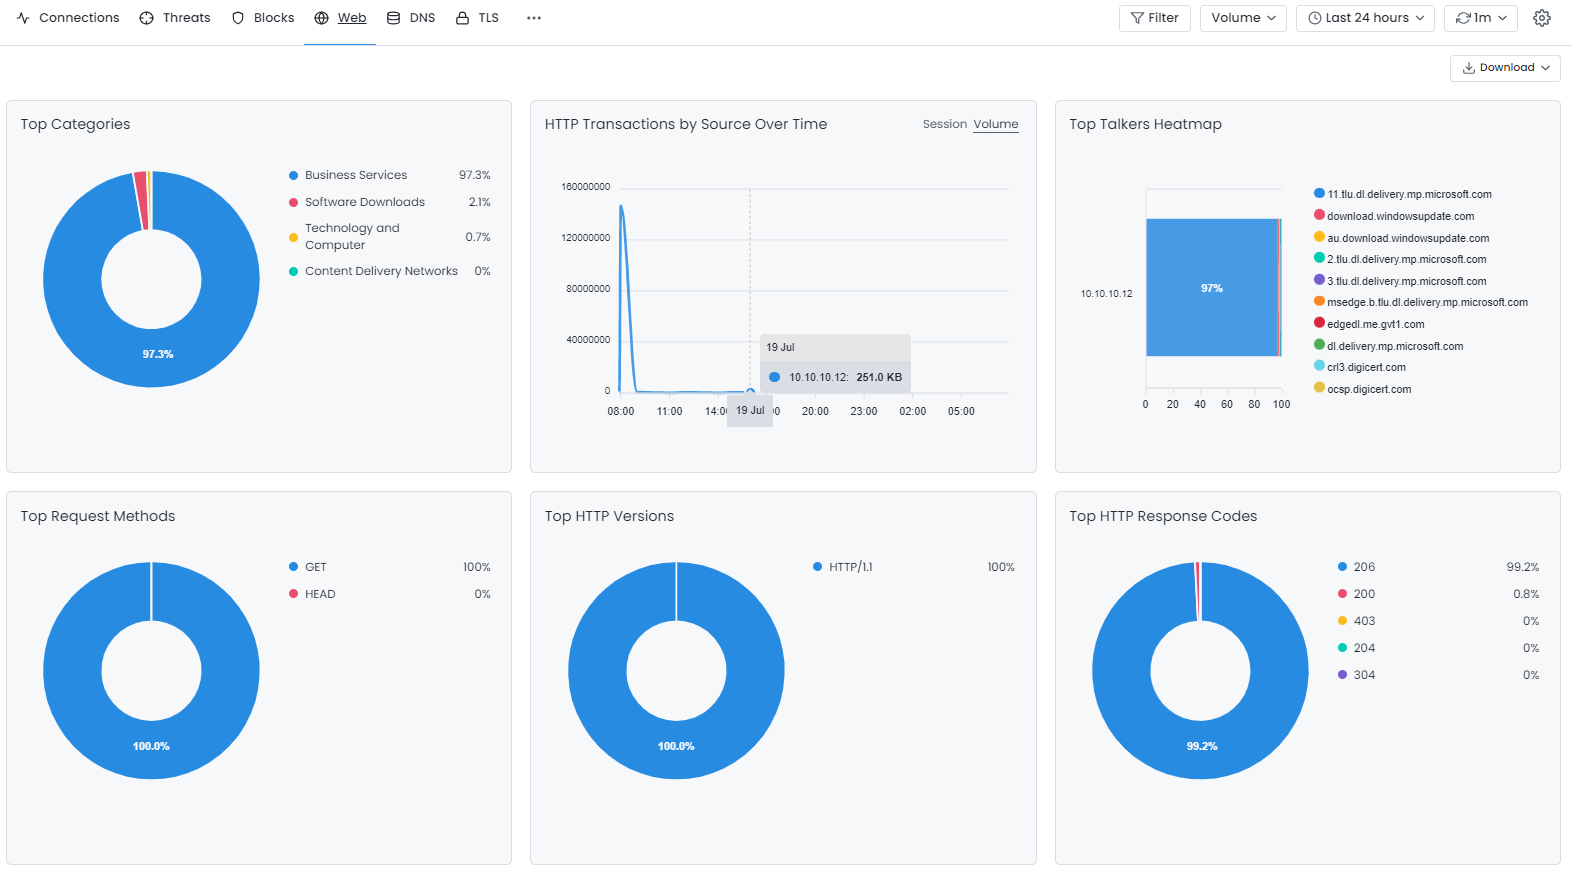
Figure 5. Charts Displayed in Web Report View
5. DNS
DNS Tab provides information about the most frequent DNS requests and other DNS-related information. Zenarmor provides the following DNS charts:
-
Top Devices
-
Top Device Categories
-
Top Eggress Users
-
Top Ingress Users
-
DNS Query Types Tag Cloud
-
DNS Response Codes Tag Cloud
-
DNS Queries Distribution
-
DNS Transactions Heatmap
-
Policies
-
Interface & Vlans
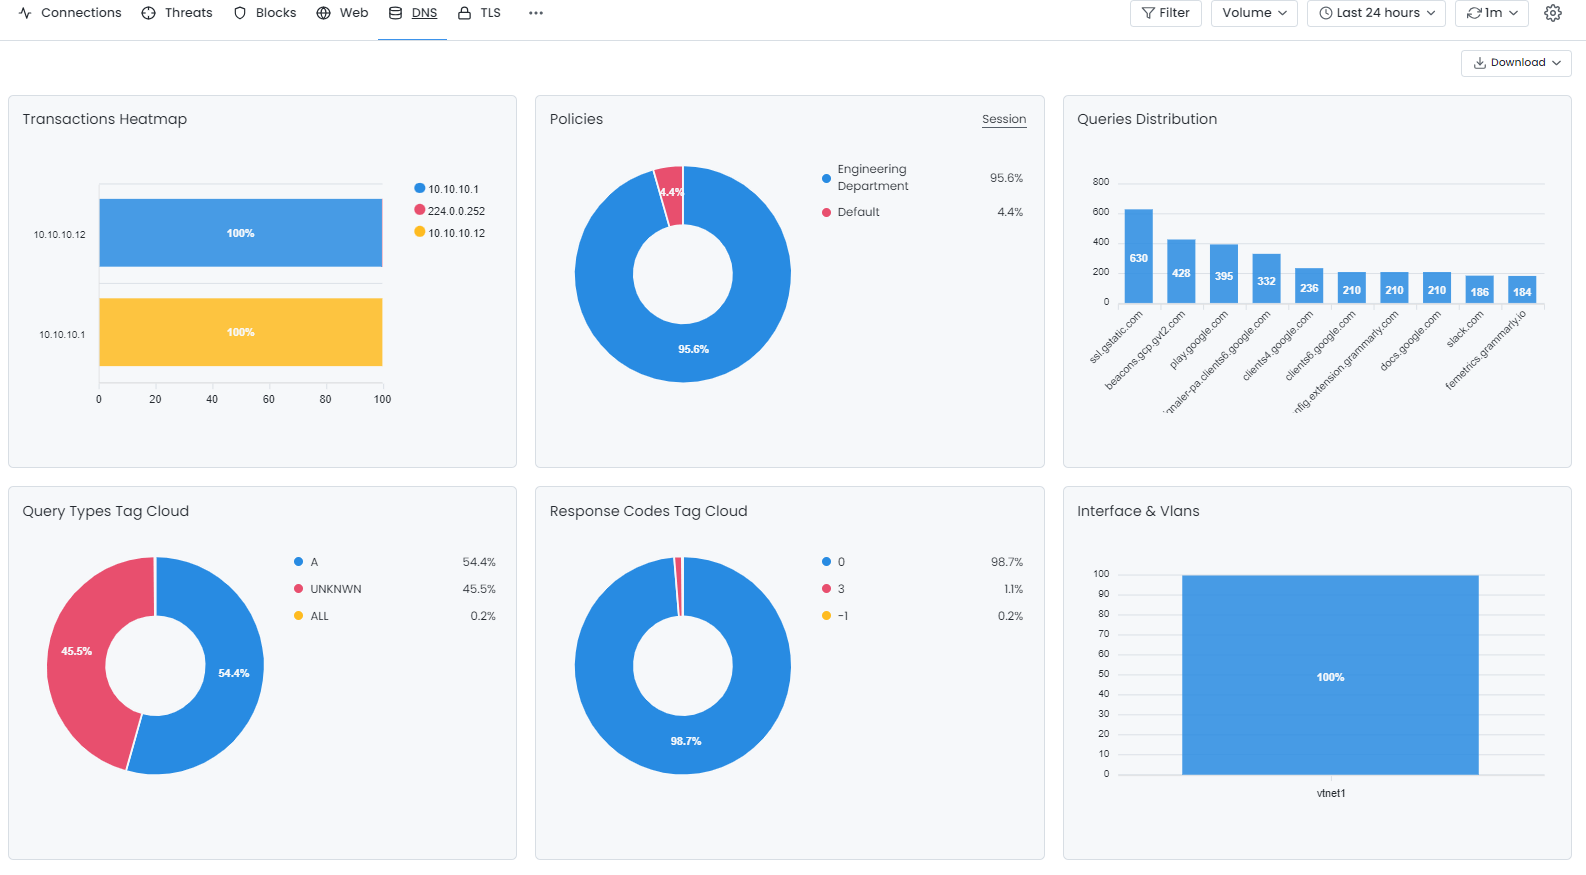
Figure 6. Charts Displayed in DNS Report View
6. TLS
TLS Tab shows TLS session information such as the host/IP in which most TLS sessions are created, used ports general categories of the sessions, and other metrics.
Zenarmor provides the following TLS charts:
-
Top Destination Ports
-
Top TLS Session Creators Over Time
-
Top TLS Servers Over Time
-
Top Talkers Heatmap
-
Web Categories Breakdown
-
Policies
-
Interface & Vlans
-
Top Devices
-
Top Device Categories
-
Top Eggress Users
-
Top Ingress Users
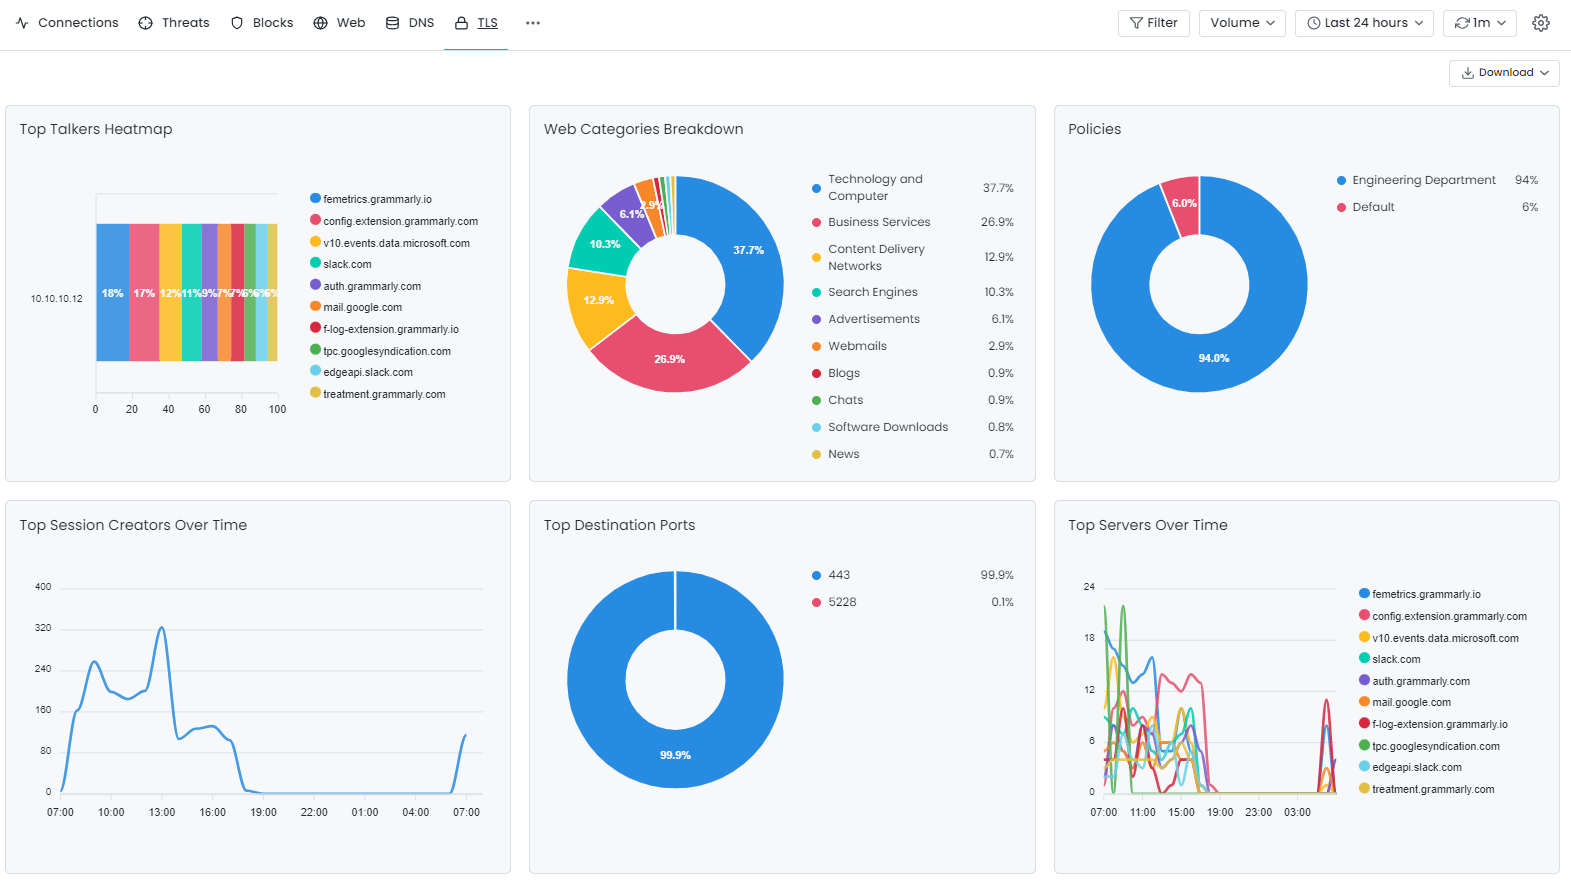
Figure 7. Charts Displayed in TLS Report View