Viewing Home/Dashboard on Zenconsole
The Home page is the first page of the Zenconsole (Centralized Cloud Management Portal). This page contains a dashboard that allows you to view the most critical network activity at a glance. You may also view system-level information and manage your Zenarmor® packet engine and database.
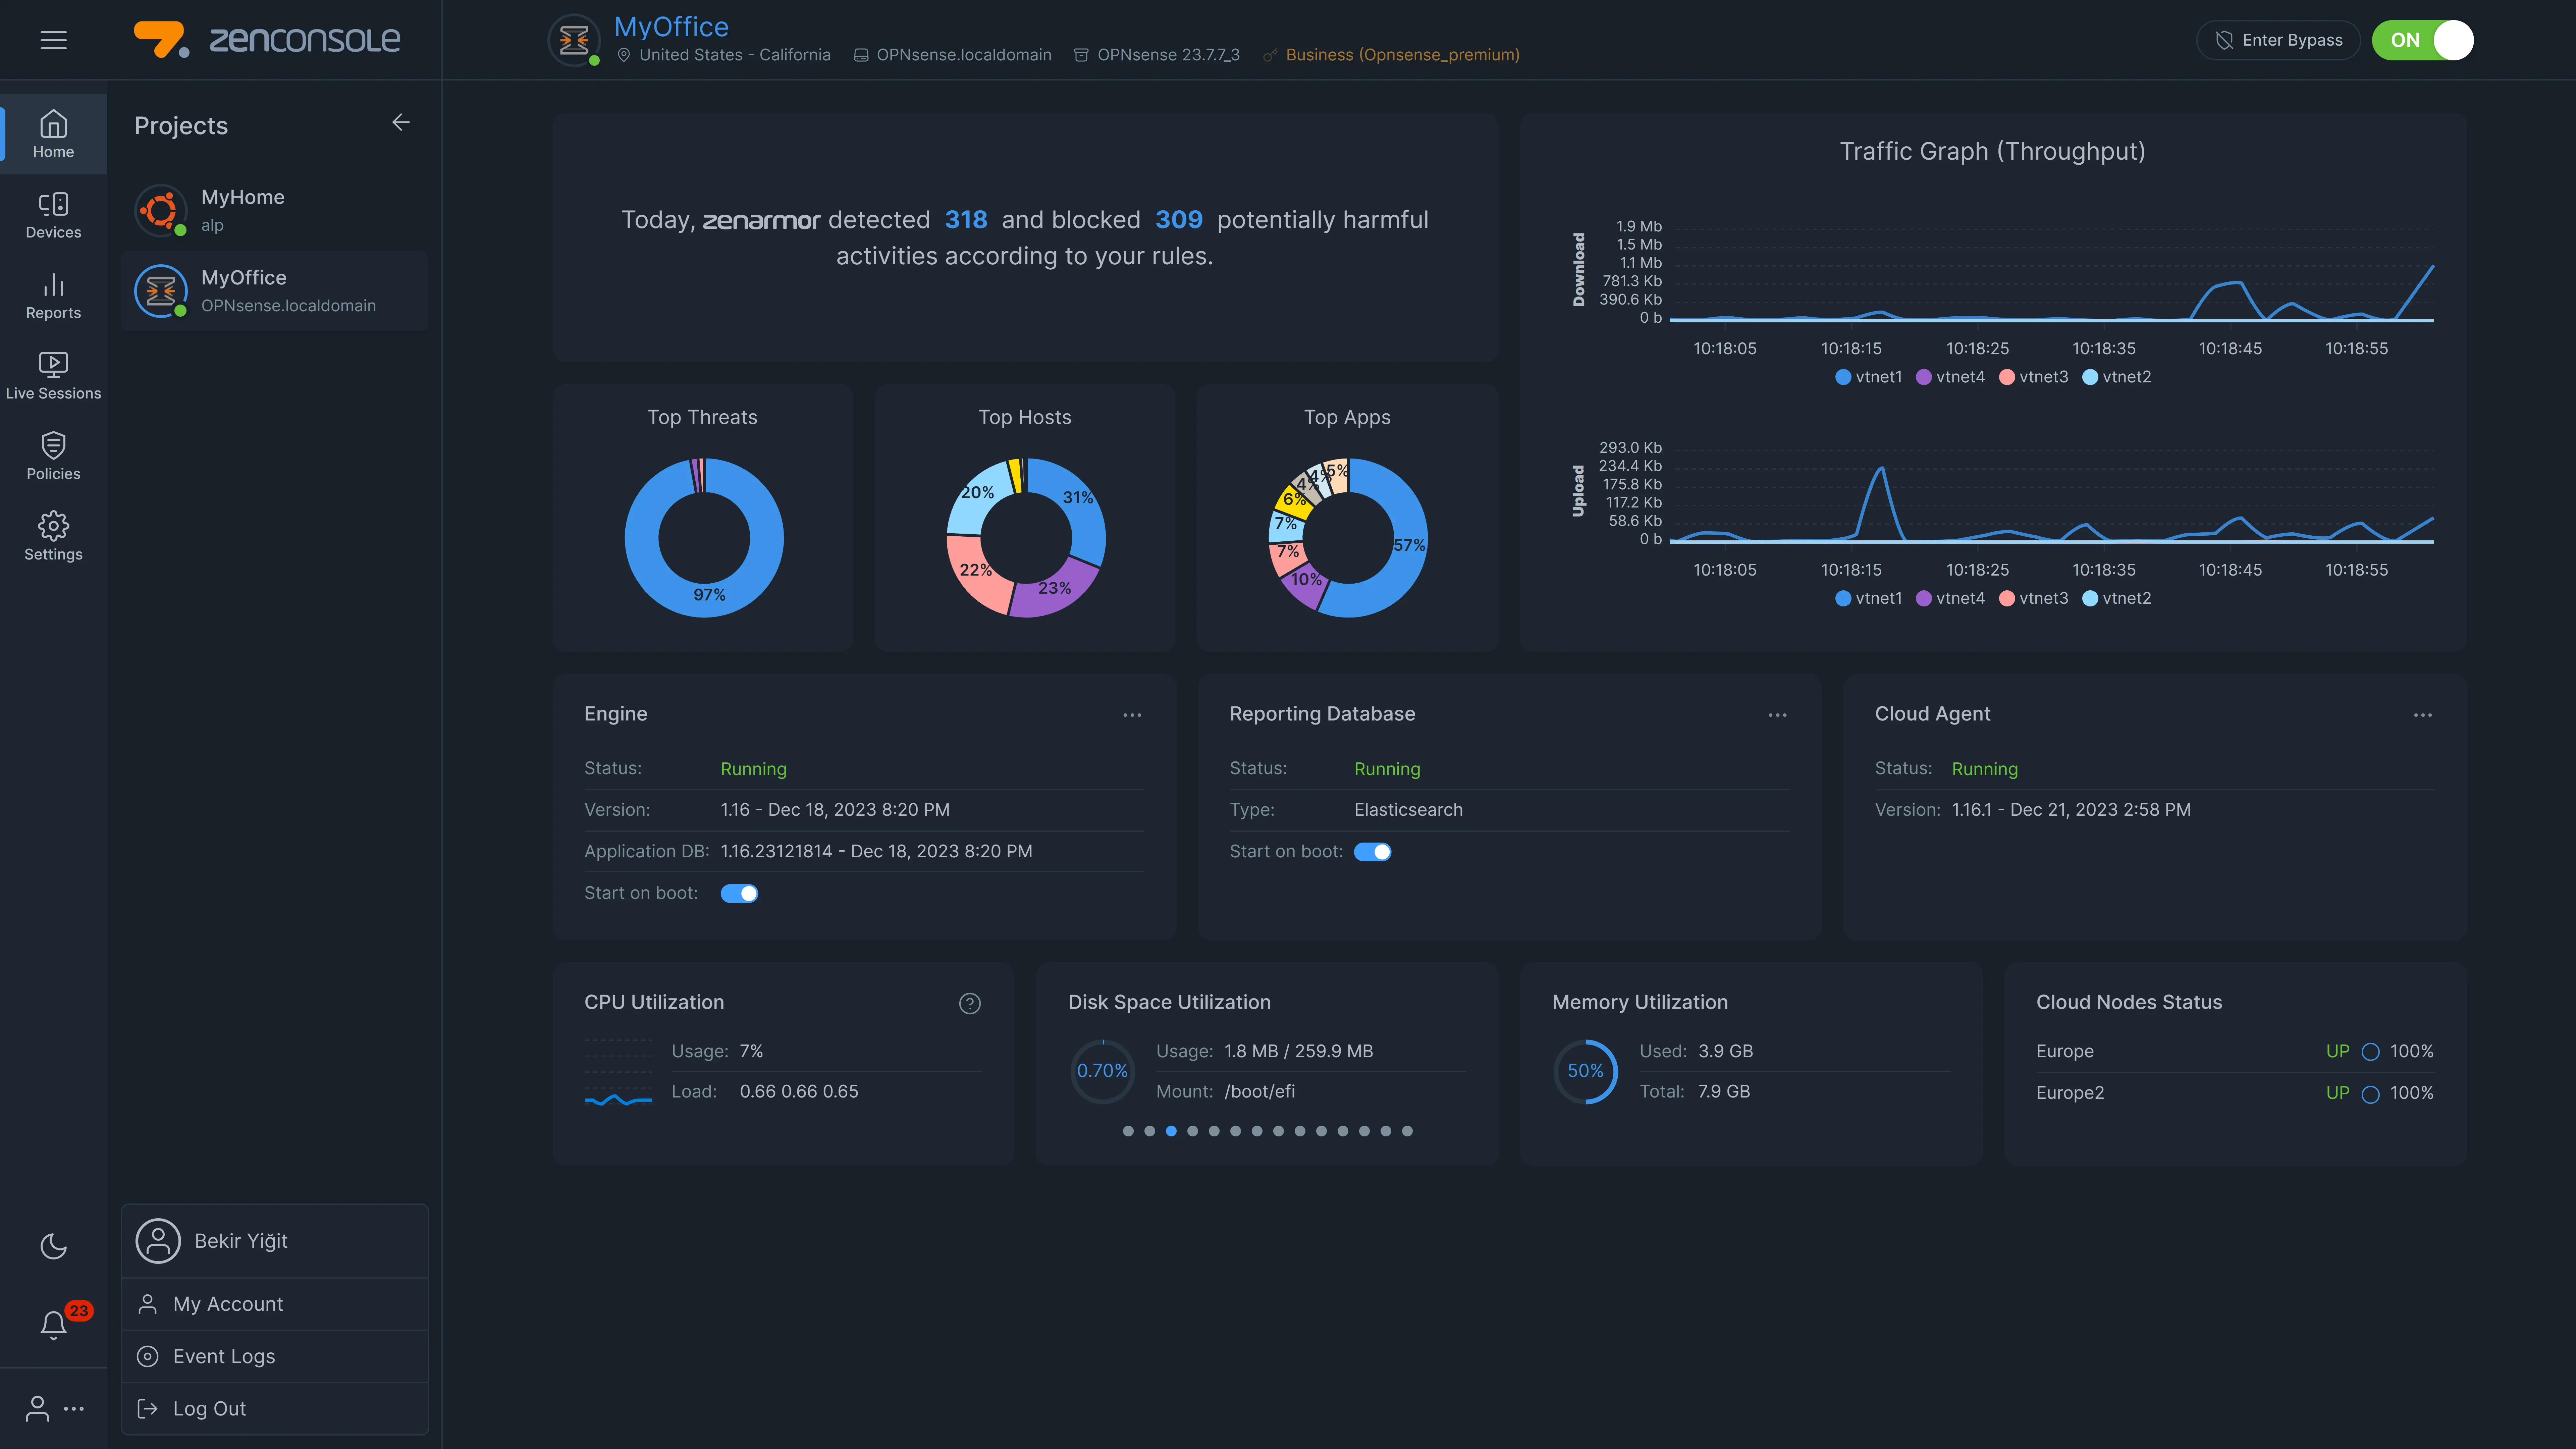
Figure 1. Zenarmor Node Home/Dashboard
During Zenarmor's development, simple, self-explanatory terminology was used on the user interface. If you are familiar with your home router's management user interface, you may feel comfortable using the Zenconsole.
Viewing the Dashboard on Cloud Management Portal
If you have more than one firewall registered to the Zenconsole, they are listed under the Projects menu on the left sidebar in ascending alphabetical order. When you sign in to your Zenconsole, only your first firewall dashboard is displayed on the Home page.
To view the dashboard of a firewall, click Home on the left-hand sidebar after selecting the firewall node that you wish to see.
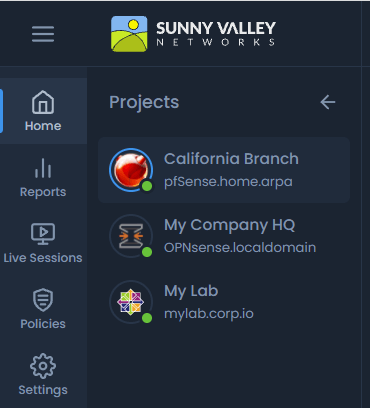
Figure 2. Viewing the Home/Dashboard of a Registered Node
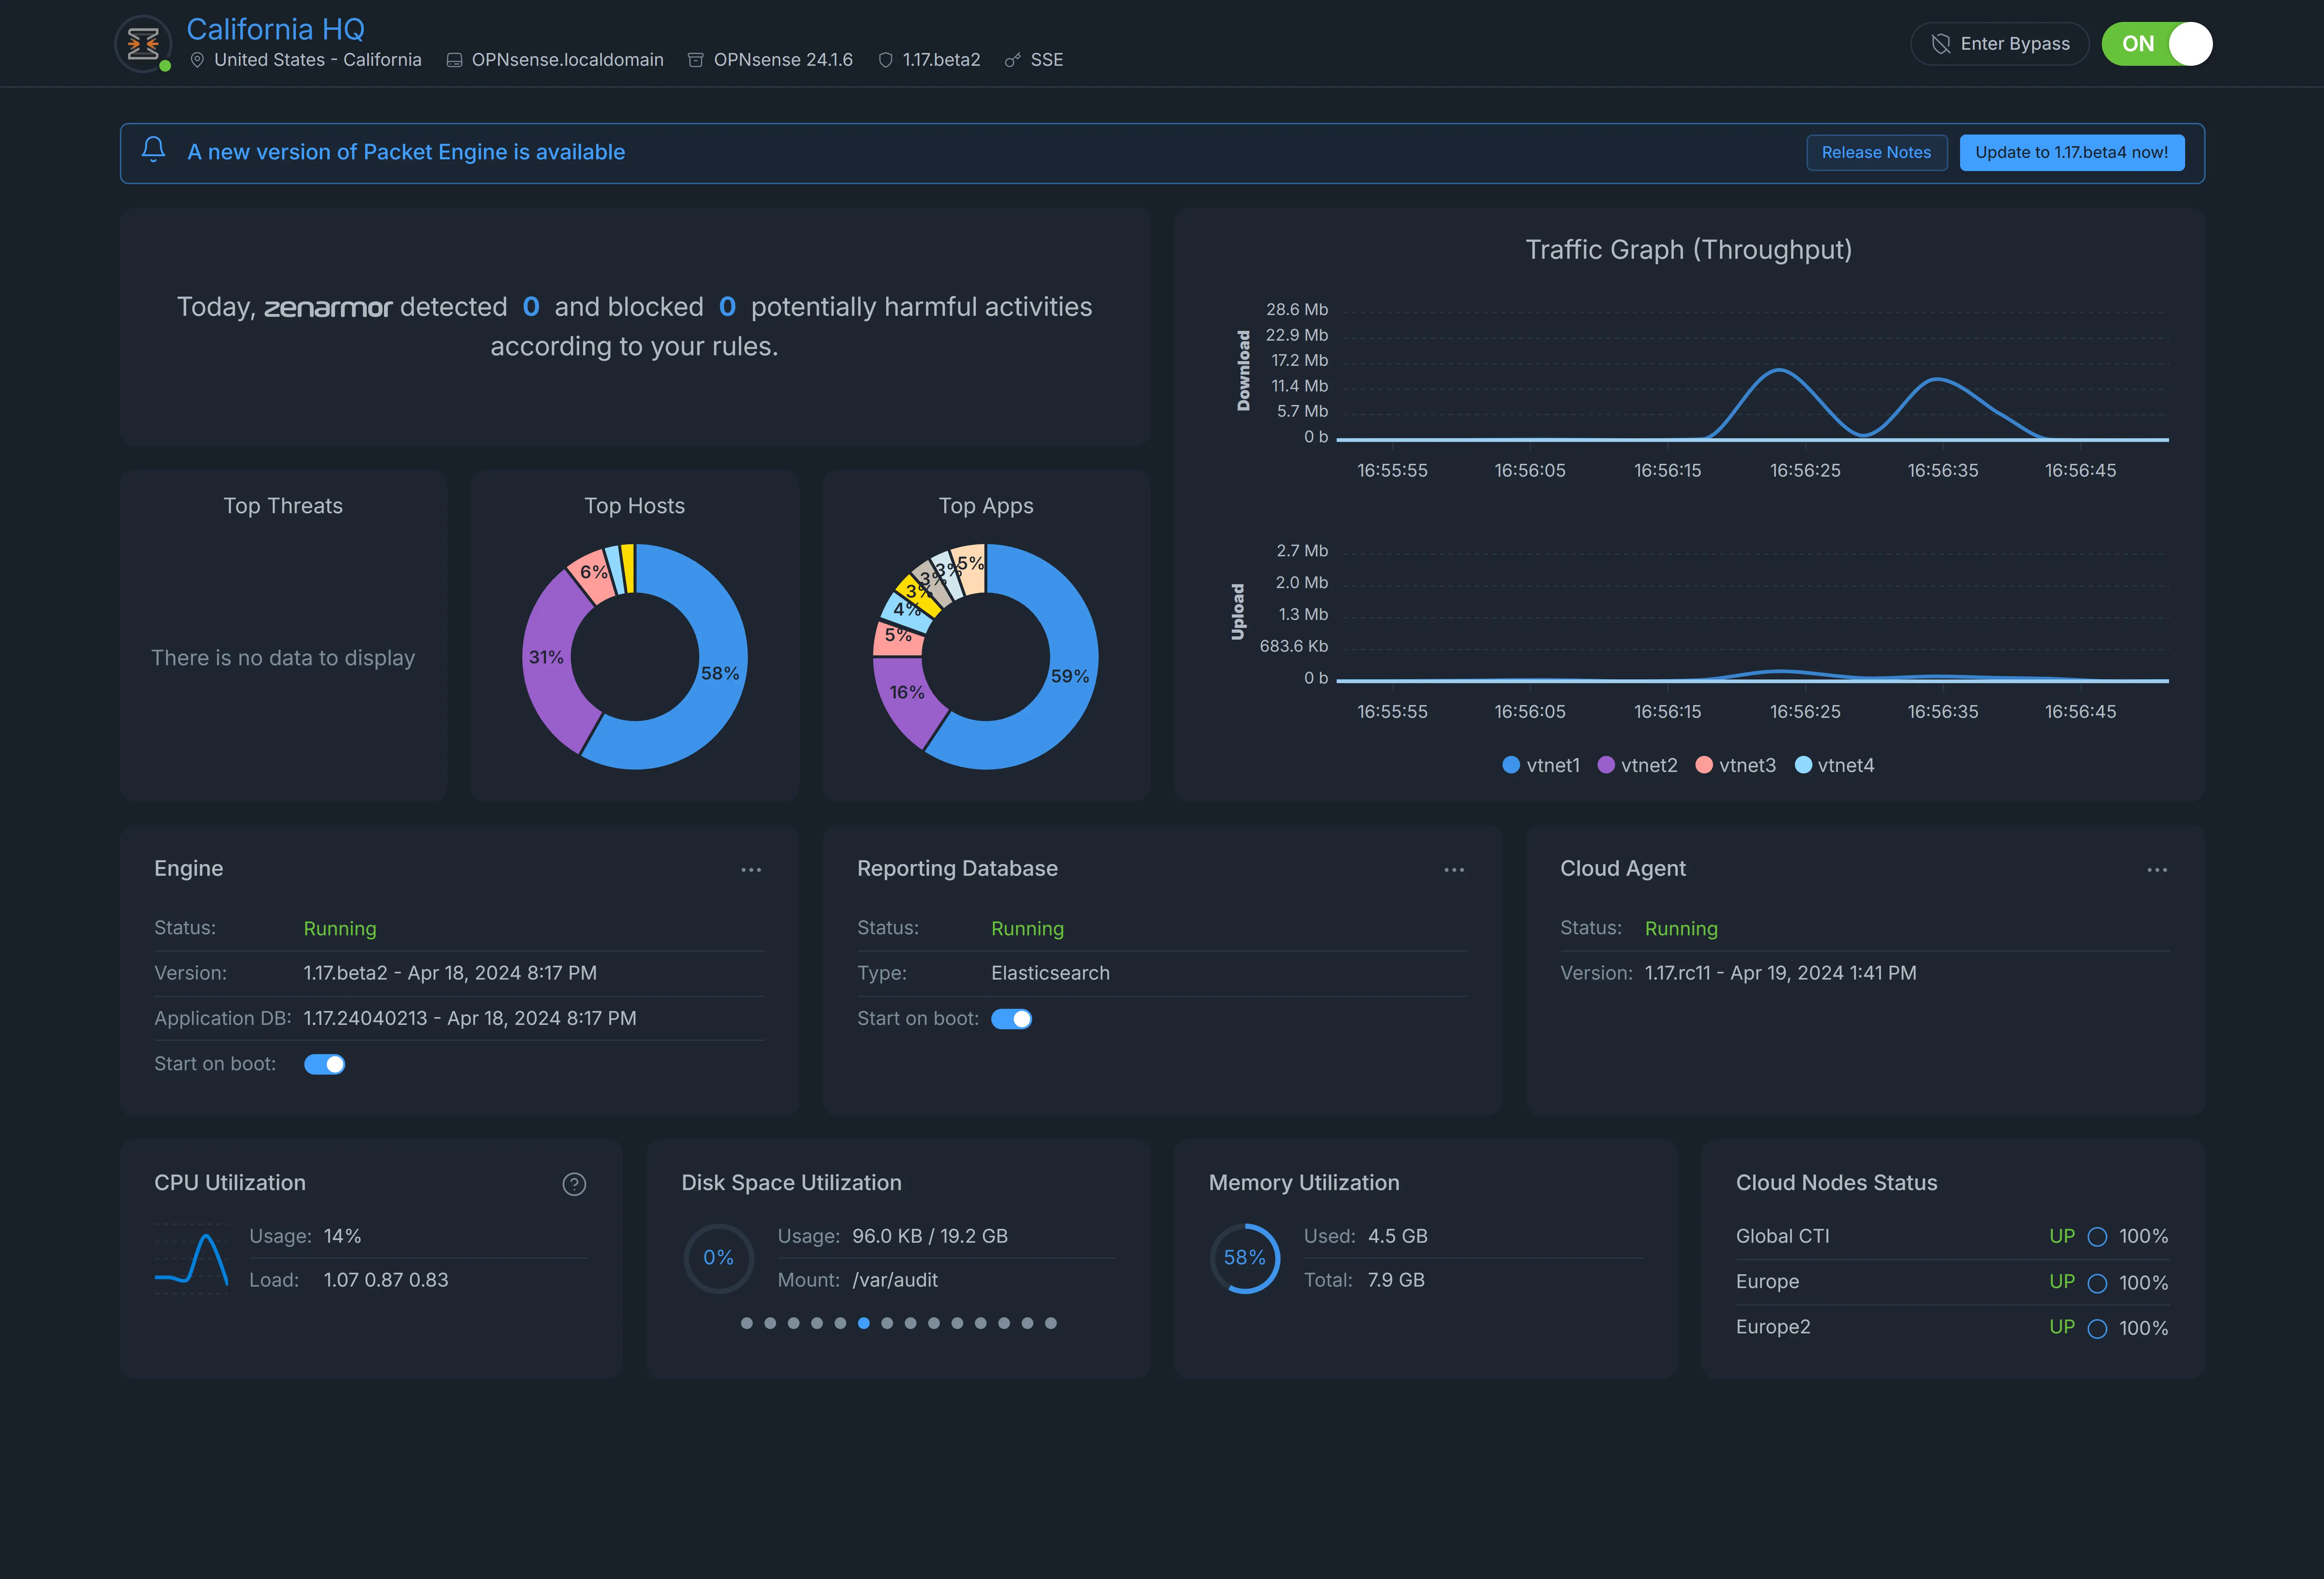
Figure 3. Zenarmor Node Dashboard/Home of a selected node
If your node is healthy, a solid green circle is displayed in the bottom right corner of the node's icon on the registered firewall list.
If it is not healthy, you will see a solid red circle instead of green. When you click on the unhealthy node, you will see a Node not connected message on the dashboard (see figure 4).

Figure 4. Dashboard of an unhealthy node
To maximize the view of the dashboard, you may collapse the Projects list bar by clicking on the hamburger menu icon at the top left corner of the page.
Dashboard Components on Cloud Management Portal
The dashboard consists of the following areas:
1. Node Information Bar
Th Node Information Bar is displayed at the top of the Cloud Management Portal. You can view the following information about the selected node:
-
Name (provided during the initial configuration of the node)
-
Status: There are 4 status icon colors:
- Green: Connected
- Red: Error (not connected, backend error etc)
- Orange: Engine bypass mode
- Gray: Engine stopped
-
Location
-
Domain Name (retrieved from the system automatically)
-
Operating System and version (OPNsense, Ubuntu, Centos, FreeBSD, AlmaLinux, Debian, etc)
-
Subscription (Free, HOME, SOHO, Business)
-
Sharing Status (Shared means that you are managing the node with a team. If the node is not shared with anyone, the sharing status is not displayed on the node information bar)

Figure 5. Node Information Bar
Engine Start/Stop
You can also stop/start the packet engine on your node by clicking on the toggle button on the node information bar.
Enter/Exit Bypass Mode
You can run the packet engine in bypass mode by clicking on the Enter Bypass button on the node information bar.
In bypass mode, packet engine status is displayed as orange toogle button with BYPASSED on the node information bar.
Then, you may exit from the Bypass Mode by clicking on Exit Bypass button.

Figure 6. Running Bypass Mode
Changing Node Name
You can change your node name by clicking on the node name.
Maximum of 30 characters is allowed). Special characters like (*-/?) will be removed automatically from the node name.
Figure 7. Changing Node Name
2. Notifications Bar
When the application database is updated automatically or an update is available for the engine or subscription status is changed, notifications are displayed on the bar.

Figure 8. Notifications Bar
Update Zenarmor Engine
When a new Zenarmor engine version is available, you will see a notification on the bar. You can view the Release Notes for the latest version by clicking on the Release Notes link.
To update your engine just click on the Update to link on the notification bar.
Here is a video that will guide you through the steps of the Zenarmor Packet Engine update process via Zenconsole:
3. Threat Summary Pane
You can view the total number of detected and blocked network security threats on your network on the last 24 hours according to your policies.

Figure 9. Threat Summary Pane
A Threats Lives session explorer, which exhibits all identified and blocked threats, can be accessed by tapping on the numerical values in this pane.
4. Traffic Throughput Graph
The Home page provides you with an easy to read and interactive network usage graph. You can monitor network traffic throughput of protected interfaces in real-time. Throughput is displayed for both incoming and outgoing traffic. The last 20 throughput values retrieved from the node are displayed.
Figure 10. Traffic Throughput Graph
Viewing Network Throughput at a Specific Point in Time
To view the network throughput at any point of time, hover your mouse over the line on the graph as shown in figure 10.
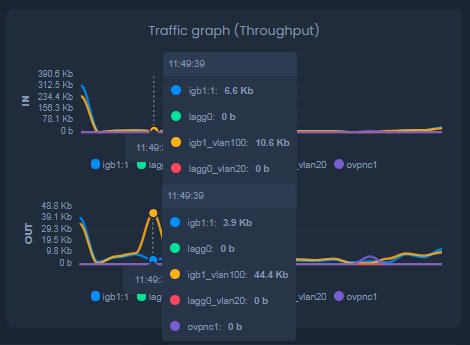
Figure 11. Viewing traffic throughput at a specific point in time
Interface Filtering on the Traffic Throughput Graph
If you have more than one protected interface on your node, you will see the network throughputs of multiple interfaces simultaneously.
However, you may want to focus on the throughput of one/some of the interfaces.
To view the throughput of a single interface, hover your mouse over the interface name at the bottom of the graph. This will display the selected interface's throughput for several seconds on the graph.
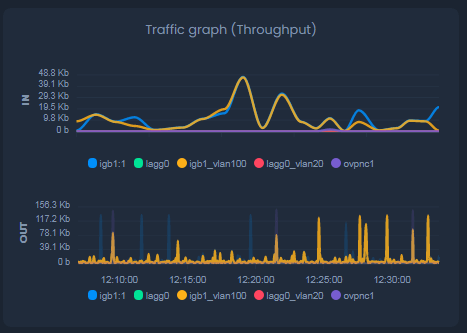
Figure 12. Filtering an Interface (igb1_vlan100 interface filtered on OUT)
You may also exclude one or more of the interfaces by clicking on the interface name(s) at the bottom of the graph. This will remove the selected interface line from the graph.
Figure 13. Excluding Interface (igb1_vlan100 and lagg0_vlan20 interface are excluded)
5. Top Pie Charts
You can view the following 3 Top Pie Charts:
-
Top Threats: Top (Top 5 and others) blocked security threats on your network for the current day. You can view the details of these threats by hovering your mouse over the pie chart.
Figure 14. Top Threats Chart (8 Parked Domains sessions are blocked, for example)
-
Top Hosts: Top (Top 5 and others) hosts which have the highest network bandwidth usage for the current day. You can view the details of these hosts(hostname/IP and its total bandwidth usage) by hovering your mouse over the pie chart.
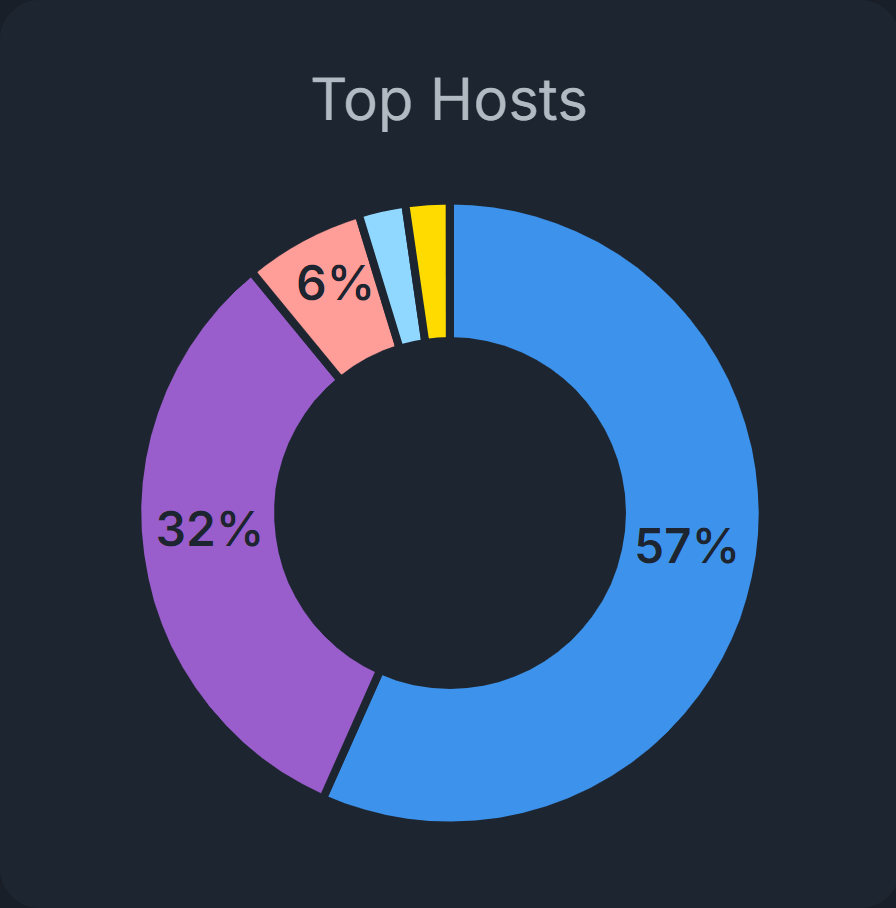
Figure 15. Top Hosts Chart
-
Top Apps: Top (Top 5 and others) applications that have the highest network bandwidth usage for the current day. You can view the details of these applications(Application Category and its total bandwidth usage) by hovering your mouse over the pie chart.
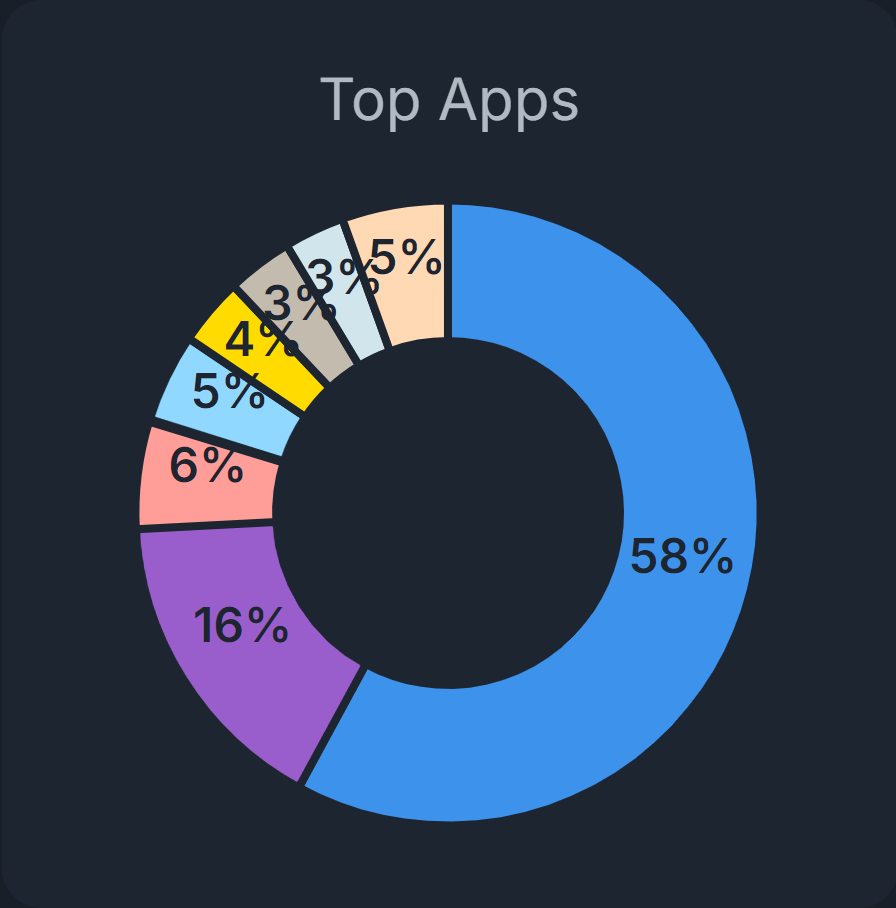
Figure 16. Top Apps Chart
6. Services Status
You can view the status of the Zenarmor-related services on the dashboard. It provides all critical system-level information you need to manage your node. The following services are listed here:
-
Engine
-
Reporting Database
-
Cloud Agent
-
Cloud Nodes

Figure 17. Services Status(Engine, Reporting DB, Cloud Agent)
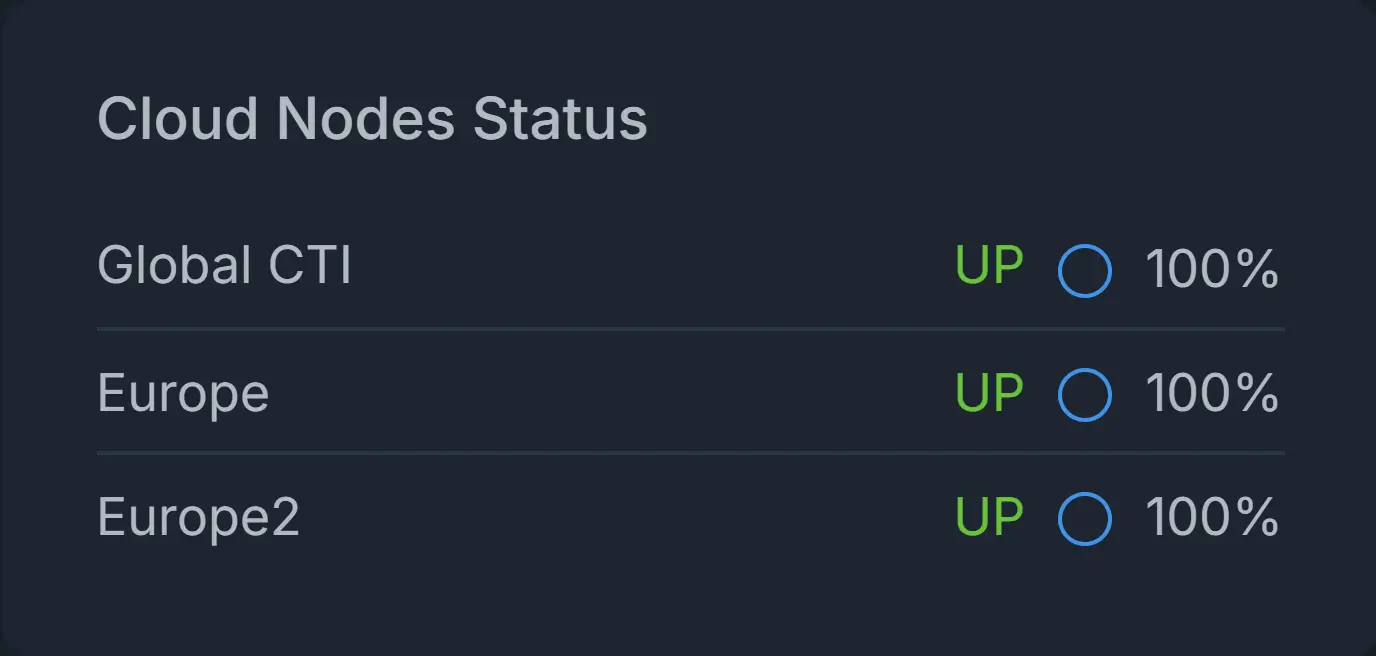
Figure 18. Services Status(Cloud Node Status)
You can check whether one of the services is running or not by viewing the related pane on the dashboard.
Also, you can start, stop and restart the Zenarmor-related services by clicking the management buttons on these panes.
For more information, please refer to Status.
7. System Utilization
You can view the following system (node) level information on the dashboard:
-
CPU Utilization: The real-time CPU usage is displayed on this pane. You can view CPU usage percentage and CPU load.
-
Disk Space Utilization: Zenconsole displays disk utilization seperately for each partition on the platform. Utilization of each partition is automatically displayed in a slide-show. You may also navigate between the partition utilizations by clicking on the sliding icons at the bottom of the pane. You can view the following information:
-
Total disk usage of each disk partition
-
Total size of each disk partition
-
Usage percentage of each disk partition
-
Mount point of each disk partition, such as
/,/tmp, or/usr/local.
-
-
Memory Utilization: Real-time memory usage is displayed. You can view the following information:
-
Total memory of the system
-
Amount of Used memory
-
Usage percentage of the memory

Figure 19. System Utilization
-