Configuring the Live Sessions
The Live Sessions page provides several options for customizing the interface and managing how session data is displayed. These features help administrators tailor the session table to their monitoring, troubleshooting, and investigation workflows.
You can configure the Live Sessions interface using the configuration bar located at the top of the page.

Figure 1. Live Sessions Configuration Bar
The following sections describe each configuration option in detail.
Changing the Layout or Add/Remove a Field (Column)
You can customize the Live Sessions for each report view separately.
To add/remove a field (column) to/from the Live Sessions of a report view:
-
Select the report view (Connections, Threats, etc.) that you want to customize.
-
Click the Layout button on the configuration pane to open a scrollable list.
-
Click on the toggle button next to the field (column) that you wish to add to or remove from the list.

Figure 2. Add or remove fields/columns
The order of the fields/columns may also be changed in the Live Sessions report.
To move up/down, drag and drop the move button  next to the field/column that you wish to move.

Figure 3. Changing the order of the fields (columns)
Adding a Generic Filter/Exclusion on the Live Sessions
Filters may be applied to the Live Sessions to drill down to the data you wish to see. You can use the equals operator for filtering and the not equals operator for exclusion. Also, contains and does not contain parameters are available for more flexible filtering. You may apply more than one filter to the report. These filtering/exclude parameters are displayed on the top of the reporting page.

Figure 4. Filtering on a Live Sessions (Connections filtered out for Source Hostname and Destination Hostname)
To apply a filter to the Live Sessions you may follow next steps:
-
Click on a value in the field/column that you wish to apply a filter. This will display a drop-down menu with available filtering options, Filter and Exclude.

Figure 5. Applying Filters via Live Sessions
-
Click on Filter or Exclude depending on your needs.
-
The Live Sessions will be updated automatically and the applied filter will be displayed at the top of the report.
For example, while viewing the Connections tab, you can click a value in the Source Hostname or Destination Hostname column and select Filter or Exclude from the context menu. The selected criterion is immediately applied, and the session table is updated accordingly. Multiple filters can be combined to refine the displayed results.
Alternatively you may exclude a parameter on the Live Sessions by following the next steps:
-
Apply a filter as explained above. The applied filter parameter is displayed at the top.
-
Click on the
equals (=)sign on the applied filter parameter to change it to thenot equals (≠)sign. The report will update automatically according to the exclusion parameter.
You may apply a filter on the Live Sessions by using the Filter button on the configuration bar. For more information, please refer to filtering on configuration bar.
Saving or Resetting Filters in the Live Sessions
After one or more filters have been applied, additional filter management controls become available on the Live Sessions toolbar.
To remove an individual filter or exclusion, click on the x icon next to the filter/exclude parameter at the top of the Live Sessions page.
The available filter management controls include:
- Save Current Filters
- Reset All Filters
Save Current Filters saves the current filter configuration as a reusable preset.
Reset All Filters removes every active filter from the report while preserving previously saved filter presets.

Figure 6. Filter Management Controls
Also, by clicking on the Reset All Filters button you may clear all defined report filtering settings.
Setting the Time Range
The Time Range selector allows you to specify the reporting period.
Available options include:
- Last 30 Minutes
- Last 6 Hours
- Last 12 Hours
- Last 24 Hours
- Last 72 Hours
- Last Week
- Custom Range
To change the reporting period:
- Click the Time Range selector.
- Select the desired period.
The selected time range is automatically applied to all charts and widgets within the current report view.

Figure 7. Time Range
With the custom range, you can create a report for a specified time range. To set a custom time period you may follow next steps:
-
Click the Time Range selector. This will open a drop-down menu.
-
Click on the
Custom range. This will open a window to set theStart dateand theEnd dateof the report.
Figure 8. Setting a custom time range
-
Set the
Start dateand theEnd dateas you wish. You can either enter the date and time manually or select them by clicking on the related icons (calendar/clock).
Figure 9. Setting Custom Start Date for Live Sessions

Figure 10. Setting Start Hour/Minute of the Live Sessions
-
Click the
Applybutton.
Setting the Refresh Interval (Gateway Live Sessions only)
The Refresh Interval determines how often Live Sessions data is automatically updated.
Available intervals include:
- Pause
- 1 Minute
- 5 Minutes
- 15 Minutes
- 30 Minutes
- 1 Hour
To change the refresh interval, follow the steps below.
- Click the Refresh Interval selector.
- Select the desired interval.
Report data will automatically refresh according to the selected interval.
You can also refresh report data immediately by clicking Refresh.

Figure 11. Configuring the Refresh Interval*
Setting Row Count
By default, live sessions are displayed in 100 rows. To change the row size in Live Sessions you may select on of the available options via Row Count drop-down menu on the configuration bar. Available row count options are as follows:
-
25 Rows
-
100 Rows
-
500 Rows
-
1000 Rows
-
Custom

Figure 12. Setting Row Count of the Live Sessions
You may also set a custom row size by following next steps:
-
Click on the Row Count drop-down menu on the configuration bar. Available row count options will be listed.
-
Select Custom.
-
Type the number of lines that you want to see in the Live Sessions.
-
Click Set button to activate the settings.

Figure 13. Setting Custom Row Count of the Live Sessions
Bookmarks (Saved Filters)
The Bookmarks button provides access to previously saved filter presets.
Saved filters allow administrators to quickly reuse commonly used filtering configurations without recreating them manually.
Viewing Saved Filters
You may easily view your saved filter by clicking on Saved Filters button located in the report configuration bar. This will display a window listing all saved filters.

Figure 14. Bookmarks (Saved Filters)

Figure 15. Bookmarks (Saved Filters) List View
Applying Saved Filters
You may apply previously saved filters to your reports by following these steps.
- Click on Saved Filters button located in the report configuration bar. This will display a window listing all saved filters.
- Select the filters that you want to apply.
- Click Apply button. This will automatically apply the saved filter to reports.
Updating Saved Filters
You may update previously saved filters by following these steps.
- Apply some filters to reports depending on your needs.
- Click on Saved Filters button located in the report configuration bar. This will display a window listing all saved filters.
- Select the filters that you want to apply.
- Click Update button. This will display a message box for confirmation.
- Click Update button to update the preset filter with the current applied filters.
Deleting Saved Filters
You may easily delete your saved filters by following these steps.
- Click on Saved Filters button located in the report configuration bar. This will display a window listing all saved filters.
- Select the filters that you want to remove.
- Click Remove From Saved Filters button. This will display a message box for confirmation.
- Click Remove button to delete the saved filter.
Setting Time Format
The Settings menu provides display preferences for report timestamps.
From this menu, administrators can:
- Switch between 12-hour and 24-hour time formats.
- View the time zone currently used for report timestamps.
The menu displays the available time format option. For example, if reports are currently displayed using the 12-hour format, the menu provides the option to switch to the 24-hour format, and vice versa.
To change the time format:
- Click the Settings icon on the report toolbar.
- Select the available time format option.
The selected format is immediately applied to timestamps throughout the current report view.
The current report time zone is also displayed in the Settings menu for reference.

Figure 16. Report Settings
Loading more Session Records
The details of the last 100 sessions are shown by default on the Live Sessions. After scrolling down to the end of the list, the next 100 sessions may be displayed by clicking on the load more button.

Figure 17. Loading More Session Records
Sorting
You may sort the Live Sessions by any field. The report is sorted by Start Time in descending order by default. To change the sort type of the Live Session you may follow next steps:
-
Hover your mouse over the field name on the title bar that you wish to sort by.
-
Click on the field name that you wish to sort by. This will automatically sort the report in ascending order.
The sort order of Ascending or Descending may be selected for the Live Sessions. By default, the Explorer is sorted in descending order so that the newest information is displayed first. Clicking on the field name will change the sort order from ascending to descending or vice versa. The report will automatically be refreshed after clicking on the field name.

Figure 18. Changing the sort order of the Live Sessions
Allow/Block a Connection
While monitoring live session activity, you may identify network traffic that should be allowed or blocked. Instead of navigating to the policy configuration pages, you can perform these actions directly from the Live Sessions page.
To allow/block a connection from the Live Sessions you may follow the next steps:
-
Find the session in the Live Sessions you wish to block or allow.
-
Click the Block button with circle with a slash icon in the Actions column to block the connection or click the Allow button with a checkmark icon in the Actions column to allow the connection. A dialog box for exclusion settings will be displayed.
-
Select the type of object you want to allow or block. Available options include:
- Hostname
- Application Category
- Application
-
You may type a Description.
-
When allowing or blocking a hostname:
- Enable Allow/Block this hostname globally to apply the rule across the entire deployment.
- Disable Allow/Block this hostname globally to apply the rule to a specific policy, then select the desired policy from the drop-down list.
-
(Optional) Enable Send this re-categorization as feedback to Zenarmor Team to submit the hostname classification for review.
-
Click on the Block or Allow button to create rule.

Figure 19. Adding Exclusion via Live Sessions
Querying Whois Record
To query whois data for a connection in the Live Sessions you may follow the next steps:
-
Go to the Actions column of a session.
-
Click on the Query Whois icon. This will popup new window which has two options for querying the destination domain name or the destination IP address.
-
Select one of the available query options.
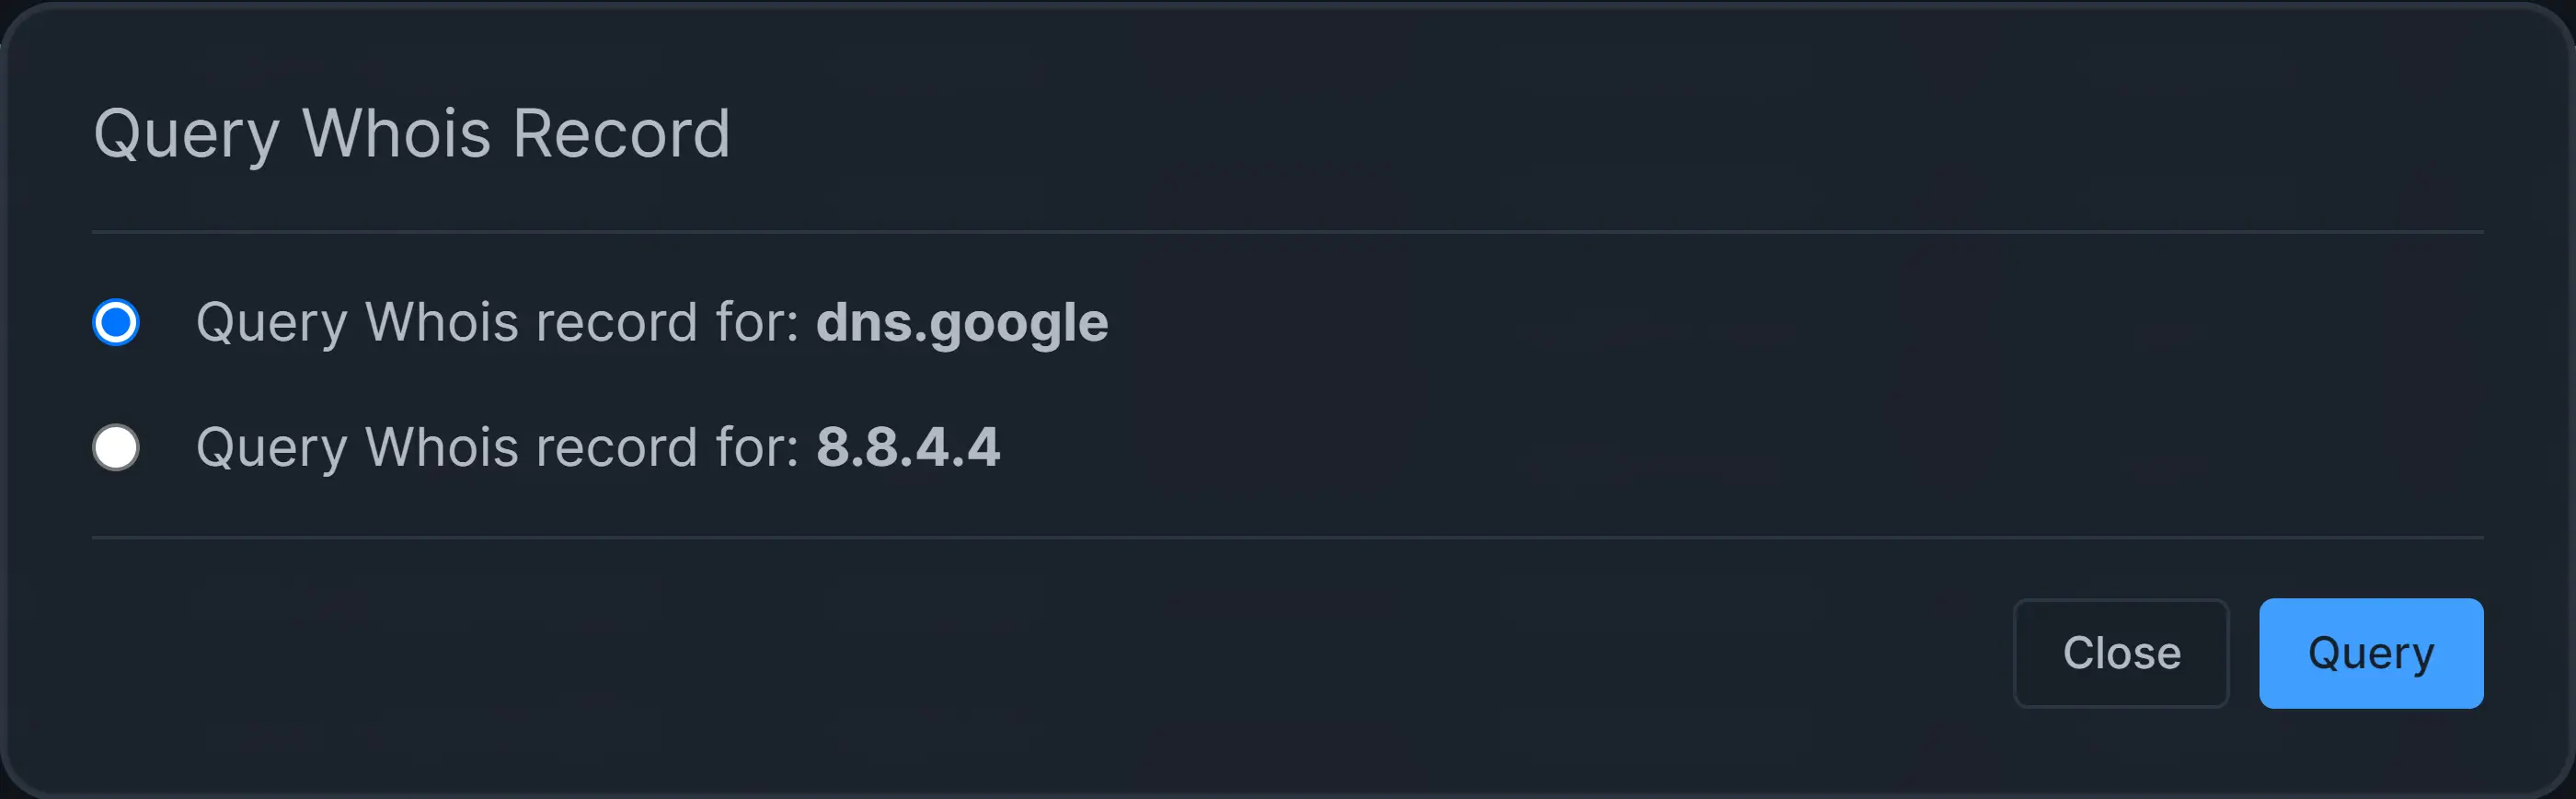
Figure 20. Querying Whois
-
Click on the Query button. This will display the Whois record.
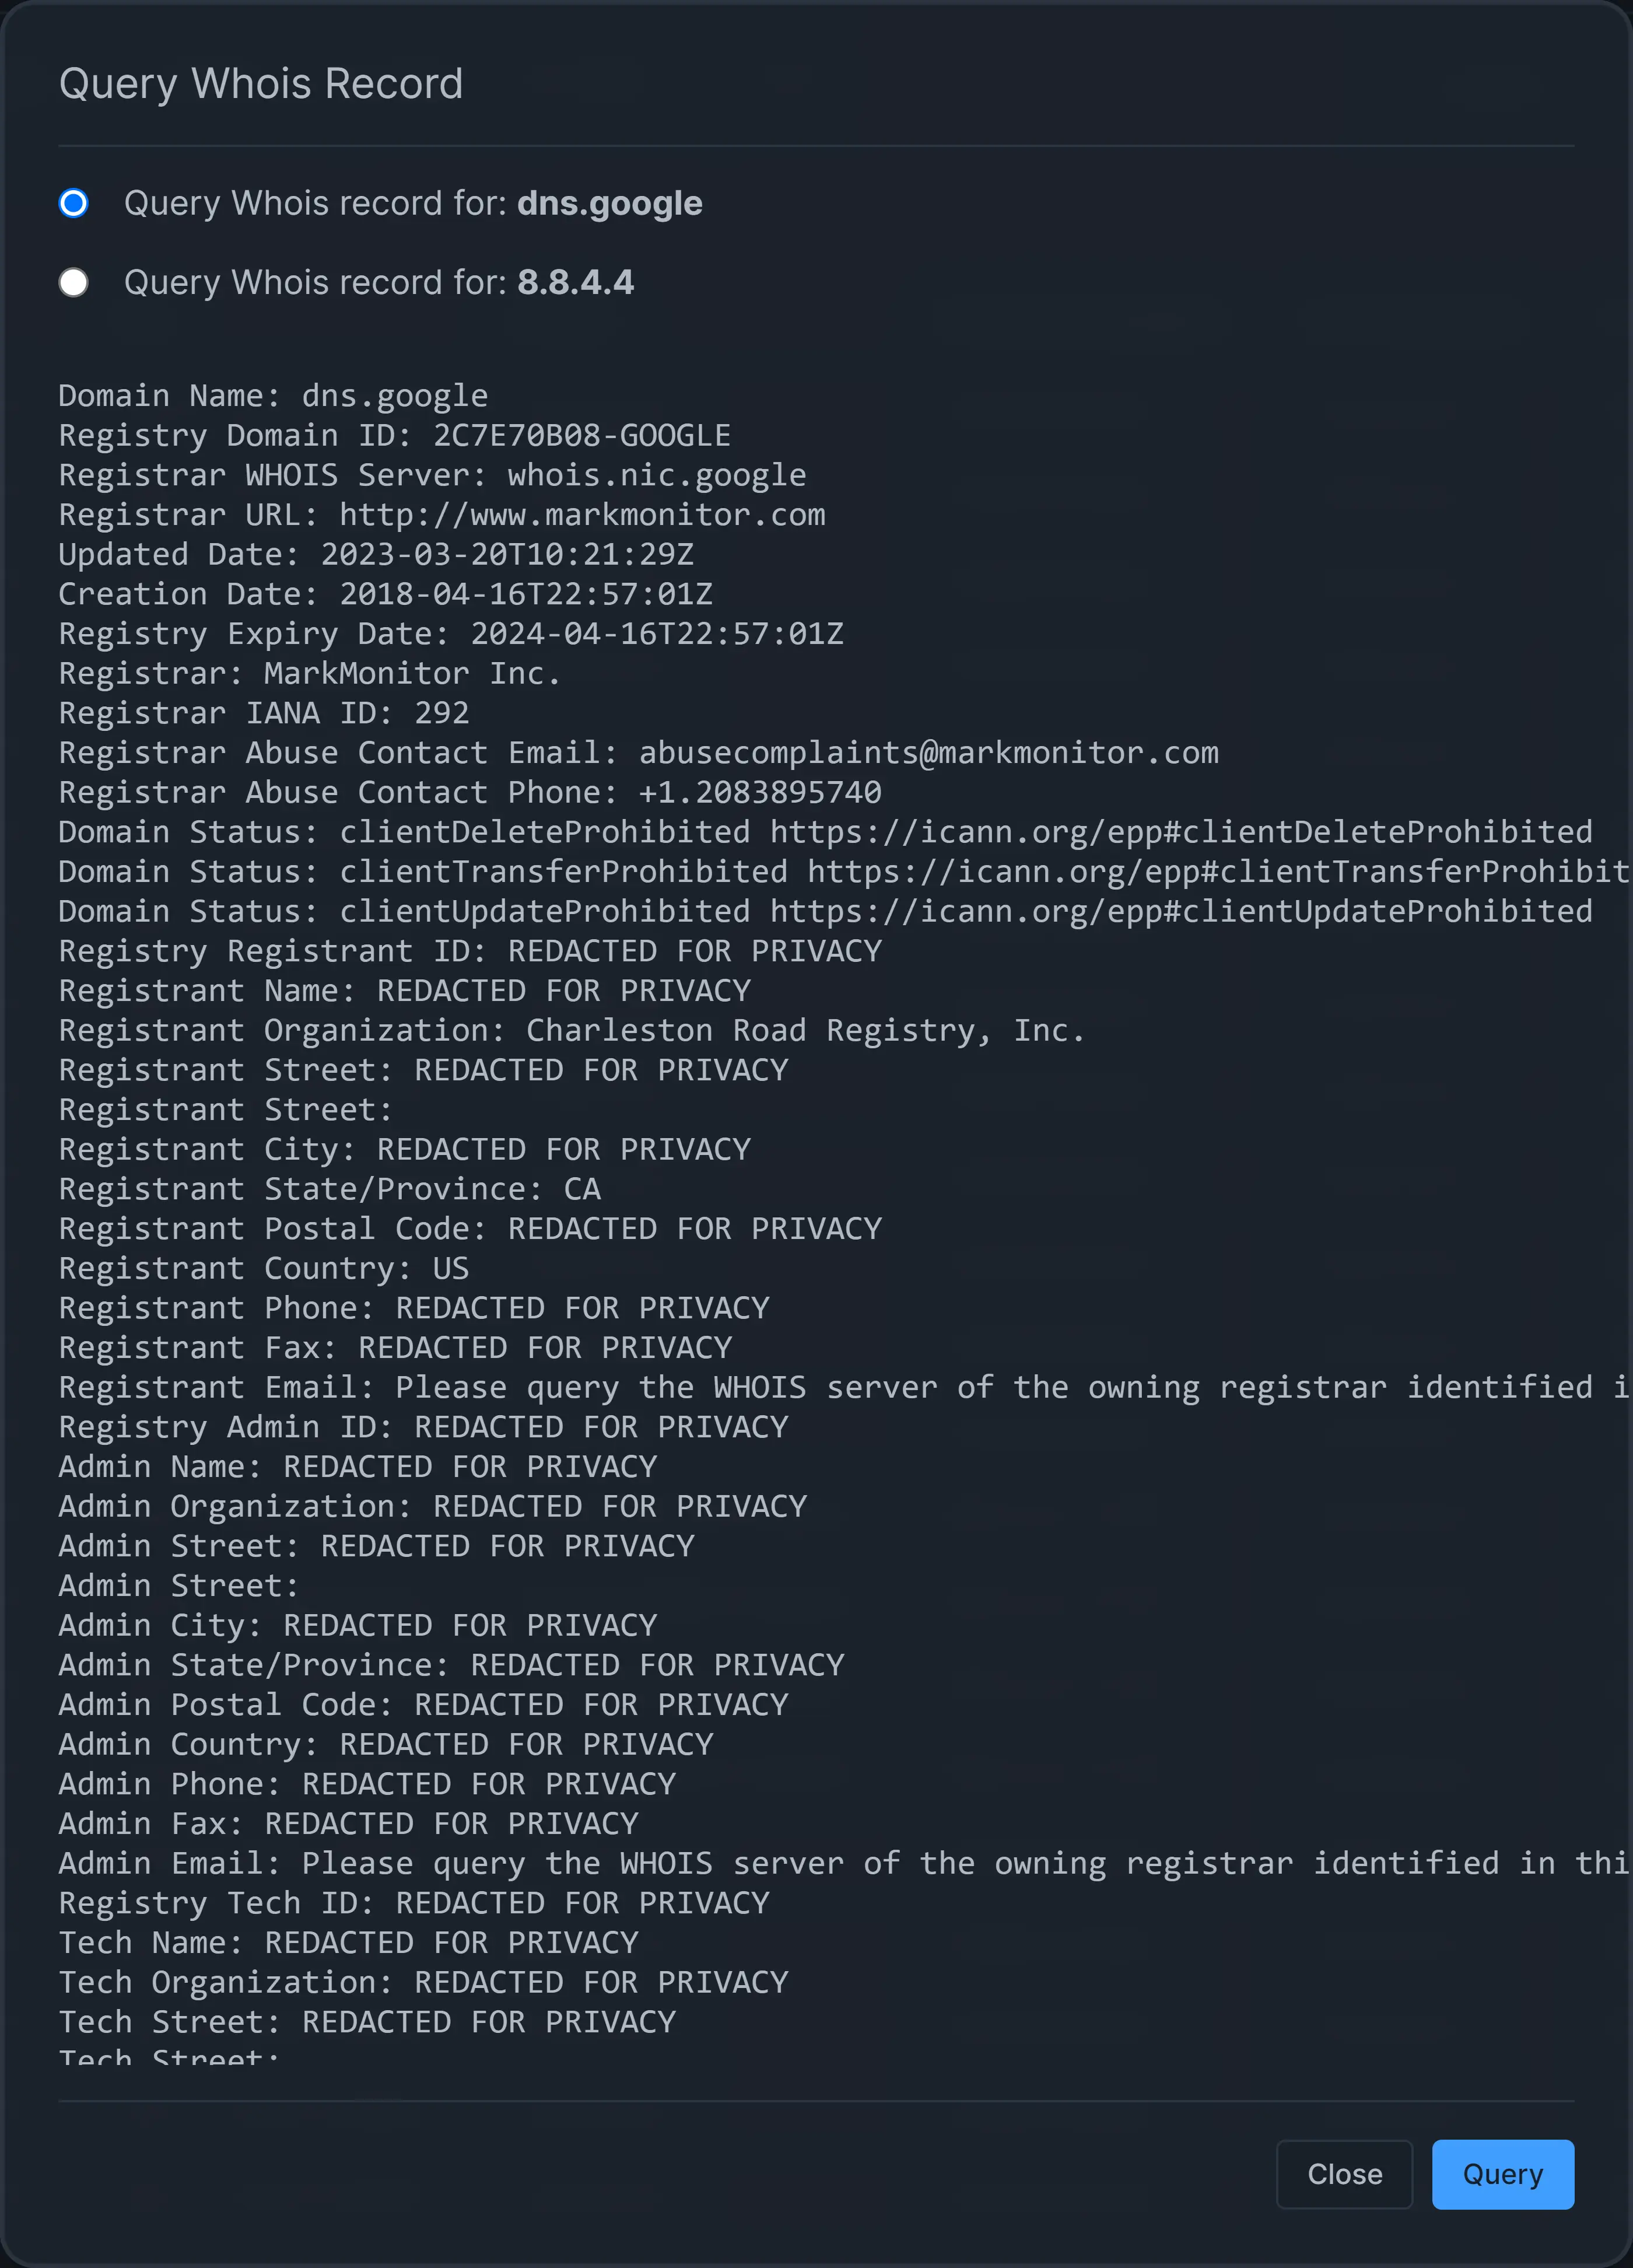
Figure 21. Displaying Whois Record
Excluding From TLS Inspection
Zenconsole allows you to exclude a domain from TLS inspection through Live Sessions by following the next steps:
-
Go to the Actions column of a session.
-
Click on the TLS Exclude icon.
-
You may update Hostname field. Generally, you may prefer to set a base domain instead of a subdomain.
-
Click on the Exclude button.
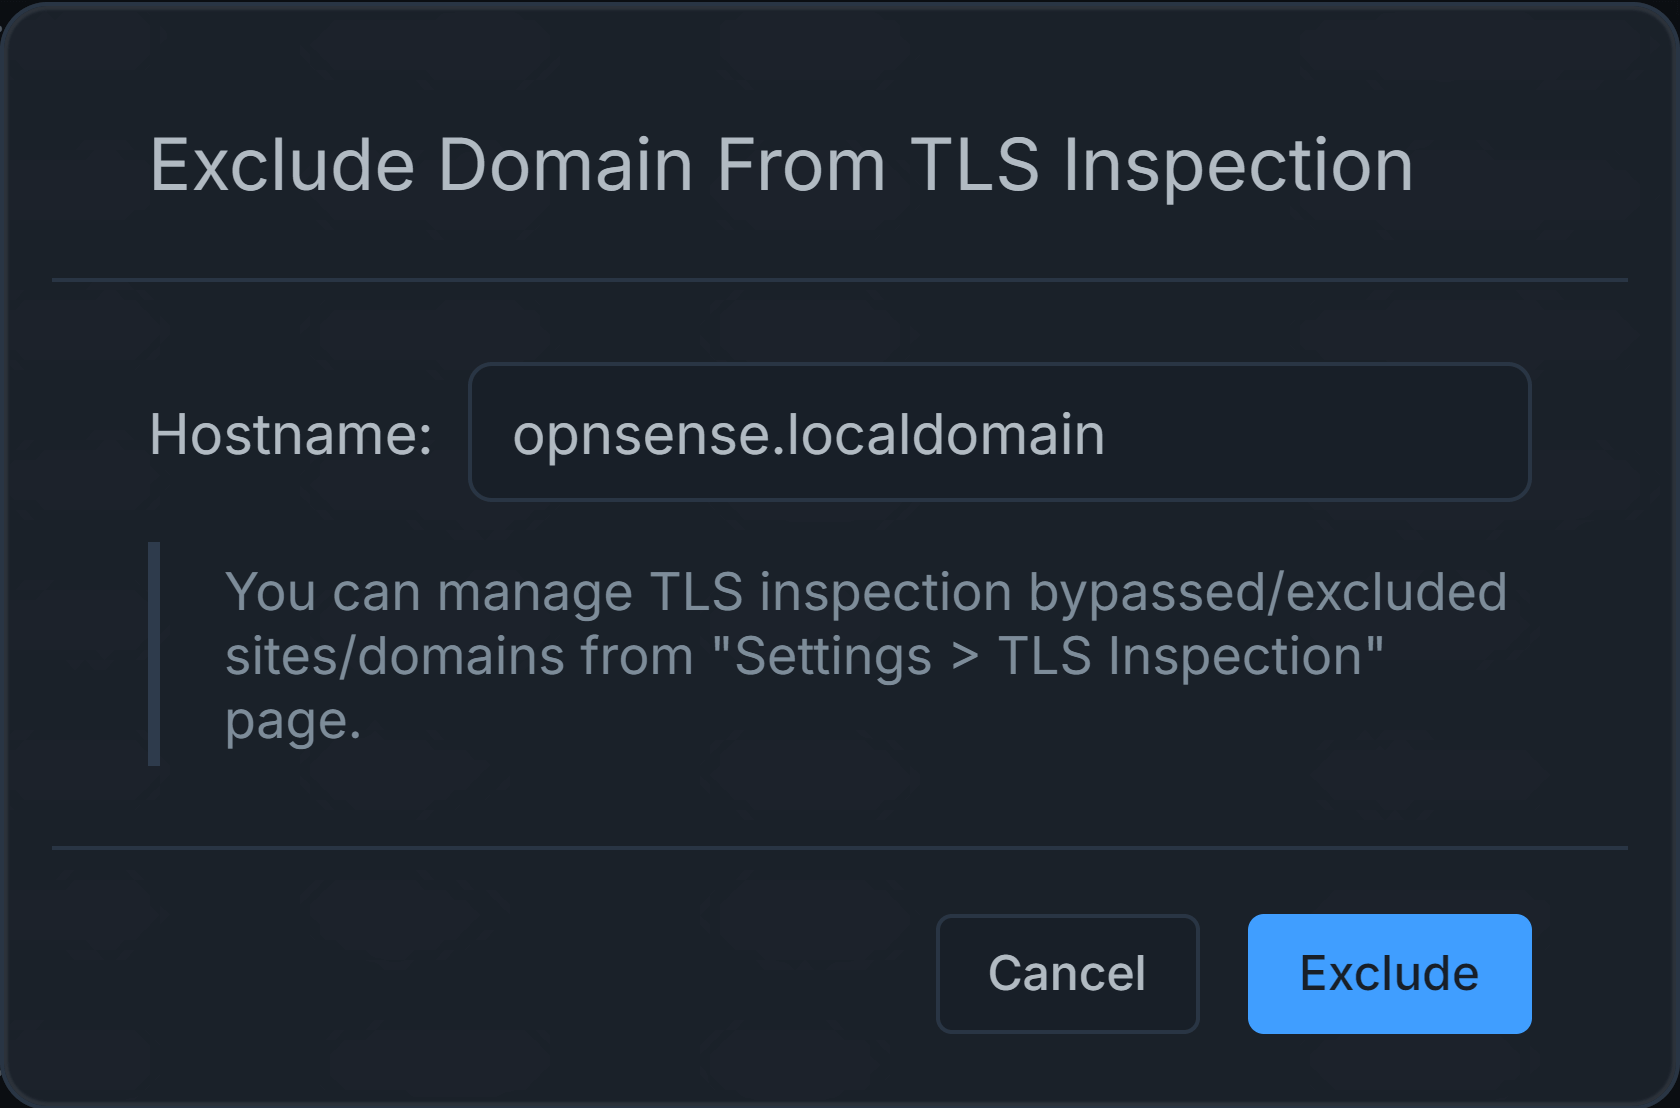
Figure 22. Excluding Domain From TLS Inspection
Pin/Unpin a Session Record
Zenconsole allows you to pin a session record for better traffic analysis and threat hunting. By clicking on the pin  icon in the first column of the session, you can easily pin a session record to the top of the
 Live Session Explorer page.
To unpin the session from the 'Live Sessions' page, click on the pin  icon in the first column of the pinned session.

Figure 23. Pin/Unpin a Session Record
Viewing Session Details
You can quickly and easily view the session details by clicking on the magnifying glass  icon in the first column of the session.

Figure 24. Viewing Session Details
Copy a Session Record
Zenconsole allows you to copy a session record to the clipboard. To copy the session record, click on the copy  icon in the first column of the session.

Figure 25. Copying a Session Record
Download CSV File
You can download the Live Session Details Report to a CSV file easily by following the next steps:
- Click the Download button at the top right of the Live Sessions page. This will open a drop-down menu.
- Click CSV button to export Live Sessions.
Export CSV Feature is not available for Free Edition. To benefit from the custom report feature, you must have one of the paid Zenarmor subscriptions. For more information about plans & pricing.
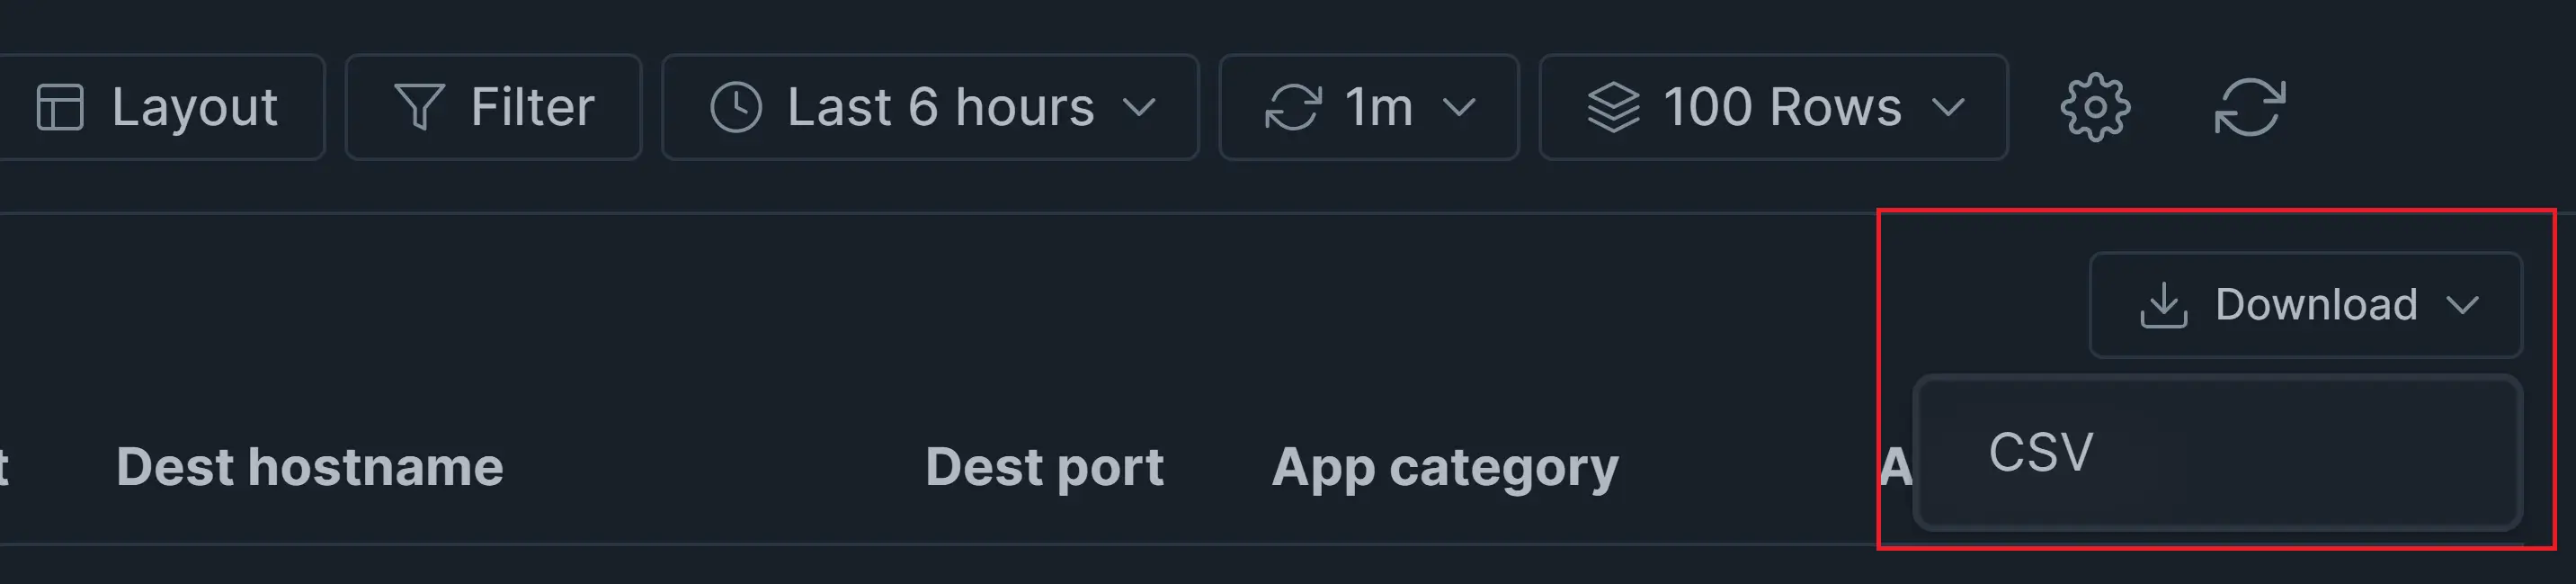
Figure 26. Exporting CSV